1.2.5 Creating an App with the Experience Builder
As we saw with the Map Viewer and configurable app templates, there is also a newer technology for building apps from scratch -- Experience Builder. Let's walk through creating a similar app on that platform.
- Re-open your Buildings map using the current Map Viewer, click Create app, then Experience Builder.
You'll be presented with several templates to use as a starting point. Each one is shown in wireframe form to give you a quick preview of its widget layout. Note that you can hover over these wireframes to get a description of the template or click the Preview buttons to get a better idea of the template's layout. A number of templates could work here; let's go with Foldable. - Click the Create button associated with the Foldable template.
- Feel free to go through the short tour of how Experience Builder works, or click Skip.
Where Instant Apps are designed to get an app up and running quickly by walking through a short set of numbered steps, Experience Builder is much more open-ended and can appear overwhelming at first. But let's break down the most important aspects of the interface.
The largest panel, in the middle, shows your app in a sort of design view referred to as the canvas.
To the left of the canvas is the sidebar, a panel whose contents depends on which of the four tabs on the very left side of the window is selected. These tabs, working from top to bottom, allow you to add new widgets to the app, access the widgets already included in it, define the data used by the app, and set an app theme.
To the right of the canvas is a settings panel, which shows settings associated with whatever widget is selected either in the sidebar or the canvas. - If it's not already selected, select the Page tab.
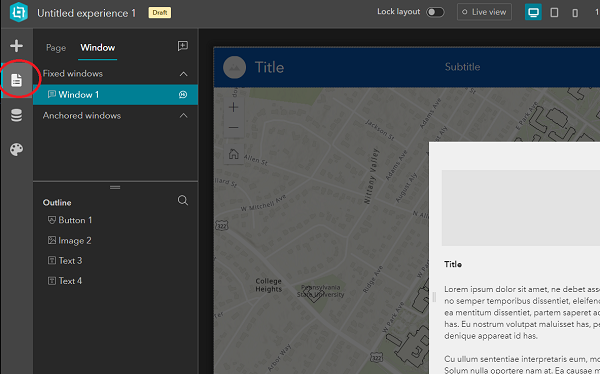
Figure 1.19 Selecting the Page tab in Experience Builder
On the canvas, you should note a "fixed window" -- having an ID of Window -- resembling a splash screen. - If the canvas is zoomed in on your app and you'd prefer to see all of its elements, you might like the Fit width to current window button, the second button in from the right side of the window, in the narrow strip of controls running along the bottom of the window.
"Window" contains placeholders for an image, two text elements (one for a title and one for the app description), and a button (to dismiss the window).
- Select Image 2, either in the sidebar or on the canvas. This will populate the settings panel to the right with the settings associated with that image.
- Working in the settings panel, modify Image 2 by going to Select an image > URL, and setting the URL to https://www.e-education.psu.edu/geog863/sites/www.e-education.psu.edu.geog863/files/PSU_UPO_RGB_2C.png.
- Double-click on the Title element (Text 3) on the canvas to edit that text and set it to Campus Buildings Map.
- Likewise, set the description (Text 4) to Enter a text string in the search box to find all buildings containing your search string.
We won't change anything else in the Window widget, but note that the checkbox text and button label are customizable. You might also choose to shrink the Window in size since the amount of text being displayed is small. - Finally, in the sidebar, hover your mouse over the Window entry. You should see a small "word balloon" icon that is identified as the Set as splash button. The Window widget should be set as a splash window by default, so you should not need to click this button. If you do, you'll be disabling the splash behavior. This isn't a very well designed setting as there doesn't appear to be any indicator for a window being set as splash or not...
- To access the map and other widgets in the background, click on the Page tab at the top of the sidebar. (The Window tab has been selected up to this point.) Again, the Fit width to current window button could come in handy here.
- Looking at the info in the sidebar, note that the app is composed of a single page, and that page contains a Sidebar widget (named Sidebar), not to be confused with the sidebar panel that is part of the larger Experience Builder interface. The Sidebar widget covers the entire canvas and is a container for other widgets. As its name implies, it can be used to display widgets in a primary panel and a secondary panel (on the side).
The widgets nested within "Sidebar" can be viewed by expanding the containers listed in the Experience Builder sidebar.
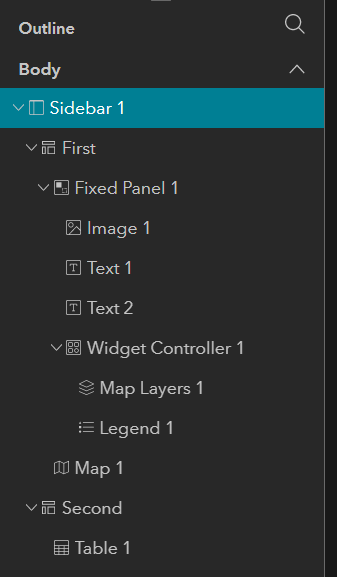
Figure 1.20 Contents of the Sidebar widget
The First (primary) container holds a Fixed Panel widget (the strip running across the top of the app) and a Map widget. The Second (collapsible side) container holds a Table widget. - Click on Sidebar in the sidebar and note in the settings panel that, among many other settings, it's possible to specify which side the Second container is docked on, the size of the Second container, and whether it is Collapsed or Expanded by default. Feel free to change any of these settings if you like.
As noted, the Second container holds a Table. Let's make sure that widget is configured properly. - Select Table in the sidebar to view its settings.
- Click New sheet > Select data, then expand the list of layers/tables in your PSU Buildings web map.
- Finally click on the buildings layer to select it as the source for Table's data. You should see the table become populated with data on the canvas.
As we did earlier, let's limit the fields shown in the table. - Under the Configure fields heading, select Customize. You should see that there are several fields selected for initial display. A field's visibility can be toggled off by clicking on the "eye" icon to the right of its name.
- Toggle off the visibility of most of the fields, leaving only the following visible: BLDG_NAME_ and Shape_Area.
The rows showing in the table have no BLDG_NAME_ value, unfortunately. It would be nice if we could filter out unnamed buildings... - At the top of the Sheet configuration panel, where the buildings layer is shown as the data source, there is a dropdown list with Default selected. The Default refers to the default view of the data. If the scenario called for it, we could define custom views of the data (say, those with a Shape_Area greater than a certain threshold), assign names to those views, and choose to have the widget show the data associated with one of the views. We don't need to do that, but let's look at configuring the Default view.
- Click on the view dropdown. The Default view should appear with a small Settings button (gear icon) next to it.
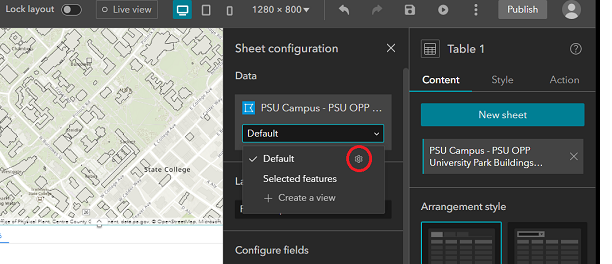
Figure 1.21 Accessing the Default view's settings
- Click on this Settings button.
The resulting dialog contains 3 tabs: Filter, Sort, and Records. Under the Filter tab, we could build a query that limits the rows returned to some subset, like just big buildings. Under the Sort tab, we can define sorting rules, and under the Records tab, we can control the number of rows that the table displays.
I encourage you to experiment with these capabilities. I attempted to display only rows where BLDG_NAME_ is not blank, but that didn't filter out the ones that have no name. I suspect those rows hold an empty string rather than a Null value, but had no luck with other attempts to filter them out. If anyone figures out how to solve this problem, please post how you did it in the Discussion Forum.
Sorting the table on BLDG_NAME_ in ascending order would probably be the most useful to the end user, but unfortunately the empty rows will show up at the top of the list. So I suggest sorting on Shape_Area in descending order (putting the buildings with the largest footprints at the top).
With the table configured, let's shift our focus to the strip of widgets found along the top of the app. - Click on Image (nested within Fixed Panel) in the sidebar.
- Set this image to display the PSU shield we used earlier in the lesson. Here's the URL again:
https://www.e-education.psu.edu/geog863/sites/www.e-education.psu.edu.ge... - And let's make this image a link that opens the Penn State home page:
Set link > Link to URL > https://www.psu.edu > Open in new window - Set the Title widget (named Text) to Penn State Campus Buildings and the Subtitle (named Text 2) to University Park. You may need to widen the Text element and shift the Text 2 element a bit to the right to get the text to show up properly.
As in our earlier apps, the Legend and Layer List widgets aren't really needed here. They could be removed individually by hovering over them in the canvas and clicking the X that appears in their upper-right corner or via the 3 dots menu in the sidebar. Or... - Since we don't need any widgets here, click on the 3 dots menu next to Widget Controller in the sidebar, then Delete to remove that complete set of widgets from the app. When asked whether you really want to do that, click Delete again.
The primary functionality that we want to build into this app is the ability to find a building by name. You may notice that there's already a Search icon in the upper right of the map, which seems promising. Let's see if we can configure that tool. - Select the Map widget in the sidebar. In the settings panel, note that we could choose to use a different web map or web scene as the source for this widget.
Scrolling down through the settings, note the Tools section, where we can see that the Zoom and Home tools are toggled on. Many other tools are available as well. However, there doesn't appear to be a way to customize the Search tool. Let's test out the app to see how that tool works. - First, give the app a more descriptive name by clicking on the Untitled experience 1 text in the upper left of the window and entering a new name like Penn State Main Campus Building Finder (Exp Builder).
- Next, click the Save button in the upper right to save the work you've done.
- Now, click the Preview button (the "Play" icon just to the right of Save) to open your app for testing in a new tab.
You should see "Window" appear in the foreground as a splash screen. (If you don't, you'll need to go back to Experience Builder, to the Window tab, then click the Set as splash button for the Window widget.) And you should be able to access the table by clicking the small arrow in the bottom middle of the app. - Open the Search tool and enter a test search term (e.g., Walker, for Walker Building, home of the Geography Department on the west side of campus). Depending on your search term, you may get a hit on a campus building, but you'll also get back matches on streets, towns, etc. It appears that the Search tool built into the Map widget is hardwired to use the ArcGIS World Geocoding Service.
How will we provide a way to search for matches in the buildings layer then? Well, we can configure the Map widget's built-in Search tool as we did earlier for the Instant App. - Return to the Experience Builder tab in your browser and expand the widget list within the Map in the sidebar. You should see an entry for the Search widget you just tested.
- Click on the Search widget to open its properties.
- Click on the New search source button and go through the same steps you followed earlier so that the widget is configured to search the BLDG_NAME_ field in the buildings layer.
- Save your work and confirm that the app now allows for searching the building layer.
One thing we haven't mentioned to this point is the device being used to view the app. In your testing so far, you've probably viewed it using a relatively large screen (e.g., on a laptop). However, apps may be, and often are, viewed on smaller-screen devices such as tablets and smartphones. - Looking at the app preview window/tab, slowly shrink the size of the window (particularly the width). This is a relatively simple UI, so you won't see much difference at smaller sizes. However, at roughly half the width of an average laptop screen, you should see that the Text 2 widget (which we set to display the text "University Park") should disappear. This is the behavior you should expect when viewing the app on a typical tablet (e.g., an iPad).
If you continue shrinking the window to 1/4-1/3 your laptop width, you should see the UI change again, with the Zoom and Home buttons shifting from the upper left of the map to the lower right. - Return to the Experience Builder and note the three screen icons in the top middle region of the interface. The leftmost, selected by default, is the button to select to configure the app for viewing on large screens. The middle button is for configuring the app for medium (tablet-sized) screens, while the rightmost button is for small (phone-sized) screens.
- Switch to the medium view and note that the Text 2 widget disappears, consistent with what you should have seen when resizing the app preview window. In Esri's terminology, the widget's been moved to the app's Pending list.
- To see this list, toggle off the Lock Layout switch. Then open the Insert widget panel (+ icon) and select the Pending tab. It's important to note that widgets on the Pending list should not be deleted altogether or they won't be visible on any device.
Depending on the complexity of your app, you may need to switch to the medium and/or small views and reconfigure aspects of the UI. As a very simple example, you might adjust the sizes of the Text and Text 2 widgets and shift to the Text 2 widget beneath the Text widget in the medium and small views (and leaving them side by side in the large view). (Alternatively, you might also be able to adjust the sizes such that they can fit next to each other at all screen sizes.) You should experiment with adjusting the interface in the medium and/or small view to get a feel for the design process.
With that, you've built a few apps that could be implemented in real-world scenarios using both newer and older Esri technologies. Best of all, you didn't have to write a line of code. One thing I hope you'll take away from this exercise is to remember that these no-coding tools exist and to look for opportunities to take advantage of them.
Move on to the next page of the lesson to solidify what you've learned here with an assignment that requires you to build another app using data and requirements of your own choosing.