Module 12: Adaptation and Mitigation
Module 12: Adaptation and Mitigation
Introduction
Now, at the end of this course, we will explore what can be done about climate change. We know that it is happening and that the impacts of climate change are serious, affecting a broad range of important features of our habitat and our economic system. We also know that even if we take immediate serious steps to reduce emissions, climate change will continue to occur because of lag times in the climate system. This means that adapting to this changing world is a necessity. Intelligent adaptation also means mitigation. Mitigation of climate change refers to anything that can minimize the amount of climate change or damages from climate change. It makes sense to pursue both of these things at the same time as we plan for the future, and if we do these things intelligently, there is every reason to expect that we can continue to thrive — but there will be some big challenges. One of the biggest challenges has to do with the fact that the rich nations of the world are quite capable of managing these adaptations, but many of the less wealthy nations will face serious challenges; there will need to be some serious thinking and planning about international aid to make the global adaptations successful for all.
Humans have successfully dealt with dramatic climate change in the past, but it has been a long time since we've confronted this kind of change. Let us not forget that humans were around during the last deglaciation when the temperature rose and sea levels rose more than 125 meters (gradually, though), and even through the Younger Dryas event of ~ 11 kyr ago when the North Atlantic region cooled by > 5°C in a decade or so and then warmed that much a few hundred years later. So, in thinking about how we can cope with climate change, it is not a matter of whether or not we will survive (there can be no serious question about that), but rather how successfully and smoothly we can adapt.
By this point in the course, you also have learned about the observations that tell us how the climate is changing and how those changes are affecting and will continue to affect many aspects of the Earth that are of great importance to humans. In this module, we take a look at the economic dimensions of climate change to better understand the costs and benefits of different approaches to dealing with climate change. We will also explore some possible consequences of different policy decisions to deal with carbon emissions.
In many respects, we are living in the age of climate change — we have just recently assembled the scientific understanding of how the climate is changing and how it is likely to change in the future, and the changes are occurring fast enough that we need to make some decisions rather quickly about what we will do. In many respects, this is the biggest and most important global problem we face at the present time, and in the coming decades; it is a problem that touches most aspects of human activities and welfare.
One could say that there are two extreme responses we could take — do nothing, or do everything within our power to stop climate change immediately. Neither of these extremes makes sense from an economic standpoint. Ignoring problems that are obvious is not a smart move — by doing nothing now, we subject ourselves to huge damages in the future. But going overboard is not smart either — if we allocate all of our resources to counter climate change, we risk damage to the global economic system that we are all dependent upon. The trick then is figuring out what course of action makes the most sense — what course of action will lead to the greatest good for present and future generations. What can we do that will be effective in limiting the amount of climate change while keeping the global economy healthy?
This module will lay the groundwork for carrying out some experiments with a computer model that will allow us to see what the economic costs are of pursuing different policies regarding climate change.
Goals and Learning Outcomes
Goals and Learning Outcomes
Goals
On completing this module, students are expected to be able to:
- describe the economic consequences of different scenarios of carbon emissions;
- explain the economic impacts of climate change;
- evaluate the strategies for limiting carbon emissions;
- project consumption, investment, depreciation, discount rate, and productivity changes as a result of climate change;
- propose adaptation/mitigation strategies relating to agriculture, energy, water resources, transportation, human health, and ecosystems;
-
recommend mechanisms for global geoengineering to reduce CO2 and the potential benefits and dangers associated with these plans.
Learning Outcomes
After completing this module, students should be able to answer the following questions:
- What are the market and non-market costs of climate change?
- What are the costs associated with conversion to nonfossil-fuels sources of energy?
- How do carbon capture and storage work?
- What are the nuts and bolts of Cap and Trade policy?
- What are the nuts and bolts of Carbon Taxation?
- How can agriculture adapt to climate change uncertainties?
- What can countries do to adapt to predicted precipitation changes?
- Which energy-producing regions in the US are particularly sensitive to climate change?
- In what part of the US is energy production especially vulnerable to climate change?
- How can heat waves impact urban areas?
- Which infectious diseases are promoted by climate change?
- How and where will climate change lead to forced migration?
- How will transportation systems deal with climate change?
- What are geoengineering strategies designed to mitigate the impacts of climate change?
- How and where is climate change not equable?
Assignments Roadmap
Below is an overview of your assignments for this module. The list is intended to prepare you for the module and help you to plan your time.
| Action | Assignment | Location |
|---|---|---|
| To Do |
|
|
The Economic Costs of Climate Change
The Economic Costs of Climate Change
There are a variety of ways that climate change will have an economic impact — some are gradual changes such as increased cooling costs for buildings, while others are more dramatic, related to the higher frequency of extreme weather events, such as Superstorm Sandy or the heat wave of 2003 in Europe, which killed tens of thousands of people. The costs of storms like Sandy are immense — New York will spend upwards of 35 billion dollars responding to the damages. This is serious money, and it is the cost of just one storm in one state! Hurricane Katrina racked up damages that are estimated at 100 billion dollars or more.
Because climate change has been and will certainly continue to be variable across the globe, the economic consequences are likewise variable. Some regions are likely to experience a net benefit in many respects, while others are likely to suffer much more serious changes that pose great economic threats. Warming in some areas might lead to a gain in some sectors of the economy, while in others areas, warming might cause a significant economic loss in that same sector. Our goal in this section is to get a sense of what these costs are on a global basis, without losing sight of the fact that the story varies from region to region.
In a general sense, the economists who study this problem tend to divide the costs up into market and non-market costs. A market cost is a cost to some part of the economy that could be quantified in terms of dollars, while a non-market cost is a something that is not easily quantified because there is no market for it. A damaged ecosystem like a coral reef is an example of a non-market cost. The damage to reefs has a cost and the cost is probably multifaceted and widespread, but it is not something that can be measured or expressed in dollars. So, let's try to list some of the important market and non-market costs and then get around to the tricky business of trying to figure out how it might all add up on a global basis.
Market Sectors
Agriculture
All crops have an optimum range of temperature and precipitation and as these change throughout the globe, crops will either do better or worse. It is estimated that 80% of the global croplands and almost 100% of the global rangelands depend on rainfall, and as rainfall patterns shift, agricultural production will either increase or decrease. With temperature increases of less than 3°C, the agricultural impacts in the short term are mainly expected to be positive, but beyond 3°, the impacts will be mainly negative. It is likely that there will have to be shifts in the locations where we raise crops and graze animals, and those shifts will cost money as well.
Forestry
As with agriculture, the consequences of climate change in the forestry sector of the economy will vary from place to place, but one important factor is the spread of new diseases into forested areas that will decrease the productivity of this part of the economy. The recent spread of the pine bark beetle in the western US and the resulting devastation of coniferous forests there is a good example of the potential for future damages. Nevertheless, it is estimated that on a global scale, the forestry sector of the economy will show slight improvements.
Fisheries
Although natural fisheries are in decline globally, the attribution of this decline to climate change is not at all clear. In some regions, the dependence of a fishery on a broader ecosystem such as a coral reef will make it vulnerable to increased warming and acidification. On the whole, it is expected that there will be a continued shift to farmed fish production from the oceans, and this kind of managed food production appears to be less vulnerable to climate change.
Insurance
Insurance is actually the largest single industry in the world, and insurers are concerned about climate change because it is clear from their records of premiums collected and payments made in relation to weather catastrophes that they are losing their ability to effectively insure people against climate-related damages. The insurance industry is adapting and paying close attention to the relationship between global warming and more frequent severe weather events, but in the future, this will mean higher premiums and a greater cost to the economy.
Public Infrastructure
Global warming and consequent sea level rise will place burdens of the system of roads, pipelines, water supply, water treatment, power transmission lines, etc., that make up the infrastructure of countries. Governments will have to spend more to keep these systems running, and this will cause a drag on the economy.
Energy
As the climate warms, we will use more electricity for cooling and less energy for heating, but the balance will vary across the globe. For the US, the Environmental Protection Agency estimates that for a 1°C rise in temperature, we will use 5-20% more energy for cooling and 3-15% less energy for heating, so the net difference might be a very slight increase in energy consumption for cooling. It is interesting to note that the US is the largest user of air-conditioning in the world, but it is expected that China may surpass us by 2020. The best estimates on a global basis indicate that we will spend more on increased air-conditioning than we will save in reduced heating, so this is another economic burden.
Tourism/Recreation
In mountainous areas around the globe, more and more snow-makers are appearing, as ski resorts try to keep themselves viable by preventing the ski season from decreasing its duration. There are vast economic stakes in the tourism that is based on recreation of this type. Also, beach resorts face challenges from a rising sea level.
Non-Market Sectors
Human Health
As the climate changes, human health will face challenges that will ultimately cost money. The spread of tropical diseases, such as the West Nile Virus, into areas where these diseases were unknown before, make new demands on health care. Heat waves, which will likely become more severe and more frequent, can pose significant health risks (thousands died in France during a 2003 heat wave).
Ecosystems
Coral reefs and many other marine ecosystems are threatened by warming and acidification; coastal terrestrial ecosystems are threatened by sea level rise; polar ecosystems are threatened by loss of ice and warming. All of these are changes that are underway, but their costs to the global economy are nearly impossible to figure out.
Freshwater Resources
As glaciers melt and winter snows are diminished, an important source of freshwater will decline; as precipitation patterns change, surface water will decrease and groundwater aquifers will become depleted even faster. These costs are likely to be very significant in some regions, and those costs will undoubtedly be transmitted to the global economy in one way or another.
Summing up the Costs
Numerous economists have tried to sum up the costs of global warming, including William Nordhaus, who needed a formulation for these costs for his DICE model. In Nordhaus' view, the best way to do it is to express the damages as a percentage of the global economic output, and the relationship he adopted looks like this:
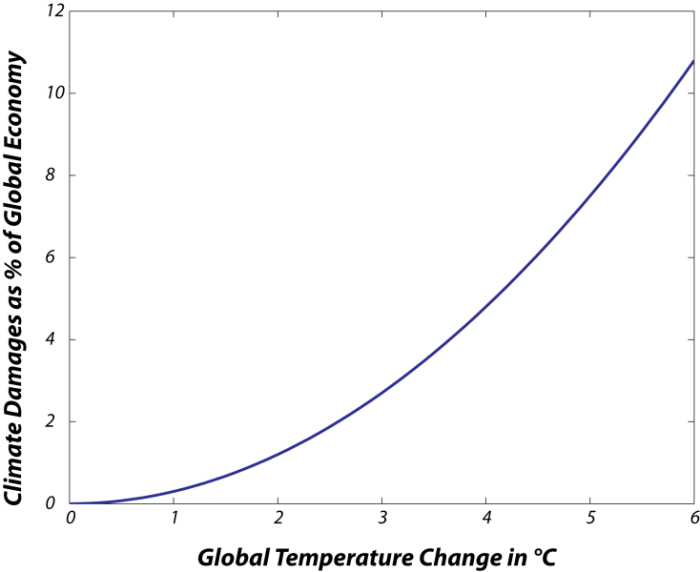
You can see that for a 4°C increase in global temperature, the climate damages amount to about 4% of the global economy, which puts Nordhaus' formulation in line with an estimate by the IPCC of between 2 and 5% for a 4°C rise. This is an exponential function so that the rate of increase in damages increases at increasing magnitudes of warming. Many people have suggested that this curve is probably too conservative at the high-temperature end, and that with such drastic levels of warming, we would experience much greater levels of economic damage.
It might seem like damages totaling 4% are not such a big deal, but consider that the recent devastating earthquake that hit Japan in 2011 caused damages equal to about 3% of Japan's GDP, and the country's economy was severely impacted.
Abatement Costs: The Costs of Reducing Emissions
Abatement Costs: The Costs of Reducing Emissions
Carbon emissions can be reduced (abated) by a variety of means — improved efficiency, burning cleaner fuels (natural gas instead of coal), capturing the carbon dioxide emitted during combustion at power plants and sequestering it, and switching to alternative sources of energy such as wind, solar, or nuclear, all of which result in lower carbon emissions.
Improving efficiency is an obvious choice, and it involves things like improved mileage for vehicles, better insulation and energy management for dwellings, more efficient light bulbs such as LED lights. Efficiency can also be gained by modifying our behavior such that we do the same things in a way that uses up less energy. For instance, we could make fewer trips to do our shopping by planning more carefully, or we could make better use of carpools, or we could make public transportation really work in our cities.
We could also switch to burning cleaner forms of fuels to generate our electricity or power our vehicles. Natural gas (mostly methane) is a cleaner form of fuel than either coal or gasoline, in part because methane is a simpler form of hydrocarbon — CH4 — and its main combustion products are water and CO2, with minor amounts of nitrous and sulfurous gases that contribute to pollution. In contrast, coal burning releases substantial quantities of these gases along with other harmful gases, some of which contain mercury, which causes long-lasting environmental damage. It is estimated that the US has lowered its carbon dioxide emissions by something like 0.5 GT in the last year, thanks to the increase in gas-burning power plants, utilizing gas from the Marcellus Shale and other gas-rich formations.
Carbon capture and sequestration (CCS) is another way to reduce emissions into the atmosphere. In essence, this involves capturing carbon at the point where it is emitted into the atmosphere (like a big power plant), then liquefying it and injecting it into an underground reservoir. This is a fairly new technology, and many experiments are underway throughout the world to figure out how to make this work. One of the first large experiments is taking place beneath the North Sea, where the Norwegians have injected a large quantity of CO2 into a layer of sandstone from which they had previously extracted oil and gas. For this to work, the CO2 has to stay put and not leak back up to the surface; these experiments are being carefully monitored to see how much leakage occurs. CCS can also be achieved by pumping CO2 into large aquifers, where it reacts with minerals.
The other strategies for reducing emissions revolve around technologies that do not involve burning fossil fuels for energy. Wind and solar are certainly expanding, but they are still not as cheap as generating electricity from fossil fuels. The costs of generating electricity by various means have been studied by the US Energy Information Administration, and some of their results are shown in table below, ranking these energy sources in terms of the system levelized costs (in dollars per MWh of electricity) for a new plant that would come online in the year 2017. The system levelized costs here include the money needed to build and safely maintain a power plant, spread out over the lifetime of the plant.
Cost of Energy Sources
| Plant Type | Total System Levelized Cost |
|---|---|
| Natural Gas Advanced | 65.5 |
| Natural Gas Conventional | 68.6 |
| Hydroelectric | 89.9 |
| Wind | 96.8 |
| Geothermal | 99.6 |
| Conventional Coal | 99.6 |
| Advanced Coal | 112.2 |
| Advanced Nuclear | 112.7 |
| Biomass | 120.2 |
| Advanced Coal with CCS | 140.7 |
| Solar Photo-Voltaic | 156.9 |
| Solar Thermal | 251.0 |
| Wind - Offshore | 330.6 |
As you can see, natural gas is currently the cheapest form of electricity generation by a wide margin. But it is surprising to see that hydropower, wind power, and geothermal power are all cheaper than coal. Hydropower in the US is already at about its maximum level of generation, but wind and geothermal are currently underdeveloped. But to scale up these other, cleaner forms of energy to the point where they can generate the total demand of our energy system cannot happen overnight, and it will cost money. Part of the problem here is that it is hard to scale up these other energy forms when the price of natural gas is cheaper.
Reducing carbon emissions will almost certainly cost money in one way or another, and the question now is: How much? The answer is not obvious, and it will become cheaper as new technologies make these alternative cleaner energy forms more affordable, but based on the way things stand now, Nordhaus has tried to figure out an approximate answer. Nordhaus assumes that there are some easy gains that cost almost nothing (like the switch from coal to natural gas that has occurred in the US in the last year), but that if we try to make deeper cuts, we have to shift to non-fossil-fuel forms of energy, and then it starts to get expensive.
Here is what Nordhaus comes up with for abatement costs:
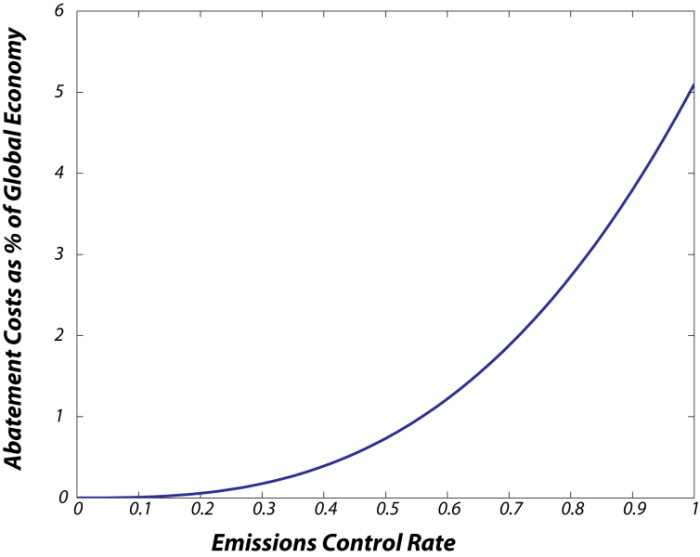
What this shows is how the abatement costs vary with the emissions control rate. The emissions control rate is the fraction by which the carbon emissions will be reduced; a value of 1 means that there is a complete stop to carbon emissions and when it has a value of 0, that means that we do nothing to reduce emissions. The abatement costs here are indicated in terms of a percentage of the global economic output, and it is worth noting that even in the extreme case of an emissions control rate of 1 (completely halting carbon emissions), it only costs 6% of the global economy. But, from an economic standpoint, one would say that those costs have to be compared with the possible benefits to all that might come from using that 6% to improve social well-being. How might we benefit from this kind of expense involved with reducing emissions? This is where we need to go back to the costs related to damages caused by global warming — it is a complicated question, one that can be best understood through the use of a model that will calculate the warming related to carbon emissions and at the same time calculate the costs of damages and abatement.
Strategies for Reducing Carbon Emissions
Strategies for Reducing Carbon Emissions
Most of the world's governments agree by now that global warming poses a serious threat to the future well-being of all people, and they agree that it is desirable to reduce the concentration of CO2 in the atmosphere by lowering our emissions of CO2. This consensus was expressed in part through the Kyoto Protocol (signed in 1997, put into place in 2005), which set targets for emissions reductions by the countries of the world (the US, Canada, Andorra, Afghanistan, and South Sudan are the only holdouts). This protocol calls for reductions in emissions that would effectively produce the SRES A1B scenario that we talked about earlier in the course. The individual countries are then left to figure out how to meet the emissions reduction goals. So, how could countries make this work — that is the question.
There are two strategies that a country might adopt — a carbon tax or a cap-and-trade system. The carbon tax approach would reduce emissions by providing a strong incentive to be more efficient and use cleaner energy sources. The cap-and-trade system instead sets an overall limit or cap on emissions and then allocates or auctions off the right to emit carbon, and then allows these emission rights to be bought and sold in a kind of carbon market.
Carbon Tax
Before we could consider a tax on carbon, we need to know what is the cost of emitting a certain quantity of carbon.
By emitting carbon into the atmosphere, we are effectively imposing an economic burden due to carbon dioxide's contribution to climate change, which will inevitably cost us money. The thing is, we don’t pay these costs as we emit carbon, but they are nevertheless costs that will add up. Economists call these kinds of things “externalities”. They estimate that one ton of carbon emitted to the atmosphere imposes a cost of about $40, and the per capita costs for an American are about $200. As you might expect, this is a very tricky thing to estimate and estimates vary quite a bit.
Let's try to put these numbers into perspective, beginning with the emissions related to a normal American's activities. If you drive 10,000 miles in a year and your car gets 28 miles per gallon of gasoline, you are emitting about one ton of carbon (this is equivalent to 3.67 tons of CO2). A normal household in America might use 10,000 kWh (kiloWatt hours) of electricity, and if this is coming from a coal-burning power plant, the household is emitting about 3 tons per year. If your electricity comes from burning natural gas, the same amount of electrical power use emits just 1.5 tons of carbon.
What if we said that we were going to pay for these externalities related to emitting carbon into the atmosphere via some kind of tax or fee to cover the $40/ton cost? This would mean something like a 10¢ per gallon increase in gasoline and about a 10% increase in the average household electric bill for electricity generated by coal. By doing this, we would be covering the anticipated future costs of our carbon emissions.
But covering the anticipated future costs of carbon emissions is only part of the goal. We also need policies that will help reduce emissions. One might think that the taxes or fees mentioned above could contribute to a reduction in emissions in the sense that by making things more expensive, people will use less, and this is probably true to a certain extent, but we can definitely do more. For instance, imposing a larger tax or fee on gasoline and electricity generated by fossil fuels would provide a stronger incentive to consume less and thus emit less carbon.
Cap-and-Trade
Another approach is one known as “cap-and-trade”. In this policy, a state or country establishes an overall limit or cap on the carbon emissions for each year and then allocates or auctions shares of this total to utilities, companies, etc. These entities receive shares (which are like permits for emitting a certain amount of carbon) and can then sell them to others (thus the “trading” aspect to this policy). The appeal of this kind of approach is that there is a fixed limit to the emissions — it is controllable and predictable, whereas a simple “carbon tax” approach does not guarantee any particular total emissions amount and if a country wanted to use such a tax to meet specific goals, the tax would have to be adjusted frequently, which businesses would have a hard time dealing with (they like predictability in things like taxes).
This is the approach that has already been adopted by the European Union, who, in 2005 launched the European Union Emission Trading Scheme. This is the largest greenhouse gas emissions trading scheme in the world and is one of the EU's central policies for meeting their cap set in the Kyoto Protocol. How is it working? The EU's total emissions have steadily declined over this time period, so it seems to be working.
Modeling the Economics of Climate Change
Modeling the Economics of Climate Change
The global climate system and the global economic system are intertwined — warming will entail costs that will burden the economy, there are costs associated with reducing carbon emissions, and policy decisions about regulating emissions will affect the climate. These interconnections make for a complicated system — one that is difficult to predict and understand — thus the need for a model to help us make sense of how these interconnections might work out.
Stella Model
The economic model we will explore here is based on a model created by William Nordhaus of Yale University, who is considered by many to be the leading authority on the economics of climate change. His model is called DICE, for Dynamic Integrated Climate-Economy model. It consists of many different parts, and to fully understand the model and all of the logic within it is well beyond the scope of this class, but with a bit of background, we can carry out some experiments with this model to explore the consequences of different policy options regarding the reduction of carbon emissions.
The DICE model includes a more primitive version of the global carbon cycle model we used in Module 5, but here we will make some adaptations to our carbon cycle model so that it includes the economic components of DICE.
The economic components are shown in a highly simplified version of a STELLA model below:
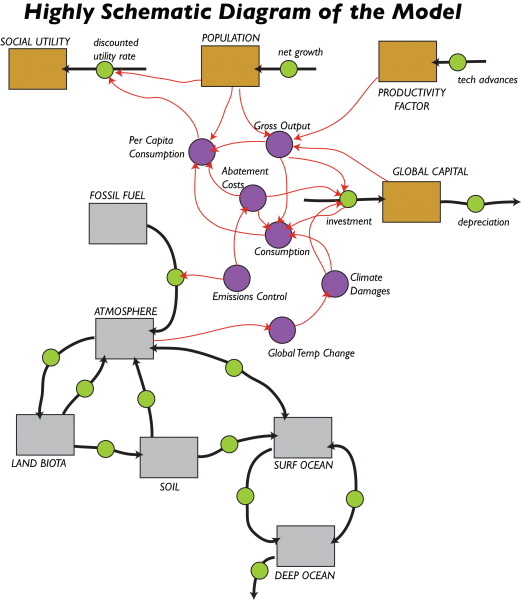
In this diagram, the gray boxes are reservoirs of carbon that represent in a very simple fashion our global carbon cycle model from Module 5; the black arrows with green circles in the middle are the flows between the reservoirs. The brown boxes are the reservoir components of the economic model, which include Global Capital, Productivity, Population, and something called Social Utility. The economic sector and the carbon sector are intertwined — the emission of fossil fuel carbon into the atmosphere is governed by the Emissions Control part of the economic model and the Global Temp. Change part of the carbon cycle model affects the economic sector via the Climate Damage costs.
Economic Portions of the STELLA Model
Let’s now have a look at the economic portions of the model.
The Global Capital Reservoir
In this model, Global Capital is a reservoir that represents all the goods and services of the global economic system; so this is much more than just money in the bank. This reservoir increases as a function of investments and decreases due to depreciation. Depreciation means that value is lost, and the model assumes a 10% depreciation per year; the 10% value comes from observations of rates of depreciation across the global economy in the past. The investment part is calculated as follows:
Investment = Savings Rate x (Gross Output - Abatement Costs – Climate Damages)
The savings rate is 18.5% per year (again based on observations). The Gross Output is the total economic output for each year, which depends on the global population, a productivity factor, and Global Capital.
Abatement Costs
The Abatement Costs are the costs of reducing carbon emissions and are directly related to the amount by which we try to reduce carbon emissions. If we do nothing, the abatement costs are zero, but as we try to do more and more in terms of emissions reductions, the abatement costs go up. If we go all out in this department, the Abatement Costs can rise to be 15% of the Gross Output.
Climate Damages
Climate Damages are the costs associated with rising global temperatures. The way the model is set up, a 2°C increase in Global Temperature results in damages equal to 2.4% of Gross Output, but this rises to 9.6% for a temperature increase of 4°C, and 21.6% of Gross Output for a 6°C increase. This relationship between temperature change and damage involves temperature raised to an exponent that is initially set at 2 but can be adjusted.
Relative Climate Costs
It will be useful to have a way of comparing the climate costs, which is the sum of the Abatement Costs and the Climate Damages in a relative sense so that we see what the percentage of these costs is relative to the Gross Output of the economy. The model includes this relative measure of the climate costs as follows:
Relative Climate Costs = (Abatement Costs + Climate Damages)/Gross Output
Consumption
Also related to the Global Capital reservoir is a converter called Consumption. A central premise of most economic models is that consumption is good and more consumption is great. This sounds shallow, but it makes more sense if you realize that consumption can mean more than just using things it up; in this context, it can mean spending money on goods and services, and since services includes things like education, health care, infrastructure development, and basic research, you can see how more consumption of this kind can be equated with a better quality of life. So, perhaps it helps to think of consumption, or better, consumption per capita, as being one way to measure quality of life in the economic model, which provides a measure for the total value of consumed goods and services, which is defined as follows:
Consumption = (Gross Output – Climate Damages – Abatement Costs) – Investment
This is essentially what remains of the Gross Output after accounting for the damages related to climate change, abatement costs, and investment.
Population
The population in this model is highly constrained — it is not free to vary according to other parameters in the model. Instead, it starts at 6.5 billion people in the year 2000 and grows according to a net growth rate that steadily declines until it reaches 12 billion, at which point the population stabilizes. The declining rate of growth means that as time goes on, the rate of growth decreases, so we approach 12 billion very gradually.
Productivity Factor
The model assumes that our economic productivity will increase due to technological improvements, but the rate of increase will decrease, just like the rate of population growth. So, the productivity keeps increasing, but it does not accelerate, which would lead to exponential growth in productivity. This decline in the rate of technological advances is once again something that is based on observations from the past.
Emissions
The model calculates the carbon emissions as a function of the Gross Output of the global economy and two adjustable parameters, one of which (sigma) sets the emissions per dollar value of the Gross Output (units are in metric tons of carbon per trillion dollars of Gross Output) and something called the Emissions Control Rate (ECR). The equation is simply:
Emissions = sigma*(1 -ECR)*Gross_Output
Currently, sigma has a value of about 0.118, and the model we will use assumes that this will decrease as time goes on due to improvements in efficiency of our economy — we will use less carbon to generate a dollar’s worth of goods and services in the future, reflecting what has happened in the recent past. The ECR can vary from 0 to 1, with 0 reflecting a policy of doing nothing with respect to reducing emissions, and 1 reflecting a policy where we do the maximum possible. Note that when ECR = 1, then the whole Emissions equation above gives a result of 0 — that is, no human emissions of carbon to the atmosphere from the burning of fossil fuels. In our model, the ECR is initially set to 0.005, but it can be altered as a graphical function of time to represent different policy scenarios.
Social Utility
The social utility reservoir is perhaps the hardest part of the model to understand. This reservoir is the accumulated sum of something called the social utility function, which depends on the size of the global population, the per capita (per person) consumption, and something Nordhaus calls the social time preference factor, which includes a discount rate and another parameter (alpha) that expresses society’s aversion to inequality.
Social Utility and The Discount Rate
The Discount Rate
One of the most obvious ways of addressing climate change is to reduce carbon emissions. This can be done by developing alternative energy sources, by capturing and sequestering carbon from power plants, by developing more efficient technologies, etc., but all of these cost money, and they will continue to cost money into the future. How should we value those future costs at the present time?
The concept of a discount rate is an important one for this kind of economic modeling since it provides a way of translating future costs into present value. Here is how an economist might think about it: imagine you have a pig farm with 100 pigs, and the pigs increase at 5% per year by natural means. If you do nothing but sit back and watch the pigs do their thing, you’d have 105 pigs next year. So, 105 pigs next year can be equated to 100 pigs in the present, with a 5% discount rate. Thus, the discount rate is kind of like the return on an investment. Now, think about climate damages. If we assume that there is a 4% discount rate, then $1092 million in damages 100 years from now is $20 million in present-day terms. It may seem odd to treat damages like this — they do not reproduce naturally like pigs — but it does make sense, if you consider that our global economy is likely to grow quite a bit in 100 years so that something worth $20 million today will be worth $1092 million in 100 years. The 4% figure is the estimated long-term market return on capital.
Why is this important? We would like to be able to see whether one policy for reducing emissions of carbon is economically better than another. Different policies will call for different histories of reductions, and to compare them, we need to sum up the expected future damages associated with each policy. The discount rate is the way to do this. It is important to think a bit more about what this means. If the discount rate is higher, then huge damages way off in the future are given little weight in the present day, whereas if the discount rate is zero, then the damages in the future are considered to be huge in the present. So, an economic model with a larger discount rate tends to favor doing little at the present time; a smaller discount rate tends to favor policies that take significant steps in the immediate future, thus avoiding damages and costs further down the line.
Getting back to the social utility function, it may help to think of this as a function of the per capita consumption and the assumptions about discounting future costs and benefits. This part of the model does not feedback on any other part of the model, so it is kind of like a scorecard for the economic parts of the model.
In Nordhaus’s DICE model, the goal is to maximize this Social Utility reservoir — to make it as big as possible through different histories of emissions reductions. The emissions history that yields the largest Social Utility is then deemed to be the best course of action.
The Need for Regulation of Emissions
The Need for Regulation of Emissions
One might wonder if there is a need for any kind of government regulation in order to curb emissions of carbon dioxide. Some people are of the opinion that there is already too much regulation and that these kinds of problems can just take care of themselves. Isn't it enough that we all recognize that to avoid the damages from climate change, we need to reduce our emissions of greenhouse gases?
The Tragedy of the Commons
The problem here is a lack of economic incentive in dealing with an entity like the global atmosphere that is shared by all and owned by none. This problem has been recognized for a long time, but was first made popular by an ecologist, Garrett Hardin, in 1968 and is commonly known as "The Tragedy of The Commons." Below is a video that describes the essence of this idea.
Video: The Tragedy of The Commons: Learn Liberty (3:19)
The tragedy of the Commons is a concern among biologists and social scientists alike. I'd rather refer to this as the problem of open access resources. In short, the tragedy that Commons occurs because each user receives direct benefit of using the resource, but only bears a fraction of the cost of its exploitation. So, examples abound. I mean, it could be African elephants that are near extinction. It could be Amazon rainforest deforestation. It could be overfishing of many of the fisheries worldwide. It could be overfishing in the pond, say right here. The idea behind this has been around for many years. But Garrett Hardin, in his 1968 piece in Science, was the first to bring this to the forefront, about the time that the environmental movement began planning its first Earth Day. In Garrett Hardin’s example, he presents us with an open-access pasture. Anyone who wants to can bring their cattle to graze. Each rancher's goal is to maximize his or her private benefit. Every Rancher has the incentive to bring more and more cattle to the pasture because they receive the direct benefit of grazing their cattle there. Unfortunately, they only bear a fraction of the cost of the over-exploited pasture, so they're going to continue to add cow after cow until the pasture is over-grazed and destroyed and no longer usable as pasture land. In other words, their individual incentive invites overall ruin. For even if they recognize that the pasture is being exploited, somebody else will bring a cow if they don't, and so, they will continue to do so. It's not that they don't know the asset is being exploited, it's that if they wait and try to delay, it'll just be exploited by somebody else. The large issue here is there's a lack of excludability. The ranchers have no way of stopping others from adding cattle to the pasture. In his piece, Garrett Hardin suggested two main ways to go about solving the tragedy of the Commons. The first is through privatization or private ownership. The second is through public ownership or government ownership. So, whenever we have public ownership, I mean, one of the benefits is that we still all share the collective rights of this asset. This is one of the reasons why we have the National Park System, to protect natural open space at Yosemite and the beauty of Yellowstone and things of that nature. But one of the problems with public ownership is that the decision makers don't bear the cost of their actions, nor do they receive additional value from any good decisions they make. For instance, imagine if you're a park ranger, and you find some innovative way to reduce large forest fires, that adds value to the park itself. You don't receive the direct benefit of your decisions. You and your staff are not going to receive large pay raises, are not going to receive the large stream of value that comes from that decision. However, private ownership does solve this problem. With private ownership, the decision-maker bears the direct cost of their actions, and so from any poor decision they're going to bear the costs. But any positive, innovative decision, they'll receive the benefits. So, if you are a ranger or a park owner who found this innovative way to solve the problem with forest fires, then you would receive the stream of value from that good decision. There's not a silver bullet to the problem of open access Resources. There's not a one-size-fits-all strategy. But we do know that limiting access and ensuring that decision-makers bear the costs of their actions, allows us to address key concerns with open access resource problems.
Hardin's concept is fairly simple, and he illustrated it with a kind of parable, as described in the video. Suppose there is a common piece of grassland in a village — the commons — and it is owned by no one but is available for all to use. These commons still exist in many areas, such as the village of Comberton in England.
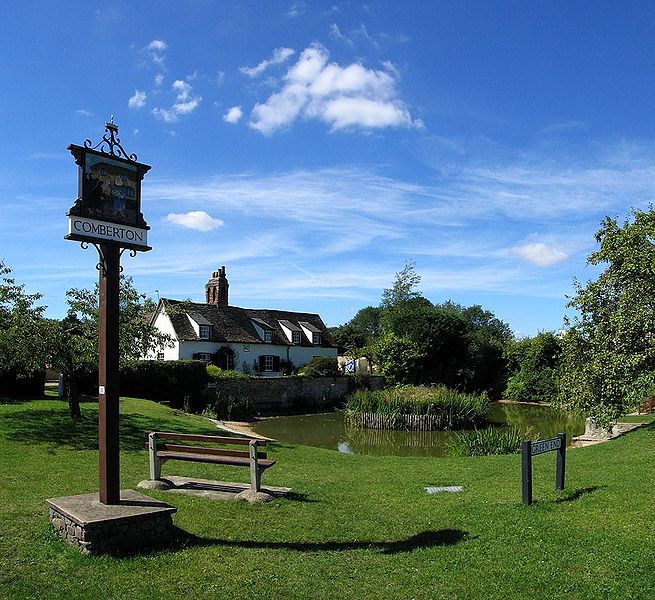
In most cases, the use of the commons is regulated by the community, but in this case, we'll pretend there are no regulations. People start to graze their sheep on this nice grass and they benefit from that. Based on the size of the field and the rate of grass growth, there is a carrying capacity for the field — the maximum number of sheep the field can support in a sustainable manner. If you put more sheep on the land than the carrying capacity, the resource will dwindle and eventually disappear altogether and, at that point, it will be of no use to anyone. But as long as there is any grass at all, it is to each individual's benefit to continue to place new sheep in the field. So, overgrazing is inevitable in this case, and the common resource is depleted. There are many documented examples of this kind of occurrence, and they all are related to cases where there is an open-access resource available to everyone.
How can this tragedy of the commons be avoided? One way would be for the community to impose a cap-and-trade system on grazing. Here is how it could work. The community studies the problem and figures out what the carrying capacity of the field is in terms of the number of sheep. Then they allocate grazing share equally to everyone in the community. Community members can buy and sell these shares so that if someone does not want to deal with sheep, they can still benefit from the common resource by selling their shares to someone who is willing to graze more sheep. The shares would be re-allocated each year in case the carrying capacity changed. Another approach might be for the community to sell the land to individuals and then let each individual farmer manage their own plot of land, in which case they would have an economic incentive to manage their land in the best way possible, avoiding the overgrazing problem. The community might place some restrictions on what the owners could do with the land, like preventing them from putting up apartment buildings or a feedlot; this would effectively be like the zoning regulations that most communities have.
The point to take away from this is that when you have a commonly held resource with open access, everyone has to act together in a coordinated, regulated way in order to avoid depleting or damaging the resource and ensuring that the resource serves the best interests of everyone affected by the resource. In the case of carbon dioxide emissions into the atmosphere, the best interests of everyone can only be served if there is some form of a regulatory plan; otherwise, we will succumb to the tragedy of the commons. Furthermore, the reduction of carbon dioxide emissions has to be coordinated so that each country has confidence that if they do their part, the other countries will do their parts and the global concentration of CO2 will stabilize or even become lower. This has, in principle, already been done and agreed upon by most of the countries of the world through the Paris Climate Accord.
Inflation Reduction Act
Inflation Reduction Act
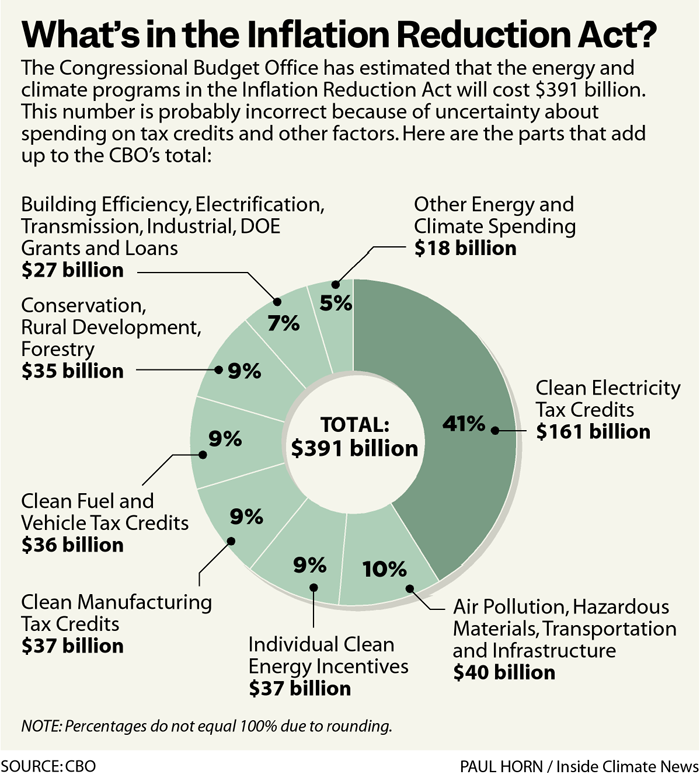
The Inflation Reduction Act of 2022 is likely the most aggressive step taken in the US policy realm towards emissions reduction. The Act includes numerous components including lowering the price of prescription drugs, increasing tax rates for large corporations, funding for IRS tax enforcement, and lowering the budget deficit. But the key part from a climate point of view is to promote the use of clean energy, thus reduce emissions and set the US on a path towards meeting its Paris climate goals. The Act includes significant funding for installation of solar panel by households using tax incentives and increased tax rebates for purchases of electric vehicles. More broadly, the Act includes funding for states and local municipalities to install charging stations for electric vehicles and to convert to renewable energy production. The Act also includes tax incentives for corporations to produce renewable energy. Finally, there is funding for cutting-edge technologies such as carbon capture and storage and clean hydrogen. The EPA has estimated that the Inflation Reduction Act will reduce US CO2 production from 2005 levels by 35 to 43 percent by 2030. This is a start, but more policies will be required in the near future if we are to limit warming to 1.5 oC.
Agriculture
Agriculture
As we have seen in Module 9, climate change and population growth will present some major challenges for our agricultural system, and these challenges vary around the globe, and they also vary according to the kind of agricultural activity — raising livestock, growing grains, growing fruits, etc.
In the future, more carbon dioxide in the atmosphere will help some crops to grow faster — this is the CO2-fertilization effect we discussed in Modules 5 and 9. In many regions, a small bit of warming will also enhance plant growth. These two effects, combined, mean that under a moderate warming scenario such as that associated with the SRES A1B scenario (the optimistic one), the global agricultural output is expected to grow slightly.
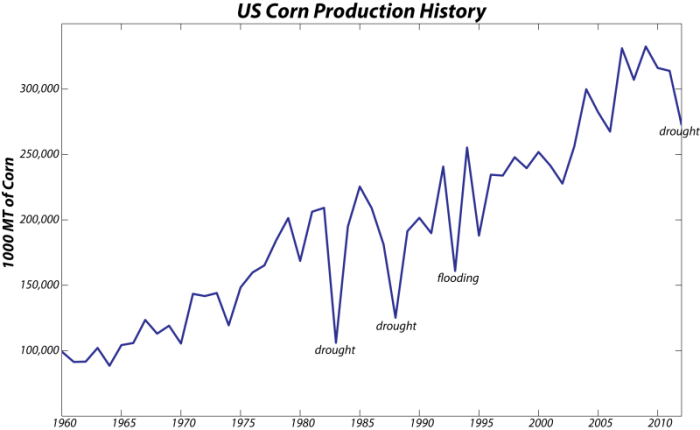
However, most plants have an optimum growth temperature, and if the temperature rises too high, the growth of these plants declines rapidly. For instance, corn productivity declines rapidly above 95°F and soybeans decline rapidly above 102°F. In many areas, the warming will not exceed this optimum temperature range, so yields will probably increase slightly due to the combination of higher CO2 and warmer temperatures. However, more frequent floods and droughts may reduce yields, as can be seen in the recent history of corn production in the US:
Furthermore, it appears that many weeds will also grow much better in a warmer climate, increasing the need for the use of herbicides in order to keep yields high.
Other types of crops will have different challenges in a warmer climate. For instance, some fruit crops do not necessarily benefit from any heating at all, and many fruit crops may be damaged by the earlier arrival of spring — they are encouraged by the early spring warmth to flower earlier, but this then leaves that year's crop vulnerable to a subsequent frost damage, which can severely limit the fruit production. These frosts following a premature warming are likely to increase in the future.
Livestock may be at risk, both directly from heat stress and indirectly from reduced quality of their food supply. The grasses in pastures do not respond much to increased CO2, but they do decline with higher temperatures and less water. A good portion of the rangeland in the US is in areas that can expect less precipitation and less surface water in the future, so livestock yields may suffer.
Fisheries will be affected by changes in water temperature that shift species ranges, make waters more hospitable to invasive species, and change lifecycle timing.
So, how can we adapt to these changes? One way is by being more careful about water management, focusing on water efficiency to deal with times of drought. Another measure is to plant a more diverse mix of crops in more regions of the country so that if a flood, drought, heat wave, or late frost occurs, not all of the agricultural production will be reduced. Yet another measure is to develop new strains of crops and grasses that are better suited to the new climate conditions. Developing new strains is expensive, but is made a bit easier by the fact that there is already a vast, diverse agriculture in the more tropical regions, and we can effectively adapt methods and crop varieties that are already utilized in these warmer areas. A final adaptation strategy involves changing the places where we grow certain crops, shifting the location to find the optimum set of growing conditions. This last option would be expensive if we attempted it over a short time span, but there is a gradual shift; the economic impacts are likely to be limited.
Water Resources
Water Resources
The issues with water supply are largely related to changing precipitation patterns that will leave many areas drier and with more frequent droughts, while other areas will have to cope with greater precipitation and more frequent severe floods. For the US and Central America, the prospects for changes in surface water are quite clear, as shown in the model prediction for the year 2080 under the optimistic A1B scenario:
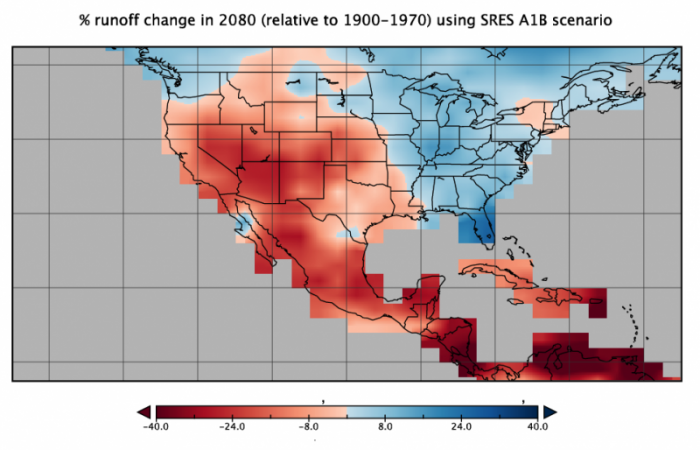
If there is a silver lining to the red regions of the above map, it is that the water reductions will occur in a part of the country that has already had to confront water shortages — people in the west and southwest already know the importance of water conservation, and they are already taking measures to make sure that their water supply will be adequate. A big part of this is attitude adjustment — getting used to using less water. Another part of the adaptation strategy is to greatly increase water efficiency — doing the same basic things with less water. Another part is water storage in dams and aquifers to take advantage of the rainfall during wet years, making it available for drier years. Yet another part involves developing technologies for recycling water.
Many areas of the country will instead have to deal with more water, and the consequences include a greater strain on storm sewer systems and related flood-control systems. In the low-lying coastal parts of the country, sea level rise will lead to salt-water intrusion into shallow aquifers, rendering those aquifers unsuitable.
For the US, the EPA has already developed a long-term strategy for dealing with these water-related aspects of climate change, including programs to assist local and state governments and utilities to plan for the future challenges.
Energy Resources
Energy Resources
Energy production and use are the most important means by which we are altering the global climate and, in turn, the changing climate will impact our energy production and consumption in a variety of ways.
Warming will be accompanied by decreases in demand for heating energy and increases in demand for cooling energy. The latter will result in significant increases in electricity use (most cooling uses electricity; heating uses a wider array of energy sources) and higher peak demand in most regions. This picture obviously changes around the country and the globe, but there has been more growth in the US in regions that are mainly cooling regions, thus exacerbating this effect. The general picture is illustrated by looking at 4 major cities in this graph that shows the degree days for heating and cooling at the present and as expected in the future under different emissions scenarios.
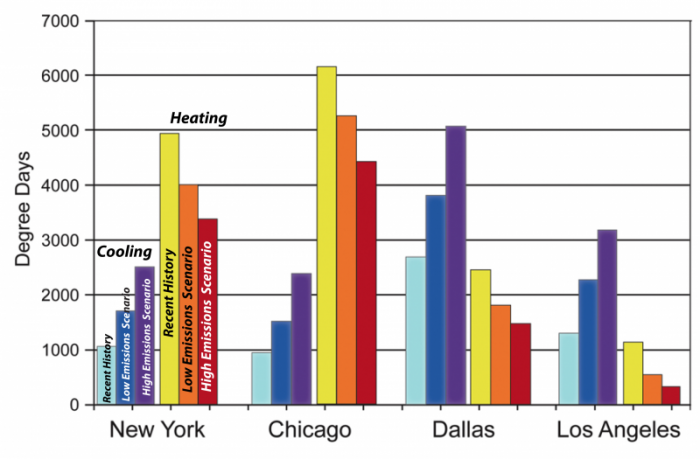
One heating degree day is one day where the outside temperature is 1°F below 65°F; two cooling degree days is either one day at a temperature of 67°F or two days at 66°F. If you then sum these up for a whole year, you have the data shown in this figure (Recent History bars). The colder cities like Chicago and New York have larger heating degree day sums than cooling degree day sums.
Energy production is likely to be constrained by rising temperatures and limited water supplies in many regions. Power plants are the second biggest user of surface water (after irrigation) and the hotter it is, the more water is needed to cool the plants. At the same time, as the water warms, you need more of it to accomplish the same cooling job. A powerful example of this effect comes from the French heat wave of 2003, during which a number of nuclear power plants had to halt production because the cooling water was not cool enough to safely continue generating electricity.
Energy production and delivery systems are exposed to sea-level rise and extreme weather events in vulnerable regions. A good example of this comes from Port Fourchon, Louisiana, which supports 75% of deepwater oil and gas production in the Gulf of Mexico, and its role in supporting oil production in the region is increasing. The Louisiana Offshore Oil Port, located about 20 miles offshore, receives 1.3 million barrels of oil per day and transfers it to refineries, accounting for 50% of our nation's refining capacity, making this one of the most important components of our energy production system. One road, Louisiana Highway 1, connects Port Fourchon with the nation, and it is increasingly vulnerable to flooding during storms due to the combined effects of sea level rise and ground subsidence. Louisiana is currently upgrading Highway 1, elevating it above the 500-year flood level in order to prolong its viability.
Climate change is also likely to affect some hydropower production in regions subject to changing patterns of precipitation or snowmelt.
How can we adapt to these coming changes? Part of the solution is to identify vulnerable features of our energy production system (such as Port Fourchon) and then safeguard them from the expected consequences of continued warming. Another big part of the adaptive strategy is to reduce our consumption of energy by increasing efficiencies in transportation (which we are already doing), home appliances, and buildings. New York City and Chicago have both undertaken massive programs to minimize the heat absorbed by their cities by planting trees and installing reflective or green roofs on buildings. Trees and green roofs cool by evapotranspiration, and the effect can be significant. These steps will reduce the cooling demands in these cities. We can also reduce the demand on power plants by more distributed, small-scale energy production that is carbon neutral. This is happening in a big way in many parts of Europe, where fields of solar panels have been springing up in farmers' fields — they are growing energy, attracted by strong support from the state-run utilities responsible for electricity.
Human Health
Human Health
There are a variety of human health concerns associated with warming in the future. The most serious concern is related to deaths caused by heat waves.
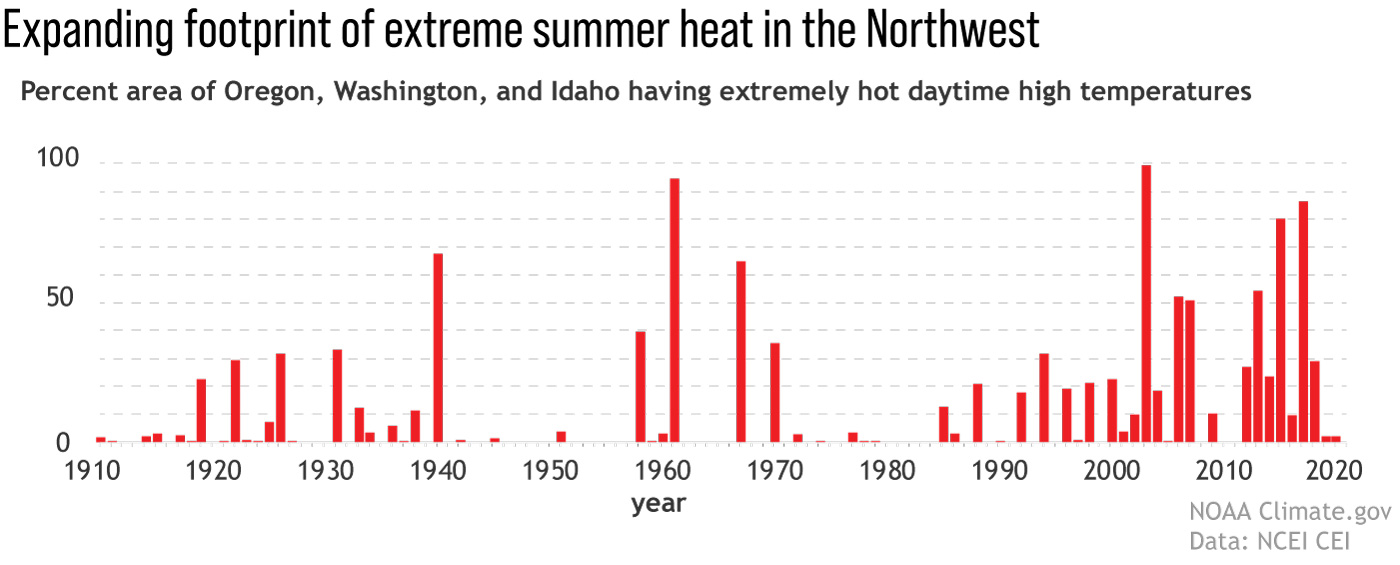
As discussed in Module 2, late June 2021 saw record-breaking heat in the Pacific Northwest of the US and Canada, with Portland, Seattle, and Vancouver shattering previous temperature records. Temperatures reached 116 degrees C in Portland, 108 degrees C in Seattle, and 121 degrees C in Lytton in British Columbia. The heatwave resulted from a massive heat dome that developed and sat over the area. This dome of hot air was very dry and led to wildfires.
This area was truly vulnerable to heat as only about 40% of homes have air conditioning and residents are not used to extreme heat. Thus, estimates are that over 500 people died as a result of the heat, many of whom in vulnerable populations, older and poorer people.
Climate models show that this region will need to become accustomed to the heat, and these severe temperatures will occur regularly as the 21st century progresses. In fact, temperature data clearly show warming in this region over the last century.
In the US as a whole, the future almost certainly will have more frequent hot days and nights. This can be seen in the following set of maps, which show the number of days over 100°F for the recent past and the end of this century under two different emissions scenarios:
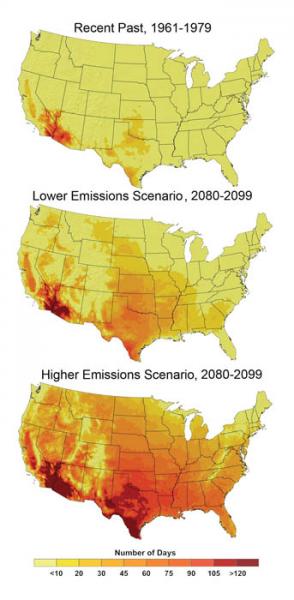
The message here is that throughout most of the country, we will be challenged with many more hot summer days. By the end of the century, a cool, northern state like Minnesota will have more +100°F days than the southern tip of Texas. What can be done about this? How can we adapt? Can we mitigate the impacts of these extreme heat events?
Some excellent examples of how to adapt to and mitigate the consequences of these extreme heat events come from several US cities. Philadelphia, in 1995, launched a Hot Weather Health Watch and Warning System to respond to health threats from more frequent heat waves. The system includes education, media alerts, information hotlines (no pun intended), and cooling shelters. They estimate that this system has already averted more than 100 heat-related deaths. Both New York City and Chicago have taken steps to cool their downtown areas by covering roofs with reflective materials and plants; these steps will mitigate the overheating in the city centers, where temperatures can be as much as 4°C warmer than the surroundings. In addition to minimizing heat-related deaths, these measures will also reduce the amount of electricity needed for cooling, thus providing an extra benefit. Many regions are modifying building codes to promote new buildings that are easier to keep cool (and easier to keep warm).
So, there are some relatively easy measures that can be taken to adapt to more frequent heat waves.
As the climate warms, many areas are already finding that new infectious diseases are becoming a problem. One familiar example of this is West Nile Disease, a disease spread by a species of mosquito that is normally found in warm regions of the world. This disease, once introduced to the US, has spread rapidly, aided by generally warmer temperatures. There have been more than 30,000 cases of West Nile Disease in the US and over 1,000 deaths. In the US, we are already adapting to this new disease through education and the use of pesticides to limit the spread of the mosquitoes. Similar new diseases can also be adapted to, but public health officials will have to be diligent in looking out for the arrival of the new diseases — which is something they already do.
In summary, although warming will bring new challenges to human health, the adaptations are relatively straightforward, and in many places, they are already beginning.
Transportation
Transportation
As the climate warms, there will be a variety of impacts on our transportation system, which is a critical element of our entire economic system.
Sea-level rise and storm surge will increase the risk of major coastal impacts, including both temporary and permanent flooding of airports, roads, rail lines, and tunnels. Flooding from increasingly intense downpours will increase the risk of disruptions and delays in air, rail, and road transportation, and damage from mudslides in some areas. The increase in extreme heat will limit some transportation operations and cause pavement and track damage. In Alaska, the melting of permafrost has already begun to compromise roads, railways, and pipelines. On the plus side, decreased extreme cold will provide some benefits such as reduced snow and ice removal costs.
Federal, state, and local agencies are already taking steps to protect transportation systems from climate change impacts. Adaptation measures across the country are shaped by local impacts. Specific adaptation approaches include:
- raising the elevation of critical infrastructure,
- changing construction and design standards of transportation infrastructure, such as bridges, levees, roads, railways, and airports,
- abandoning or rebuilding important infrastructure in less vulnerable areas.
These adaptations are relatively easy to implement since the transportation infrastructure is in nearly constant need of upkeep — it simply will cost a bit more and will require some foresight in how upgrades are made.
At the same time, changes in transportation are a large part of the solution to the climate problem. In the US, cars and trucks are the largest producer of CO2, producing 28 percent of emissions annually. To adhere to the Paris Agreement emissions goals the US is going to have to control this output. The Obama administration established mandatory fuel standards for cars and trucks, specifically that automakers were to produce cars with an average of 51 miles per gallon by 2025. These standards were loosened by the Trump administration. However, recently the Biden administration strengthened the Obama fuel standards with stringent rules for cars and trucks produced after 2023, but also is requiring US automakers to produce 50% electric vehicles by 2030. This goal is now clearly feasible as battery technology has advanced so significantly recently. These strategies are a central part of the US pledge to cut emissions by 50% from their 2005 levels by 2030.
On a per passenger basis, planes emit a lot more CO2 than cars. Short flights are especially polluting so alternative forms of transportation such as trains are environmentally beneficial. Planes inject CO2 into the upper atmosphere where it has a longer residence time. There are many more cars than planes obviously so the total pollution is higher but cutting back on plane transportation is key to emissions reduction.
Migration/Relocation
Migration/Relocation
Some aspects of climate change in the future are so challenging that the only real option is for people to migrate or relocate. One recent study concluded that there will be as many as 200 million climate-related migrants on the move in search of livable conditions by 2050. There are several different climate-related changes that may trigger migrations and relocations, but the main reasons have to do with rising sea level and reduction in surface water availability for agriculture and basic living.
Sea Level Related Migration/Relocation
Inhabitants of low-lying islands such as the Maldives (whose highest point is just 2.3 m above sea level), or low-lying coastal areas such as Bangladesh, are very clearly in for trouble as the sea rises. These areas are part of what has been called the Low Elevation Coastal Zone (LECZ) that lies within 10 meters of present sea level. Overall, this zone covers 2% of the world’s land area but contains 10% of the world’s population and 13% of the world’s urban population. Many of the countries with a large share of their population in this zone are small island countries, but most of the countries with large populations in the zone are large countries with heavily populated delta regions. Almost 65% of cities with populations greater than 5 million fall, at least partly, in the LECZ. In some countries (most notably China), urbanization is driving a movement in population towards the coast. Many of these places do not have the resources to keep building higher and higher sea walls to keep the water out, and even if they did, it might still be a losing battle. So, they will have to move to somewhere else.
Alaskan coastal and river communities are experiencing greater erosion and flooding because of increased storm activity and windiness; reduced sea-ice extent, which increases the intensity of storm surges; and thawing of permafrost, which increases susceptibility to erosion. Traditionally, many of these communities were semi-nomadic, moving inland during periods of severe storms, and had little permanent infrastructure. During the past 100 years, however, their mobility has been reduced by the building of houses, schools, airports, and other permanent facilities—changes that have increased their vulnerability to climate change. Six Alaskan communities are now planning some type of relocation. However, no funds have been appropriated to begin the relocation process. The U.S. Army Corps of Engineers has identified 160 additional villages in rural Alaska that are threatened by climate-related erosion, with relocation costs estimated at $30-50 million per village.
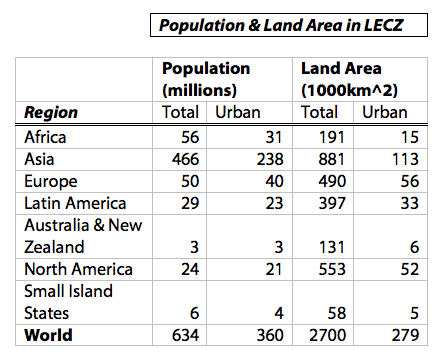
If we take a global inventory of the areas within the LECZ, we see a number of important features:
Click here to see a text description.
| - | Population (millions) | Population (millions) | Land Area (1000km^2) | Land Area (1000 km^2) |
|---|---|---|---|---|
| Region | Total | Urban | Total | Urban |
| Africa | 56 | 31 | 191 | 15 |
| Asia | 466 | 238 | 881 | 113 |
| Europe | 50 | 40 | 490 | 56 |
| Latin America | 29 | 23 | 397 | 33 |
| Australia and New Zealand | 3 | 3 | 131 | 6 |
| North America | 24 | 21 | 553 | 52 |
| Small Island States | 6 | 4 | 58 | 5 |
| Wordl | 634 | 360 | 2700 | 279 |
In most of the regions of the world, the majority of the population in the LECZ reside in cities; Asia is the big exception to this. The fact that most of these at-risk people live in cities raises problems for relocation since cities are based on an extensive infrastructure that is not easy to recreate in another place, while more rural populations are probably easier to relocate. Asia, in addition to having the greatest overall population, also has by far the greatest number of people who will have to deal with moving to higher elevations as the sea level rises.
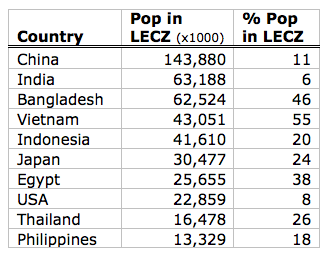
On an individual basis, some countries are much worse off than others, as can be seen in this ranking of countries based on the total population that lives in the LECZ:
Click here to see a text description.
| Country | Pop in LECZ (x1000) | % Pop in LECZ |
|---|---|---|
| China | 143,880 | 11 |
| India | 63,188 | 6 |
| Bangladesh | 62,524 | 46 |
| Vietnam | 43,051 | 55 |
| Indonesia | 41,610 | 20 |
| Japan | 30,477 | 24 |
| Egypt | 25,655 | 38 |
| USA | 22,859 | 8 |
| Thailand | 16,478 | 26 |
| Philippines | 13,329 | 18 |
Asian countries occupy 8 of the top 10 here, so this will be the region of greatest concern when it comes to relocation problems related to sea-level rise.
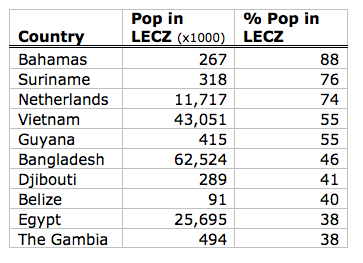
If you look at the ranking in terms of the percentage of the population at risk from sea-level rise, you see the following:
Click here to see a text description.
| Country | Pop in LECZ (x1000) | % Pop in LECZ |
|---|---|---|
| Bahamas | 267 | 88 |
| Suriname | 318 | 76 |
| Netherlands | 11,717 | 74 |
| Vietnam | 43,051 | 55 |
| Guyana | 415 | 55 |
| Bangladesh | 62,524 | 46 |
| Djibouti | 289 | 41 |
| Belize | 91 | 40 |
| Egypt | 25,695 | 38 |
| The Gambia | 494 | 38 |
This list excludes countries with a total population less than 100,000, or smaller than 1,000 km2. If all countries were included, 7 of the top 10 would be places with populations of less than 100,000, the top 5 having more than 90% of their country in the LECZ (Maldives, Marshall Islands, Tuvalu, Cayman Islands, Turk and Caicos Island).
Surface Water Related Migration/Relocation
In many parts of the world, especially rural areas, the local economy is based on agriculture that is made possible through irrigation, and most of that irrigation water comes from the diversion of rivers. As the climate changes, many areas will see a decline in the surface water needed for agriculture, and so these local economies will struggle. The global pattern of change can be seen in this figure, which is an average from many different climate models for the 20 year period centered on 2080:
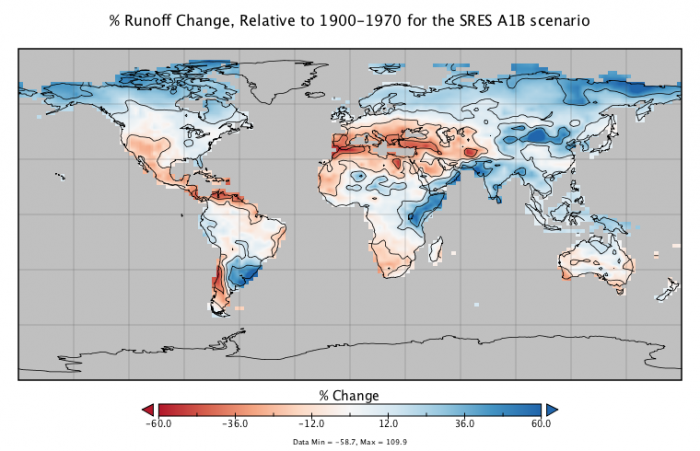
People will lose jobs — not just farmers, but also the many people whose work is somehow connected to agriculture — and these people will have to seek work elsewhere. Most of these people will move to cities, accelerating a general trend over the past few decades. Many of these migrations or relocations may not be dramatic or traumatic, but in some cases, they will cause real hardship. The vast majority of the people who will be required to move are lower-income people who do not have the means nor the political capital to make these transitions easily.
The above global map does not tell the whole story though, since the timing of water availability is important. In the whole region of Asia surrounding the Himalayan mountains, the rivers that drain from mountain glaciers are an essential part of agricultural economies. The glaciers melt back in the summer and provide important streamflow during a period of the growing season when rainfall is low. These glaciers are melting rapidly, and once they disappear, the dry-season glacial meltwater will not be there to supply the irrigation water. As a result, agricultural production and the work related to it will also dry up. In Pakistan, for example, 90% of the agriculture is based on irrigated water diverted from the Indus River, which is fed by Himalayan glaciers.
The global map above highlights an important reduction in surface water in the region of Central America. This is likely to increase the existing pressure for migration to the US.
Geoengineering
Geoengineering
Geoengineering is the intentional global-scale modification of Earth’s climate system, in order to reduce global warming. There are two general categories of geoengineering schemes — CO2 removal and insolation reduction.
Insolation Reduction
These projects seek to reduce the insolation (incoming solar radiation) by deflecting sunlight, or by increasing the albedo (reflectivity) of the atmosphere. They do not reduce greenhouse gas concentrations in the atmosphere, and thus do not seek to address problems such as ocean acidification caused by these gases. Solar radiation management projects appear to have the advantage of speed and, in some cases, costs. There are a variety of ways that we might achieve a reduction in insolation and thus cool the planet:
- Directly changing the albedo of the surface through the use of light-colored or reflective materials on buildings, glaciers, etc. For buildings, this has the added benefit of reducing the cooling costs, but it is not likely to be as effective on a global scale as some of the other schemes. However, it does hold promise for small-scale projects such as cities.
- Making the atmosphere more reflective through the injection of sulfur aerosols (this mimics what volcanoes do) or other particles such as aluminum oxide dust into the stratosphere, which will make the Earth more reflective. We know that this works because of the cooling that follows large, explosive volcanic eruptions that inject tiny aerosols (particles) of sulfate into the stratosphere. Based on the volcanic eruptions, we can estimate how much sulfur is needed to counteract a doubling of CO2 — about 5 Tg of S per year (one Tg or teragram is 10^12 g), which is about half the amount that injected into the atmosphere by the eruption of Mt. Pinatubo. The estimated cost of this would be on the order of $50 billion per year (consider that the US military expenditures are about $700 billion). These particles have a limited residence time (1-2 years) in the stratosphere, so this would require continual injection via airplanes, large naval guns, or balloons. The costs of doing this are surprisingly small, but it would have to be maintained.
- Reducing insolation with space-based mirrors or other structures. The most promising proposal here involves the placement of roughly 16 trillion small disks at a more or less stable position 1.5 million km above the Earth. Each disk would have a diameter of 60 cm and would weigh just one gram. They would not be true mirrors but would scatter enough sunlight to reduce the insolation by 2%, which might be sufficient. Getting these disks into place and then keeping them there would be a challenge, and it is estimated that it would take 10 years to put them into place using a special type of gun that could transport up to 10 million of them at a time. The total cost could be 5 trillion dollars every 50 years (the lifetime of the disks). This sounds a bit like science fiction, but it has been developed by a group of prominent astronomers and physicists.
Carbon Dioxide Removal
Carbon dioxide removal projects address the root cause of warming by removing greenhouse gases from the atmosphere. These projects are generally slower and more expensive than some of the insolation reduction schemes. There are a variety of ways that this could be done, including:
- Carbon capture and sequestration, which typically involve the removal of CO2 from power plants or other big sources, and then the injection of the liquefied CO2 into deep aquifers; a number of pilot projects of this type have already begun. This could double the cost of coal-generated electricity, making this an expensive proposition, but that in itself would encourage developing cleaner energy sources. Other means of carbon capture have been proposed, including the promotion of natural chemical weathering reactions of some rocks like basalts in places such as Iceland, in which atmospheric CO2 is consumed. There is a wide range of proposals to enhance the biological fixation and long-term storage of carbon. CO2 has been injected into oil reservoirs to force out more oil in a process called enhanced oil recovery.
- Iron fertilization of the surface waters in the southern oceans to promote plankton blooms, which use CO2 from the surface oceans, thus enabling them to absorb more from the atmosphere. It turns out that in many parts of the oceans, iron is a limiting nutrient for photosynthesizing plankton, so adding iron can help the plankton achieve their full potential in terms of CO2 consumption. A few small-scale experiments have been conducted, and they appear to work in the short-term, but scaling this up would be challenging, and the iron would have to be continuously applied, just as fertilizer is continuously applied to crops.
Problems and Concerns
Although these geoengineering schemes may be attractive in the sense of providing a solution to the problem without having to get all the countries of the world to make a dramatic reduction in CO2 emissions, some of them clearly have potentially harmful consequences.
As a general rule, when people try to control natural systems, they find that the natural systems are more complex than they realized, with many unintended consequences. This is likely to be the case with geoengineering as well. With many of these schemes, there may be winners and losers — cooling the climate in one region (or the globe as a whole) may lead to devastating droughts, floods, or damaging cold in other regions. Adding sulfur to the atmosphere will lead to acid rain, and it may also deplete the ozone layer, exposing us to more harmful ultraviolet radiation from the sun.
The aerosol injection schemes are so inexpensive that one country could decide to take action unilaterally, and this would likely lead to serious problems in international relations. All of the insolation management schemes have the problem of not addressing the CO2 emissions, which would allow the CO2 concentration in the atmosphere to rise to very high levels; then if the geoengineering scheme failed for some reason, the climate would warm much faster than anything we have experienced so far.
Summary
Most scientists agree that geoengineering schemes should not be seen as the silver bullet that will solve our global warming problems quickly and painlessly. These schemes are like treating the symptoms of a disease rather than the root cause, a course of action that is never a real solution. But until we find a way to treat the root cause (reduce emissions of CO2), some of these schemes may buy us more time while helping us avoid serious climate damages. While many climate scientists believe that there may be an important role for these schemes in our future, we do not yet fully understand the potentially harmful side effects of these projects, so continued research is very important.
Global Equity and Climate Adaptation
Global Equity and Climate Adaptation
If you live in a wealthy, highly-developed, technologically sophisticated country like the US, it is fairly easy to see how we will be able to adapt to climate change without undue suffering. Of course, we will suffer the consequences of severe storms and droughts, and we will eventually have to move a lot of people and activities from places like the Mississippi Delta region. But these are not existential threats of the type faced by the millions of people living on less wealthy low-lying islands, who will eventually see their island homes submerged. And many other nations do not have the technological abilities, wealth, and global influence to make the necessary adaptations.
This is very much a problem related to the tragedy of the commons mentioned in Module 11. The commons, in this case, is the global atmosphere, which is shared by all, and everyone has the freedom to put as much CO2 into the atmosphere as they want (unless they were to be truly restricted by something like the Paris Agreement. Everyone feels the effects of the total concentration of CO2, but not everyone contributes equally to this effect. But individual actors (countries) have little motivation to halt their CO2 emissions (which costs money) for the benefit of others. The only way to solve these kinds of problems is through regulation. But regulation does not help us with the question of how to deal with the problems associated with the climate change that will occur in the future. The map below shows that countries most impacted by climate change are not those emitting the majority of the CO2.
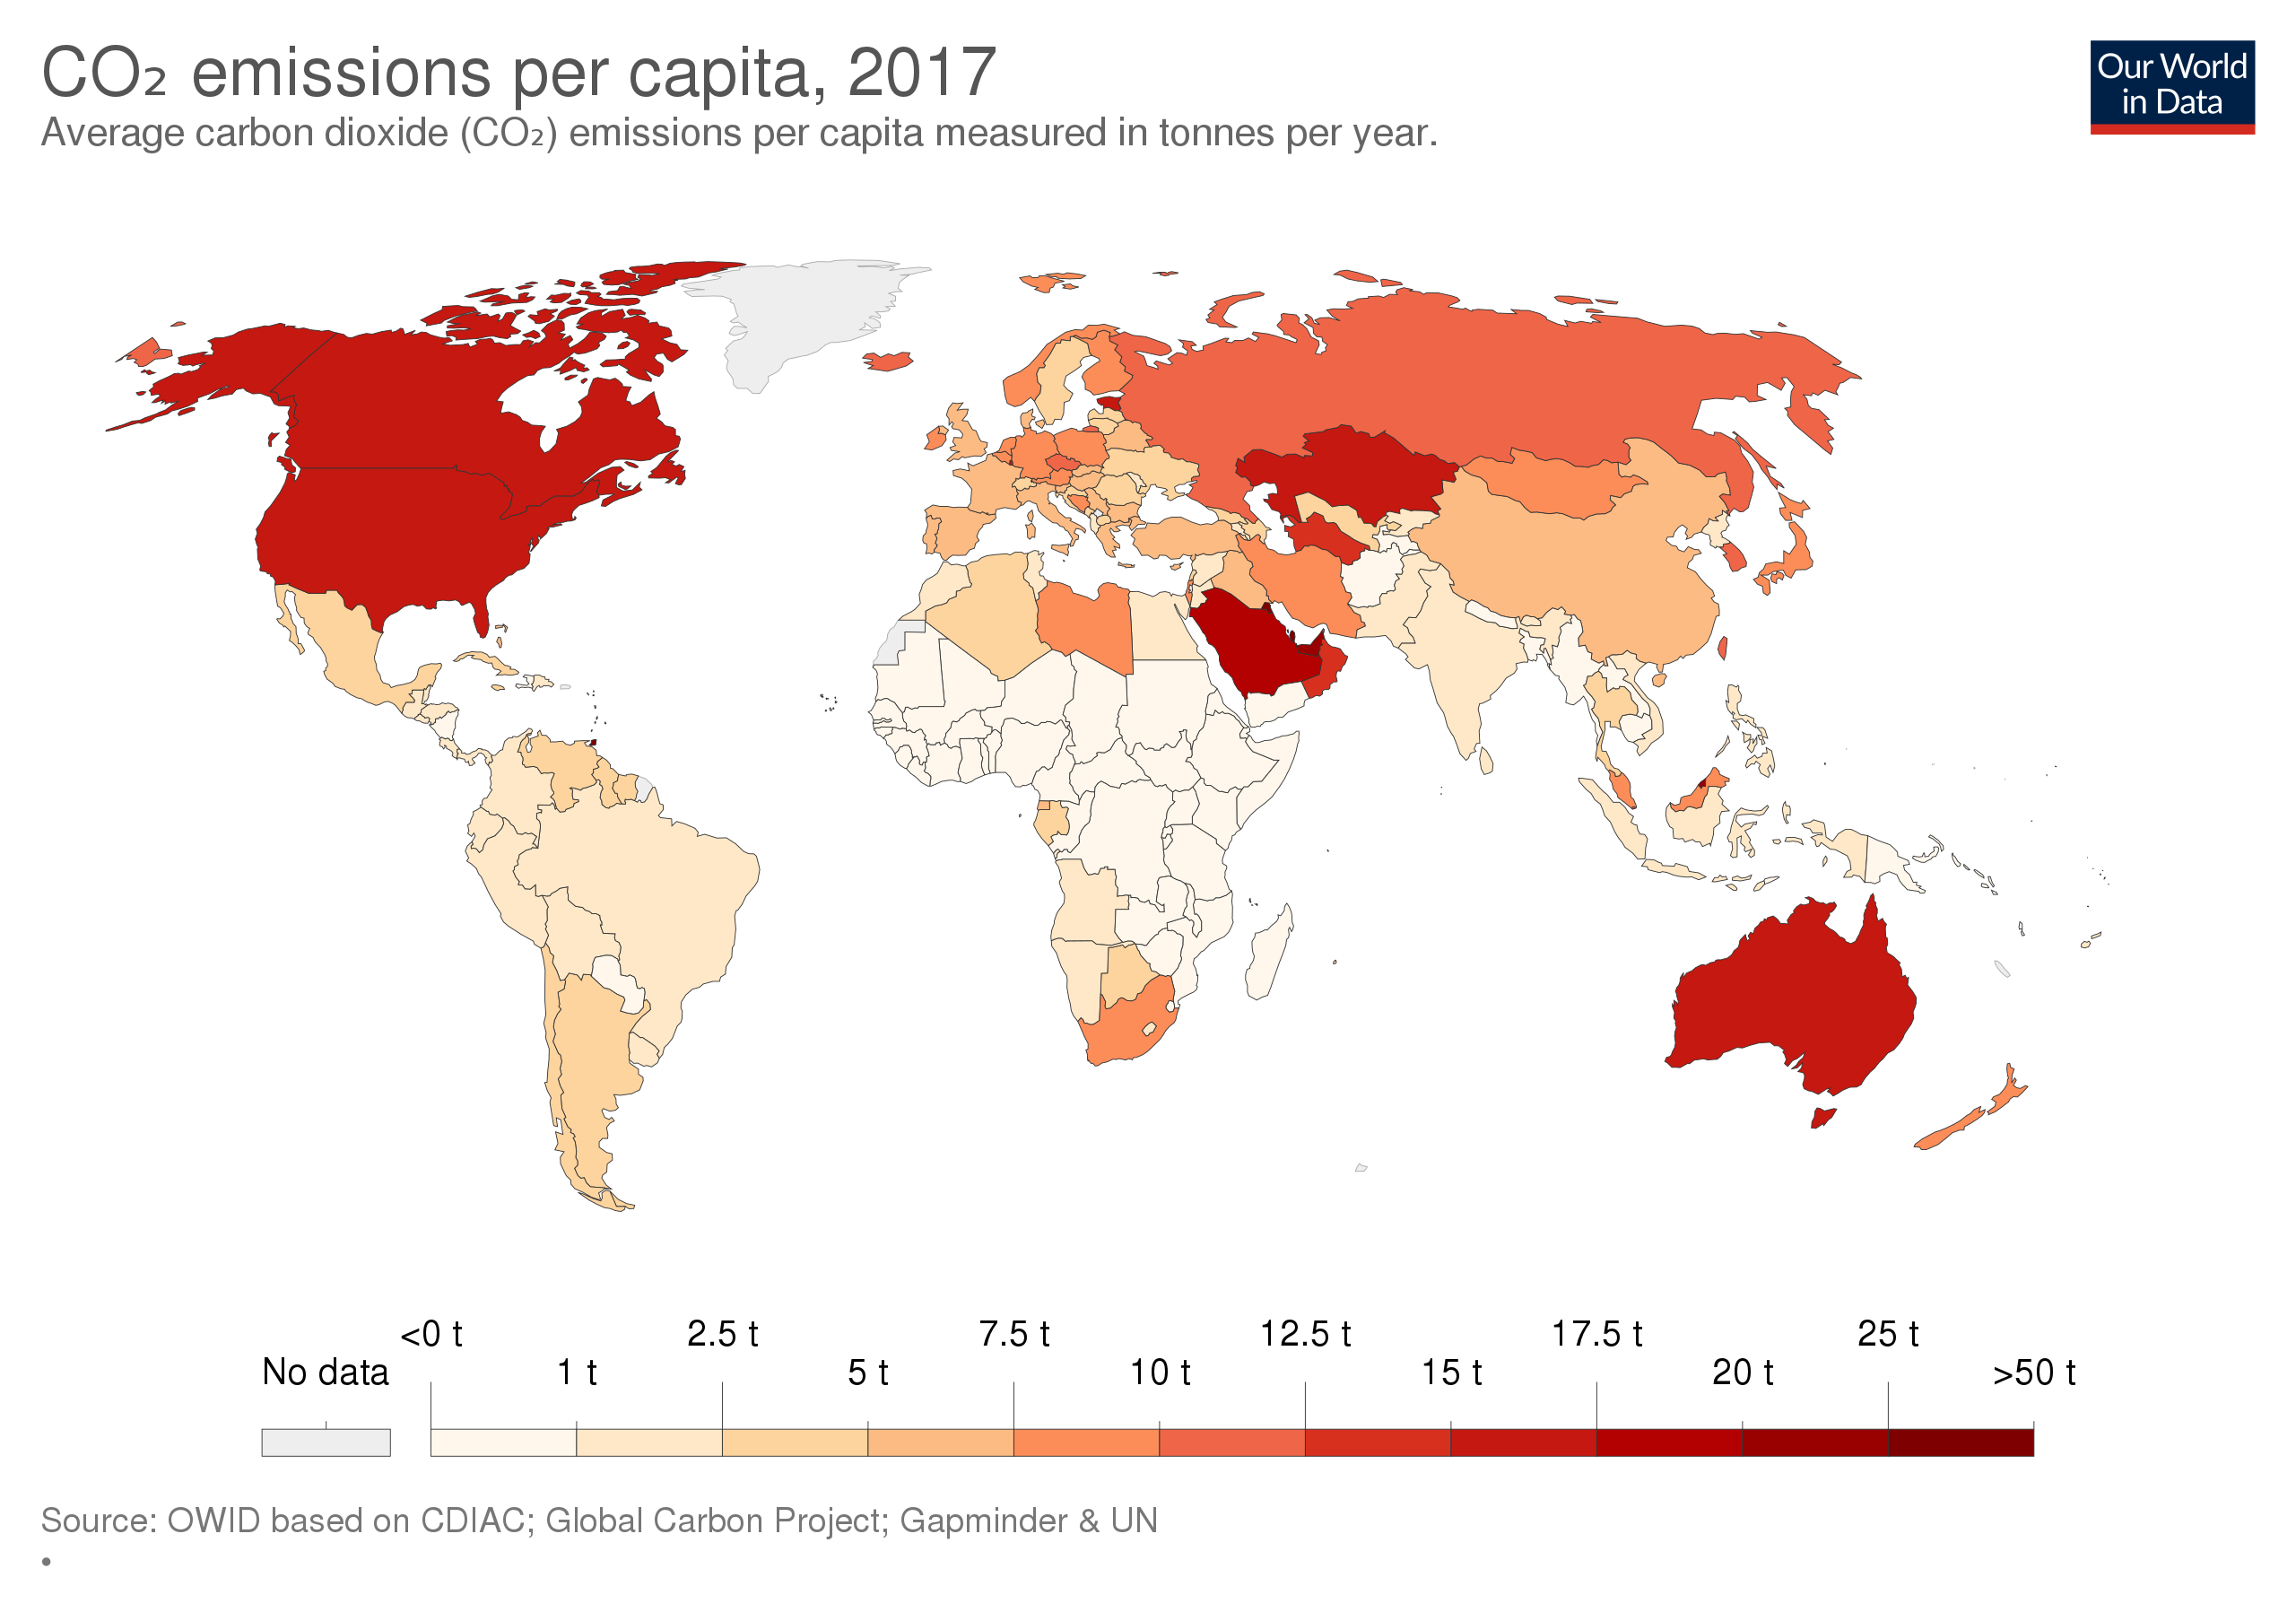
Try to place yourself for a moment in the shoes of a Maldive Islands citizen or someone in Fiji or the Solomon Islands. The sea level is rising and will continue to rise in the future due to global warming, and your country will no longer be viable for living — you will have to migrate and relocate somewhere else. But where? And how will you find the resources to make this move — acquiring a new house, a new job? (If you own a home or property, it will obviously be worthless.) You might very well ask yourself — whose fault is this? And you might feel that the blame lies primarily with the big emitters of CO2 — the big, wealthy nations of the world. But how can you get them to help you with your problem? What power do you have?
You can see that this is a tricky problem. There is a big question/problem of equity when it comes to climate change — the biggest emitters of CO2 bear the most responsibility for climate change, and these are also among the wealthiest nations. These big emitters are the ones best positioned to successfully adapt to climate change; they are also the ones with the resources to help some of the poorer victims of climate change. Should these big emitters help to bear the costs of climate adaption for the less wealthy nations that have emitted much smaller shares of CO2 into the atmosphere? If so, how could they be induced to do so? These are important questions, and they do not have good answers or widely-accepted answers at this point. Some people are advocating a globally assessed carbon tax, in which different countries would be taxed at different rates based on their historical emissions histories; the money would then be used to help with adaptation and relocation where necessary. But this is just a proposal. And to implement it would require the kind of international agreement that has proven elusive so far with respect to climate change.
This is very clearly an important aspect of climate change and our future that is in need of a solution.
Module 12 Lab: Options for the Future of Climate, Energy, and Economics, Including Geoengineering
Module 12 Lab: Options for the Future of Climate, Energy, and Economics, Including Geoengineering
The goal of this exercise is to explore a range of scenarios for our future in such a way that our energy needs are met, our economy is strong, and our climate is controlled to some extent. The underlying premise is that if do nothing and continue down our current path, the climate will warm to truly dangerous levels, which will have serious consequences for our economy and thus our quality of life. The options we will explore include shifting to renewable energy sources, conserving energy (being more efficient so that we do the same things with less energy consumption) — both of these limit the carbon we emit to the atmosphere. We will also explore two other options that sometimes are called “geoengineering” — one involves injecting sulfate aerosols into the stratosphere to block a little of the sunlight and another involves the direct removal of carbon from the atmosphere, sometimes called negative carbon emissions.
All of these choices involve costs, and the model calculates these costs. Another kind of cost comes in the form of climate damages, and the model calculates these too. From an economic standpoint, the best scenario is one that minimizes the costs because these costs represent a drain on the global economy; the global economy will be better able to meet all of the needs of humanity if we can keep the costs down. The figure below, modified from the one you’ve seen before in Module 5 on the carbon cycle, shows the general scheme the model uses to calculate all of the costs.
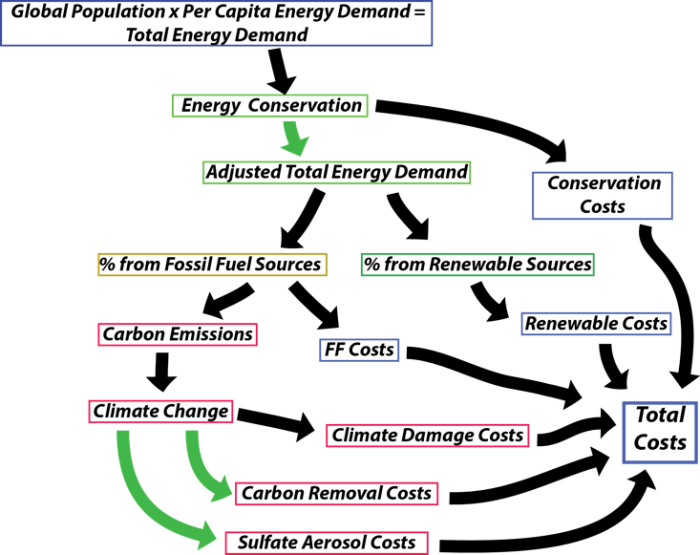
It might help to look at this backward from the total costs, which sums the climate damage costs, the costs of fossil fuel energy, the costs of renewable energy, the costs related to energy conservation, and the costs related to geoengineering. The climate damage costs are related to the temperature change, and these costs go up as the square of the temperature increases, so that the costs related from going from 5°C to 6°C are considerably more than going from 1°C to 2°C. The fossil fuel costs, renewable costs, and conservation costs are related to how much energy is provided by those sources. The ideal thing from an economic standpoint is to have the smallest Total Costs because that means there is more money to pour back into the economy and to provide a higher quality of life.
At the core of this model is the global carbon cycle model coupled with the simple climate model — you’ve seen these before. The model also calculates the energy demands and carbon emissions that reflect the population size and choices we make about how much to pursue conservation and renewable energy sources. The model you will work with here has some additions that represent two geoengineering solutions — the addition of sulfate aerosols into the stratosphere to block some of the sunlight (SAG for sulfate aerosol geoengineering) and the direct removal of carbon dioxide from the atmosphere (DRC).
Sulfate Aerosol Geoengineering
The idea behind sulfate aerosol geoengineering has its origins in the studies of how volcanic eruptions affect the climate. When volcanoes erupt, they a combination of ash (tiny fragments of volcanic rock and glass) and gases, including water vapor, carbon dioxide, sulfur dioxide, and others. The sulfuric gases condense into little droplets called sulfate aerosols that can reflect sunlight, cutting down on the solar energy that drives our climate system — this causes a cooling effect that can last for a couple of years, ending when the aerosols finally fall back to the surface. The key to this is that if the force of the eruption is great enough, the sulfate aerosols end up in the stratosphere (higher than 15 km in altitude); gravity is weak there and there is essentially no water to wash the aerosols out, so they can stick around for a few years. The idea that we humans could add sulfate aerosols into the stratosphere to cool the climate (or prevent further warming) was first suggested by the Nobel Prize-winning atmospheric chemist Paul Crutzen in 2006. Crutzen admitted that a much smarter way of dealing with the problem of global warming was to drastically reduce our carbon emissions, but he pointed out that humanity has not yet shown the resolve needed to tackle this problem; so he proposed this as a potentially easier way to avoid the dangerous consequences of further warming.
This is kind of a thorny issue for a number of reasons. Some people worry that pursuing this kind of solution is dangerous because it just treats the symptoms of the problem without tackling the underlying cause, which is the excess CO2 we keep adding to the atmosphere. Many people see this as dangerous in the sense that tampering with natural systems almost always has hidden unintended consequences. In fact, sophisticated 3D climate model simulations with the addition of sulfate aerosols suggest that the cooling effects would not be uniform and it would change patterns of precipitation as well, which means that some areas of the globe might suffer, while others would see benefits. But, if you are in a car going down a hill and your brakes are not working, you may need to consider doing something other than stepping on the brake pedal — and time is of the essence!
How would this work? Crutzen and others since him have worked out a variety of scenarios for getting the sulfate into the stratosphere, including sending loads of it up in balloons and dumping it out of huge military airplanes that can fly high enough. The general idea is illustrated in the figure below, where the red plus and minus signs indicate changes to the solar energy caused by the sulfate aerosols.
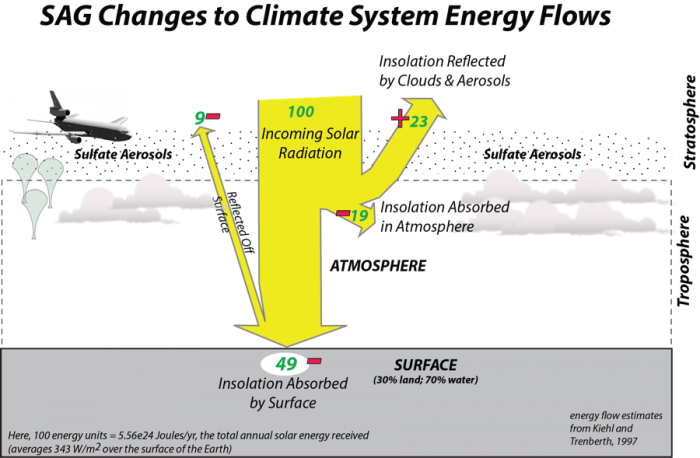
Although this is difficult to price out, some of the estimates (Robock et al., 2009) are that it would cost between 1 and 30 billion dollars per year to add one teragram of (1 Tg = 1012 g) of sulfate into the stratosphere per year. 1 Tg of sulfate, evenly distributed in the stratosphere is estimated to block about 1.3 W/m2 of solar energy, which is about 0.4% of the total. In our simple climate model, changing the solar input by 1 W/m2 changes the temperature by about 0.35°C. One of the challenges is that the sulfate aerosols fall out of the atmosphere, so we would have to constantly add it to maintain the desired level of solar reduction to combat the warming. In the model, if you activate this geoengineering scheme, you set a desired limit to the global temperature change and sulfate is added in the necessary amount to keep the temperature change close to this limit. This then generates a cost that affects the global economy.
Direct Carbon Removal
The idea of carbon sequestration has been around for a relatively long time — emissions from a fossil fuel-burning power plant can be captured at the source and processed to remove the CO2. The extracted CO2 is then pumped deep underground where it can reside in the pore spaces of sedimentary rocks. In some cases, it is pumped back into the rocks from which oil or gas have previously been removed. Carbon sequestration is expensive, but it can virtually eliminate the carbon emissions from some power plants. However, carbon sequestration does not actually remove CO2 from the atmosphere, and if we were to continue to burn fossil fuels in cars and in homes, then the concentration of CO2 in the atmosphere would continue to rise. Carbon sequestration has not really taken off because the extra expense means that it is far cheaper for a power company to produce new electricity using solar or wind systems.
The direct removal of CO2 from the atmosphere sometimes called negative emissions is a relatively new idea — the first facility was put into action in the fall of 2017 in Iceland. A Swiss company called ClimeWorks developed a partnership with a geothermal power plant to essentially test the technology. There are several other companies in Canada and the US at earlier stages in development. The general idea is to pump huge volumes of air through a chamber in which there are numerous small beads coated with a substance that effectively grabs onto CO2 molecules. When the beads have absorbed as much as possible, the chamber is sealed off and the CO2 is released by changing the humidity in the chamber. The resulting air in the chamber has a very high concentration of CO2; it is mixed with water and then pumped deep underground. The CO2-rich solution reacts with the basaltic bedrock and new minerals are formed, locking up the CO2. This process essentially takes the CO2 out of the air and turns it into rock — pretty clever! The general scheme is shown in the diagram below.
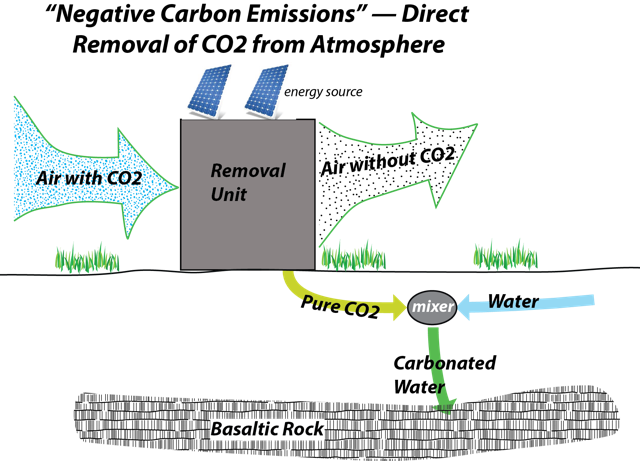
This process is in the early stages of development, so it is difficult to know how much it will cost. The companies doing this believe that they can probably get the cost down to $366 billion per Gt C removed. There would have to be thousands of these units set up around the world in order to scale this up. In our model, we are going to assume that if we were to begin this process, we would initially be limited to 5 Gt C removed from the atmosphere per year, but that as time goes on, our capabilities would increase and we could draw more and more out of the atmosphere.
This process of direct removal of carbon from the atmosphere has some consequences for other parts of the carbon cycle. As we remove CO2 from the atmosphere, the concentration decreases, which means that CO2 stored in the oceans will begin to flow into the atmosphere. This means that we will need to remove much more carbon from the atmosphere than you might think if we are aiming for a given concentration of CO2.
Experiments
Experiments
Click here to go to the model [10]. Please Note: The model in the videos below may look slightly different than the model linked here. Both models, however, function the same.
When you open the model, you will see that there are a lot of controls, reflecting the full range of choices we can make about our future energy consumption and geoengineering. There are also 15 pages of graphs that show the results of the model. Be sure to watch the video below that introduces you to the model before proceeding.
Video: Module 12 Intro to Model (7:09) (note the Model we use looks different from that in the videos but it works exactly the same and the results should be identical)
This is the model that we're going to be working with in this lab, and it's similar to one you've seen before, that combines a global carbon cycle with a global climate model. And it includes components that calculate our energy needs and our sources of energy, which then relate to the carbon emissions that affect the climate. It also monitors the economics of all these changes to our climate and energy. This one also includes some geoengineering options that I'll explain in a little bit.
So, over here there are a lot of controls. They're kind of color-coded according to the different things that they represent. So, green here represents conservation of energy. The purple or blue represents renewable energy. The red down here relates to one of the geoengineering schemes, which is the direct carbon removal from the atmosphere. And the orange down here deals with the other geoengineering scheme, which is the injection of sulfate aerosols into the stratosphere to block sunlight.
So, let me just show you a couple things about this. So, you open the model and you run it and it calculates this all out over a couple of hundred years. And this shows the global temperature change that results, and here we haven't really done anything to increase conservation or renewables, and the geoengineering switches are off, so this is kind of a do-nothing scenario. We have a very high temperature rise by the end of this time here, six and a half degrees warmer. So now, we could say, of course, well what if we conserve energy? So, this number here is the percent of our energy that we reduce by conservation methods. And this is the growth rate of that. So, this is five percent increase per year, which is pretty good. So, if we run this and see what happens and compare it with the do nothing scenario, you see it lowers the temperature, but it's still unacceptably high. And so, you could say, well what if we increase our reliance on renewable energy? Let's bring this up to say seventy-five percent and we run that, and we see that this does a little bit better. But still, by the end of this, look, we're up at three point six degrees of global temperature rise, which is really quite alarming and by the year 2000 we're, 2100 rather, we’re above that 2 degree limit that we sort of agreed upon as the upper limit in the Paris Climate Accords.
So now, we've added here some geoengineering options and these are kind of like, if we just can't manage our carbon emissions for conservation and switch to renewables, we might want to investigate some of these to help us prevent this climate disaster. And so, I'm gonna restore the renewables to where it was before. I'll just turn this on, so now, this is going to activate the direct removal of carbon from the atmosphere and then the burial and sequestration of that carbon underground. So, here's the time at which it starts, 2030, and in here you pick a target atmospheric CO2 concentration. So, here, I've got 400. Let’s raise that to 450 here. And this is the rate of cost decline of that process, which is initially fairly expensive. And this represents how quickly our capability to do this grows. And this gives us the initial amount of carbon that we can withdraw from the atmosphere in one year, at the very start. So, this is pretty generous because it can't really come close to doing one gigaton at the present time, but things are changing rapidly in this field. So, let's see what happens here. And we run this, and we see here's our result. Look, this brings us down, keeps us below two degrees for a fairly long time. So that is a fairly effective means of keeping our climate under control. If I switch on some of these other pages, you'll see that this, the blue is the CO2 concentration in the atmosphere, rises and then we start to get it in control and then we've brought it under control here, it's close to 450, it’s a little bit above. Until this point in time, in which it drops down dramatically there just because we've run out of fossil fuels, and so we're no longer able to emit any to the atmosphere at this point in time. So 2197 or 98, something like that. So, that's the direct removal of carbon.
Another option is sulfate aerosol geoengineering, and we turn that on. This is where we inject sulfate aerosols, these little tiny particles into the stratosphere. They block some sunlight and so here's the starting time for this process, and here's the targeted temperature change that we're going to try to control to. So, this will try to keep the temperature change to two degrees or less and this is the cost decline rate. I've got this at zero right now, kind of assuming that this is not such a technologically tricky process and probably we're not going to see huge advances in the sort of ability to do this per dollar. So, I've got that at zero initially. Well, let's just run this and see what happens. You run the model, and there you see, this does a very good job of keeping it right at two degrees through this whole time. While all of these changes have economic consequences, and some of those you can see, on some of the other graphs here, let's see this one. Here's the total cost per person, per capita, that is in terms of thousands of dollars per year. And those last two that we ran, they both end up costing something like about $9,000 per person per year by the end of it. And that's to pay for all of our energy supply and all the climate damages that are associated with the temperature change.
So, this is just a brief introduction to the model. You can restore everything to this sort of an initial by clicking those two buttons. And so, we're going to do a series of experiments with this model to make some sort of assessments about what is the best thing, from the standpoint of the climate and also the economy, in terms of getting us to a future that includes a tolerable level of global warming.
Practice Questions
Part A. Climate Control by Conservation and Renewable Energy
Be sure to watch the video below that shows how to do problems 1-3.
Video: Module 12 Questions 1 - 3 (2:01) (note the Model we use looks different from that in the videos but it works exactly the same and the results should be identical)
In this video, I'm going to show you how to manipulate the model to get the answers to the first three questions of the practice assessment. So, I'm going to follow the instructions and change the green colored sliders so that this is 30, and this is zero point one. Renewable upper limit, I'm going to change to 85, and the renewable growth rate to zero point one. I've done that. Now, I'm going to run the model. And I'll look at the ending temperature change. So, let's see, it's about two point one three, two point one four at the very end. And so, looking at the choices, the correct answer is two point one degrees C. So, that's answer C on the on the test.
Well, number two is, what is the lowest pH of the oceans in this case? I'm going to have to go to graph page number two. So, here in pink is the pH and it's dropping all the way down to eight point zero six, or eight point zero eight, somewhere in there. So, the closest value and the possible answers is eight point zero eight. So, we'll select that one. So, A is the correct one.
Then, what is the total cost per person? I'm here and it says to click through to page fourteen, so we're gonna skip through all these other plots that show all sorts of other parameters to page 14. This is the total cost per capita in thousands of dollars. And you can see that it rises to two point four thousand per person at the end of the time here. So, that's D. So 3D is answer for that one.
In this first experiment, we will use a combination of conservation of energy and greater reliance on renewable energy sources to limit climate change. Open the model and run it without making any changes — we’ll call this the “do nothing” scenario. You will see that we end up with 6.55°C of warming by the end of the model run in 2210, and if you look through the other graphs, you will see that the ocean pH drops to 7.68 (graph page 2). Looking at some of the other graphs, we see that this scenario results in a bit over 19 thousand dollars per person (graph page 14) in terms of the total costs (energy, conservation, climate damages, geoengineering), and an ending net economic output of about $460 trillion.
Now, change the model as described below:
Green colored sliders
Conserve upper limit: 30
Conserve growth rate: 0.1
Blue colored sliders
Renew upper limit: 85
Renew growth rate: 0.1
Then, run the model and answer the following questions by finding the values from the resulting graphs.
- What is the ending global temperature change that results from these changes (page 1)?
A) 4.2 °C
B) 3.6 °C
C) 2.1°C
D) 1.6°C
- What is the lowest pH of the oceans in this case (page 2)?
A) 8.06
B) 7.6
C) 8.20
D) 7.85
- What is the Total Cost Per Person (page 14)
A) 12.4
B) 8.2
C) 7.7
D) 2.4
Part B. Climate Control by Geoengineering
Now, we will try geoengineering alternatives, beginning with the direct removal of carbon — DCR. Be sure to watch the video below that shows how to get the answers to problems 4-7.
Video: Module 12 Questions 4-7 (3:08) (note the Model we use looks different from that in the videos but it works exactly the same and the results should be identical)
Now we're going to move on and look at how to get the answers to problems 4 through 7, the next section of this assessment. So here I've got to make some new changes. I'm going to cut down the conservation of energy, turn that to 1, and the growth rate stays at .1. The blue sliders are going to change so that the renewable upper limit is 20, all the way down here, and the growth rate is .1. I’m going to turn the DCR, direct carbon removal, switch on. Set the start time to 2030. The target atmospheric concentration, I'm going to set this to 470. The cost decline rate I'm going to make .02, so 2 percent per year decline in the cost of this process. The growth rate in terms of capacity is going to be 2% per year and the initial amount that we can withdraw from the atmosphere is 5 gigatons of carbon. So that's all set according to the instructions. Now I'm going to run it and see what the ending temperature is in this case. And here by the end we see we're down to just below 2, 1.97. So that's answer C.
Then 5 is what is the lowest pH In this case? I’m going to flip to page number 2. Looks like the lowest pH is back in here, that's about 8.06, so that's answer, A.
Then the next one is, what is the total cost per person? So that's page 14 of the graph pad. I'm going to get there this way, there's 14. We see that's up considerably higher now it's 9.2 thousand dollars or 9.2 thousand dollars per person at the at the end of time. So that's answer B.
Now the last question, seven, is why do the human fossil fuel emissions drop to zero around the Year 2095? So if we went back to let's say graph pad number two, you can see the the human fossil fuel burning emissions. This is gigatons of carbons rising, flattening off and then it just crashes, boom, to zero here. And so why is that? Well it turns out that if we cycle through here to page eleven on the graph pad, we see the fossil fuels, so this is in gigatons of carbon. And by the time we get to about 2095 or so we've essentially gone to zero. So we've run out of fossil fuels and so that that's why the emissions dropped is because we've got nothing left to burn. So that's answer C on the assessment.
Make the following changes to the model:
Green colored sliders
Conserve upper limit: 1
Conserve growth rate: 0.1
Blue colored sliders
Renew upper limit: 20
Renew growth rate: 0.1
Red colored sliders
DCR switch: On
DCR start time: 2030
Target atm pCO2: 470
DCR cost decline rate: 0.02
DCR growth rate: 0.02
DCR init: 5
Once you’ve made these changes, run the model, and answer the following.
- What is the ending global temperature change that results from these changes (page 1)?
A) 4.2 °C
B) 2.6 °C
C) 1.97°C
D) 3.3°C
- What is the lowest pH of the oceans in this case (page 2)?
A) 8.06
B) 7.6
C) 8.20
D) 7.85
- What is the Total Cost Per Person (page 14)?
A) 11.2
B) 9.2
C) 6.7
D) 2.4
- Why do the human FFB emissions drop to 0 around the year 2195 (page 2)?
A) Our energy needs drop to 0 at this time
B) The economy has collapsed at this time
C) We run out of fossil fuels at this time
D) Must be a glitch in the model
Now we will try sulfate aerosol geoengineering — as before, the following video shows how to do this section.
Video: Module 12 Questions 8 - 9 (1:49) (note the Model we use looks different from that in the videos but it works exactly the same and the results should be identical)
In this video, I'm going to show you how to get the answers to Questions 8 & 9 on the assessment. And so, we look at the instructions, and we see that we set the conserve upper limit at 1, its growth rate at 0.1, the renew upper limit at 20, and its growth rate at .1. Make sure the DCR switch is off, and we turn the sulphate switch on, and start time 2030. The target key range is 2, and the sulfate cost decline rate is zero. So, you do those things, and we run it, and you'll see the temperature will flatten off at about two degrees. Once it gets done running here, there we see it, so it stays at just a hair above two degrees throughout the time.
Now Question 8 is, what is the lowest pH of the oceans in this case? So, we go to graph number two, look at the pH curve in pink here, and it drops down to 7.58 here at the low point. So, that's answer D. So, that's correct answer for 8.
Nine is, what is the total cost per person? That's page fourteen, that's the graph page. Go back to page 14 and see the total costs per capita at the end is about 9.3 thousand dollars per person at the very end. So, that's answer B on the assessment and that's the answer.
Make the following changes to the model:
Green colored sliders
Conserve upper limit: 1
Conserve growth rate: 0.1
Blue colored sliders
Renew upper limit: 20
Renew growth rate: 0.1
Red colored sliders
DCR switch: Off
Orange colored sliders
Sulfate switch: On
Sulfate start time: 2030
Target T change: 2.0
Sulfate cost decline rate: 0.0
Once you’ve made these changes, run the model and answer the following.
- What is the lowest pH of the oceans in this case (page 2)?
A) 8.06
B) 7.6
C) 8.20
D) 7.58
- What is the Total Cost Per Person (page 14)?
A) 11.2
B) 9.3
C) 6.7
D) 2.4
Part C. Comparison
Now, let’s step back and consider what we have found here. Clearly, the “do-nothing” scenario is the worst in terms of temperature change and costs. But how about the other scenarios, each of which gets us to a temperature change of close to 2°C by the end of the model run — which is the best? The following video shows how to answer questions 10-12.
Video: Module 12 Questions 10 - 12 (3:46) (note the Model we use looks different from that in the videos but it works exactly the same and the results should be identical)
Today, I'm going to show you how to get the answers to Questions 10 through 12 on the assessment. And this is where we kind of step back and consider all these different options, these three basic options together and compare them. And in the first one, we kept the temperature close to about a two degree warming by the end of the model run, by energy conservation and increased reliance on renewable energy. The next one, we achieved that same temperature level, approximately, through geoengineering and direct carbon removal. And the third case, shown in the blue here, was the sulfate aerosol geoengineering.
And so, the question is for 10, which of these three scenarios is the best from an economic standpoint?There are lots of different ways of looking at the economic performance of each of these three, but I think the one that sort of sums it all up best is this total costs per capita. So, these are costs per person that we're gonna have to pay for producing the energy and the consequences of producing that energy in the form of climate change, or moderating it in terms of geoengineering costs. Then, you can see the two geoengineering cases here are pretty close to the same 9.3, 9.2 thousand. The conservation scenario and renewable energy one is considerably less expensive, so 2.4 thousand per person compared to nine. So, that's the clear winner. So, that's answer A for ten.
Eleven asks which of the three scenarios is best from an ocean pH standpoint? And so, here, we have to look at graph page number two, and these are shown in different scales. This just shows the pH for the last one, the conservation one, and that was at 8.06. And if you remember from before, that's about the same, close to the same, that we got with the DCR geoengineering. So, those two were about the same. Sulfate geoengineering, the ph got down to 7.58 , which is really a pretty dramatic acidification of the ocean. So, that's the worst by far. Conservation and renewables are close to the same. There's not a clear winner. So, the best answer is D, which is A and B are about the same.
And the last question of the assessment, twelve, asks from an overall environmental and economic standpoint, which of the three scenarios is the best? Well, as we saw in terms of ph, the conservation renewables and the dcr geoengineering are about the same. In terms of temperature, they're all more or less the same by the time we get to the the end of time. Although, you know, you could say that the conservation and renewable approach here, kept us at a lower temperature for more of the time, so that might be preferable in that sense. But then, the other thing, the economic standpoint as we saw before, this conservation and renewable scenario, shown here in green, that's the clear winner. So, if you take all these things together the conservation and renewable scenario is the best, overall, from an environmental and economic standpoint. That's answer A on the assessment and that's the correct answer.
- Which of the three scenarios is the best from an economic standpoint?
A) Conservation + Renewables
B) DCR Geoengineering
C) Sulfate Geoengineering
- Which of the three scenarios is the best from an ocean pH standpoint?
A) Conservation + Renewables (by far)
B) DCR Geoengineering (by far)
C) Sulfate Geoengineering (by far)
D) A and B are about the same
- From an overall environmental and economic standpoint, which of the three scenarios is the best?
A) Conservation + Renewables
B) DCR Geoengineering
C) Sulfate Geoengineering
D) There are no clear winners
Module Summary and Final Tasks
Module Summary and Final Tasks
End of Module Recap:
In this module, you should have mastered the following concepts:
- the various economic costs of climate change, including a general estimate of how much those costs will amount to for different amounts of warming;
- the costs of reducing carbon dioxide emissions;
- the strategies for reducing emission, including cap and trade and a carbon tax;
- the reasons why we need some kind of regulation scheme to control emissions, including the example of the tragedy of the commons;
- the basic components and assumptions of the DICE model, including the concept of a discount rate;
- adaptation to and mitigation of climate change will be of paramount importance in our future;
- climate change will force us to adapt our agricultural systems, our water systems, our energy systems, our transportation systems, and our health systems to meet the challenges of rising sea level, increasing temperatures, increasingly intense storms, and increasing droughts in some regions;
- there are plenty of examples of how to adapt to the changing climate, and progress is being made in many countries; the wealthy countries are much more likely to successfully make these adaptations; poorer countries will have a harder time and will require increased assistance from the wealthier countries that have contributed more to the causes of climate change;
- climate change will lead to migration/relocation of people on a scale that we may not have seen before — there is the potential for 200 million climate migrants by the year 2050; a disproportionate number of people live within the Low Elevation Coastal Zone, and their continued existence in these locations will not be viable as sea level rises;
- geoengineering schemes that seek to either remove CO2 from the atmosphere or block some of the incoming solar radiation hold promise as stop-gap measures to help us avoid serious climate change while we figure out how to reduce our emissions of CO2, but these schemes carry some risks and should not be considered to be easy solutions to our climate problems.
Assignments
You should have read the contents of this module carefully, completed and submitted any labs, the Yellowdig Entry and Reply and taken the Module Quiz. If you have not done so already, please do so before moving on to the next module. Incomplete assignments will negatively impact your final grade.
Labs
Lab 12: Geoengineering Climate Model