Step 7
Put it all together.
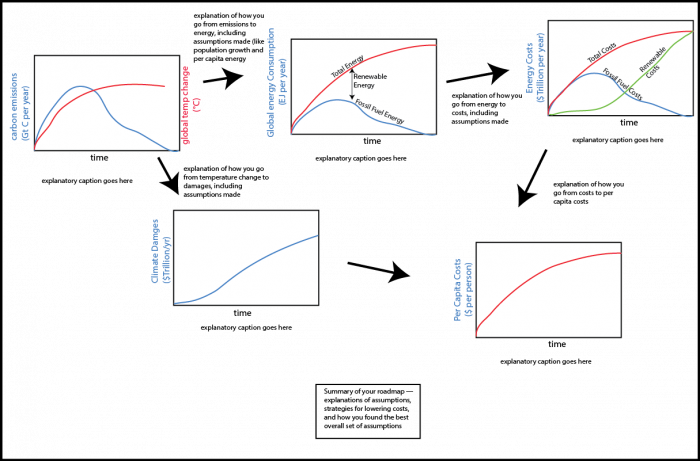
Once you’ve settled on your optimum roadmap, put it all together, into a kind of poster display — a large graphic with explanatory text that lays out your roadmap for the future (you can also submit it as a slide show in Powerpoint). To make this document, you’ll take screen shots of some of the model results, and add arrows and text that illustrate what choices you’ve made and explain your justification for choosing different values and scenarios. An easy way to do this is to use PowerPoint, where you can load, resize, position the screenshots and then add arrows, text, etc. as needed. You can specify the page size and make it very large, fitting everything onto just one slide (it should all be readable when you zoom in) — or you can put the materials onto a series of regular slides. You could do this in other programs too, such as Keynote or Adobe Illustrator, but whichever program you choose, make sure it can save as a PDF file that you will then submit in the Capstone Dropbox on Canvas.