Unit 3: A Path Forward
Help in Picking Our Energy Path
We have already seen in Unit 1 that energy is hugely valuable to us, that our current energy system is unsustainable and that burning most of the fossil fuels before we switch to a sustainable energy system would cause climate changes that make life much harder. In Unit 2, we saw that vast renewable resources exist, as well as other ways such as blocking the sun to deal with warming. Here in Unit 3, we will address whether we can afford to make the change, and how and why we might do so, by looking at the next three units listed below.
The unit consists of three modules:
- Economics (Module 10)
- Policy Options (Module 11)
- Ethical Issues (Module 12)
Video: Cell Phones and Science (4:14)
PRESENTER: What is a smartphone really? It's a little bit of oil for the plastic, a little bit of sand for the glass, and a little bit of the right rock, some red ones and some blue ones to make the various metals in here, and a huge amount of science and engineering wrapped up with some networking and some marketing and what have you. I've had people use their smartphones to send me messages saying that we scientists don't know what we're talking playing about with climate change. I've even had people use smartphones to send messages saying that scientists have no more insight to how the world works than any other group.
I suspect those people were trying to make a point and they might not fully have believed that. If you can imagine taking the sand and the oil and the red and blue rocks and giving them to various groups, the US House of Representatives, the church women's knitting society, the football team, and asking them to turn them into a smartphone, I think you'd wait a long time. But scientists and engineers really have done that.
In this phone, there's a GPS. It started as a US Air Force project. It knows where I am, in part, because it has relativistic calculations that date all the way back to Einstein. And without relativity, it would get lost in less than a day. It wouldn't work.
In here, there's a computer. It connects to the internet, which started also as a US military project to get researchers to talk to each other. And the computer is designed with the principles of quantum mechanics that date back the Planck and Einstein and Bohr and others. And the quantum mechanics also underlies our understanding of how radiation interacts with gases in the atmosphere that gives us such a very high confidence that our CO2 is changing the Earth's radiation balance and that affects the climate.
The physics of the quantum in the computer, the physics of the quantum in the air overlap. They're done sometimes by similar or overlapping communities. They're done by people studying in the same schools, using many of the same techniques. This works. And so does the physics of the atmosphere. And we can validate that and it really does.
There's another important point here. The fact that this works doesn't tell you who to call or what web sites to visit. It gives you options that you must choose from. The science of the atmosphere and energy and climate doesn't tell you what laws to pass. It doesn't tell you who you have to vote for. It gives you options that you can choose from.
So in this third section of the class, we're going to visit some of these options and decisions. We'll start with economics. Can we really afford to address climate and energy? Can we really afford not to address climate and energy?
Then we'll look at some of the policies we might adopt and we'll tiptoe our way into ethics. What's the right thing to do? But I suspect you already sort of have a clear picture. The science doesn't tell you what to do. It tells you what you can do. And from that, you can make wise decisions.
Unit Goals
- Recognize the role of human actions in determining the future of our climate
- Explain scientific concepts in language non-scientists can understand
- Find reliable sources of information on the internet
- Use numerical tools and publicly available scientific data to demonstrate important concepts about the Earth, its climate, and resources
Unit Objectives
In order to reach these goals, the instructors have established the following objectives for student learning. In working through the modules within unit 3 students will be able to:
- Recognize that there is a cost to future society of emitting CO2 to the air today.
- Describe how one might balance immediate needs against protection from future losses.
- Explain why growth cannot be infinite in a world of finite resources.
- Use an Integrated Assessment Model to determine the most economically beneficial approach to dealing with emissions and climate change.
- Recognize the multitude of policy options available for our energy system and economy.
- Explain how the effectiveness of emissions treaties and carbon taxes can be verified internationally using remote data collection.
- Recognize that shifting gradually to renewable energy is likely to have little overall impact on employment rates.
- Recall that energy policies and subsidies have been in use for decades, and some of these have promoted fossil fuels over renewable resources.
- Research and evaluate an example of an energy subsidy reported by the IMF.
- Explain that decisions about energy and environment have important but very complicated ethical implications.
- Recognize that relying more on natural resources does not always correlate with greater wealth or higher quality of life.
- Recall that if we value our grandchildren's quality of life as much as we value our own, then it is worthwhile to do more now to avoid climate change.
- Assess what you have learned in Unit 3.
Assessments
| Module | Assessment | Type |
|---|---|---|
| 10. Economics | DICE Model | Summative - Stella Model |
| 11. Policy Options | Government Subsidies | Discussion: Research and Report |
| 12. Ethical Issues | Learning Outcomes Survey | Self-Assessment |
Module 10: Economics
Module 10 Overview
Don’t even think about going to the bathroom in your neighbor’s driveway—you may not do so legally. The government has passed rules and regulations that outlaw such actions. But, this is not the only way to handle pollution. Another approach is to find out how much damage would be done to your neighbor, or to all of your neighbors if you went to the bathroom in one of their driveways, and then allow you to do so if you paid for the damages. But, how would you estimate the damages, and who would be paid?
The value to society of burning fossil fuels is much greater than the value to you of going to the bathroom in someone else’s driveway. So, little consideration is given to immediate rules to outlaw emission of fossil-fuel CO2 (although some rules to reduce CO2 are being enacted). Much consideration is being given to ways to estimate the damages caused by the CO2, and raise the cost of fossil fuels to reflect those damages.
This module looks at the economic side of estimating those damages. Most of the damages will happen in the future, because the costs of climate change go up exponentially as the temperature rises, and the temperature will remain elevated for a long time if we don’t take actions. So, some way is needed to estimate the present value of those future damages.
Economists typically do this with integrated assessment models, which allow for the use of money to reduce the damages of warming now or in the future, and all of the other uses of money, such as investing to help future generations be wealthy and have the resources to deal with the damages of climate change.
These analyses show that emitting CO2 to the air does have costs for society. Following usual economic assumptions about getting the most good for people from the things they consume, a response to reduce CO2 emissions is economically justified. But, because other uses of money are also valuable, the optimal response starts slowly, doing a little about climate change now and doing more later, while still allowing much climate change to occur. Many uncertainties are associated with these calculations, and it appears that most point to doing more now to reduce warming than this economically efficient path.
Goals and Objectives
Goals
- Recognize the role of human actions in determining the future of our climate
- Explain scientific concepts in language non-scientists can understand
- Find reliable sources of information on the internet
- Use numerical tools and publicly available scientific data to demonstrate important concepts about the Earth, its climate, and resources
Learning Outcomes
By the end of this module, you should be able to:
- Recognize that there is a cost to future society of emitting CO2 to the air today.
- Describe how one might balance immediate needs against protection from future losses.
- Explain why growth cannot be infinite in a world of finite resources.
- Use an Integrated Assessment Model to determine the most economically beneficial approach to dealing with emissions and climate change.
Roadmap
| To Read | Materials on the course website (Module 10) | |
|---|---|---|
| To Do | Complete Summative Assessment [1] Quiz 10 |
Due Following Tuesday Due Sunday |
Questions?
If you prefer to use email:
If you have any questions, please email your faculty member through your campus CMS (Canvas/Moodle/myShip). We will check daily to respond. If your question is one that is relevant to the entire class, we may respond to the entire class rather than individually
If you prefer to use the discussion forums:
If you have any questions, please post them to Help Discussion. We will check that discussion forum daily to respond. While you are there, feel free to post your own responses if you, too, are able to help out a classmate.
Paying the Piper
Paying the Piper
 Earth: The Operators' Manual
In case you want to remind yourself of where we might be going with renewables, here is a 7-minute roundup.
Video: Renewables Roundup (7:24)
(Richard Alley) Can low-carbon solutions really give us enough energy to power the planet and a growing population? Let's put some numbers on how much energy we can get from non-fossil fuel renewables... Today, all humans, everywhere on earth, use about 15.7 terawatts of energy. That's a big number. In watts, that's 157 followed by 11 zeroes, or one hundred fifty-seven billion of those 100 watt light bulbs we used as a reference. To show what's possible let's see if we can get to 15.7 terawatts, using only renewable energy. I'm here in the Algodones Dunes near Yuma, Arizona. The "Guinness Book of Records" says it's the sunniest place in the world. There's barely a cloud in the daytime sky for roughly 90% of the year. Zero point zero one percent... one one-hundredth of one percent. If we could collect that much of the sun's energy reaching the Earth, it would be more than all human of use today.
Today's technologies have made a start... This was the world's first commercial power station to use a tower to harvest concentrated solar energy. Near Seville, Spain, 624 mirrors stretch over an area of more than 135 acres... beaming back sunlight to a tower nearly 400 feet high. Intense heat produces steam that drives a turbine, which generates electricity. When completed, this one facility will be able to power 200,000 homes, enough to supply the entire nearby city of Seville. Remember our target of 15.7 terawatts? Well, the sun delivers 173,000 terawatts to the top of Earth's atmosphere... eleven thousand times current human use. No way we can capture all of that potential energy at Earth's surface, but the deserts of America's southwest, with today's technology, have enough suitable land to supply 80% of the entire planet's current use. Of course, there's one big problem with solar power... night.
But with more efficient transmission lines, and as part of a balanced renewable energy portfolio that includes storage, the sun's potential is vast. In tropical nations like Brazil, the sun heats water, makes clouds and unleashes rainfall that feeds some of the planet's largest rivers. Iguacu Falls is a tourist attraction, one of the most spectacular waterfalls on earth, where you can feel the immense power of falling water. The nearby Itaipu Dam, on the border of Brazil and Paraguay, produces the most hydroelectric power of any generating station in the world. This one dam supplies most of the electricity used in Sao Paulo, a city of more than 11 million. Sao Paulo is 600 miles away, but Brazil made the decision to build innovative high voltage direct current transmission lines to minimize energy loss. The Itaipu to Sao Paulo electrical grid has been in operation since 1984, and shows that renewable energy can go the distance. Dams can't be the answer for every nation... they flood landscapes, disrupt ecosystems, and displace people. But hydropower gives Brazil, a nation larger than the continental United States, 80% of its electricity. And world-wide, hydro-power could contribute 12% of human energy use... ready at a moment's notice, in case the sun goes behind a cloud.
Brazil is also using its unique natural environment in another way. Its tropical climate provides ideal conditions for sugarcane, one of the earth's most efficient plants in its ability to collect the energy of sunlight. Plantations like this one, harvest the cane for the production of sugar and the biofuel called ethanol. The U.S. is actually the number one producer of ethanol in the world, mostly using corn instead of cane. But ethanol made from sugarcane is several times more efficient at replacing fossil fuel than corn-based ethanol. Modern facilities like this one pipe back wet waste to fertilize the fields and burn the dry waste, called bagasse, to generate electricity to run the factory. For Brazil, at least, ethanol works. Today, almost all cars sold in Brazil can use flex fuels. Drivers choose gasoline blended with 25% ethanol, or pure ethanol, depending on price and how far they plan to drive. Local researchers say that if all the gasoline in the world suddenly disappeared, Brazil is the only nation that could go it alone and keep its cars running.
Using food for fuel raises big questions in a hungry world. As of now, sugarcane ethanol hasn't affected food prices much, but there are concerns with corn. So here in the U.S., government labs like NREL, the National Renewable Energy Lab, have launched programs to see if biofuels can be made from agricultural waste. It does work, and researchers are trying to bring the cost down. So with plants capturing roughly eleven times human energy use, they're a growing opportunity.
New Zealand takes advantage of another kind of energy. These are the geysers and hot springs at Rotorua on the North Island. Once they were used by the native Maori people for cooking and bathing. Now geothermal power plants harvest heat and turn it into as much as 10% of all New Zealand's electricity. Many power projects are partnerships with the Maori, benefiting local people and avoiding the "not in my backyard" problems that often complicate energy developments. Globally, geothermal energy offers three times our current use. But we can mine geothermal, extracting the energy faster than nature supplies it, cooling the rocks deep beneath us to make power for people. This energy exists even where you don't see geysers and mud pots, so it can be extracted without harming these natural wonders. A study by MIT showed that the accessible hot rocks beneath the United States contain enough energy to run the country for 130,000 years. And like hydroelectric, geothermal can provide peaking power, ready to go at a moment's notice if the sun doesn't shine and the wind doesn't blow.
Investments typically grow over time. But, if you don’t solve them, problems often grow too. And solving problems takes money, which could be invested now to solve problems later. Solve? Invest? Solve a little and invest the rest? Throw a party and worry about it later? What is a poor confused society to do? Call an economist!
Short version:
Using a calculation called discounting that is similar to interest-rate calculations, it is possible to estimate the present value or cost of future events. The discount rate, which is the real return you could get if you invested your money, is a function of the growth rate of the economy, as well as our preference for having things now rather than later (and thus us behaving as if our generation is more important than future generations). Actions to reduce CO2 emissions have costs now but benefits in the future. Thus, discounting is an important part of the economic models, called "integrated assessment models," used to compare possible paths to the future. The path that optimizes the tradeoff between these costs and benefits calls for beginning now to slow global warming, but in a measured rather than panicked way.
Friendlier but longer version:
We all face choices between today and tomorrow. Should I buy an apple now, or invest the money and have enough to buy two apples in a few years? Should I throw a party, or save the money to help support future generations of my family? Should I pay off the dangerous person who has suggested that if I don’t pay him he will punch my teeth out, or put the money into the hot new investment that will make me so wealthy that false teeth will seem cheap?

Economists have built a powerful intellectual framework for dealing with questions of this sort. The topic is usually discussed as discounting.
You can think of discounting as a tool to estimate the value or cost today of various future events. This allows you, or society, to compare the future results of possible decisions you could make today, and so choose the path that is least expensive or most beneficial overall.
Starting on the next page, we explain discounting with a little math. Note that we do not require that you master the math, or use it to calculate anything, but we owe it to you to show you how it goes. (And, we have found that knowing the math often helps, in many ways.) We then will apply the results to climate change.
Enrichment
Want to learn more?
Read the enrichment titled Discount Rate.
We can choose to spend money now to head off future climate change. Or, we can ignore climate change and just go about our business, spending money on things we consume now, but also spending some money on investments for the future. Then, our descendants can use their great wealth from those investments to deal with the problems caused by climate change. We will find that the economically optimal path takes a middle road, spending some money to reduce climate change but investing some money to make our descendants wealthy and letting them deal with the problems of climate change. This raises many other questions, some of which we will address. But, hard-nosed economics recommends some actions now to head off climate change.
Interesting Discounts
Interesting Discounts
Suppose you go to a bank and deposit one thousand dollars (or euros, or yuan, or whatever currency you prefer), which the bank promises to return to you at some time in the future. You will expect the bank to return more than you deposited. Say they promise to give you $1040 in a year. The difference, 1040-1000=40, is your interest. To get the interest rate, you need to divide the interest you received by the amount you put in the bank at the start, 40/1000=0.04. Most people dislike talking about an interest rate of 0.04, so they multiply by 100 and say the interest rate is 4%. Your bank probably had a big sign out front advertising “4% interest rate on savings!” Clearly, if you had deposited more, you would have gotten more interest at the same interest rate—put in 1,000,000, get back 1,040,000, the interest is 1,040,000-1,000,000=40,000, and the interest rate is 40,000/1,000,000=0.04 or 4%, just as before.
But, there is no requirement that you compare the interest to the amount you started with. Suppose instead that you divided by the amount you finished with. Go back to your original investment of 1000 that becomes 1040 in a year, with interest of 40, and calculate 40/1040=0.038 or 3.8%. That is the discount rate. (In the ENRICHMENT linked below we show that we could have set up the example so that the discount rate came out to be a nice easy number, with the interest rate harder to remember—a 4.17% interest rate gives a 4% discount rate, for example.)
Enrichment
Want to learn more?
Read the enrichment titled Interesting Discounts.
Next, suppose you see a problem. Say, the roof on your house is leaking. Fixing the roof today will cost you the $1000 that you happen to have in your wallet. If you don’t fix the roof, then in 20 years the roof will still cost $1000 to fix. (We have ignored inflation because economists can correct for it before making the calculation, as described in the ENRICHMENT. And, you could spend the $1000 on many other things, including a party or a vacation, a point to which we’ll return soon. Just go along with us for now.) But, if you wait 20 years to fix the leak, the dripping water will cause another $1000 in damage to your house, so the total repair will cost $2000 in 20 years. Should you spend the money from your wallet to fix the leak now, or invest the money and fix the leak in 20 years?
To answer this question, you can calculate how much money you would need to invest now so that you have $2000 in 20 years to fix the roof—this is often called the present value of the future cost. If this present value is less than the $1000 needed to fix the roof now, then you could invest the present value in a “fix the roof in 20 years” fund, and have the rest of your $1000 to spend on other things; however, if the present value is more than $1000, you would be better off economically to fix the roof now.
In our example, with a 4%=0.04 discount rate and a future cost of $2000 in 20 years, the present value is 2000/(1+.04)20=913. Hence, you can invest $913 in your “fix the roof in 20 years” fund, and use the rest of your $1000 for other things now. (If you prefer an equation with symbols, let the present value be P, the future cost F, the discount rate be D%, the number of years be t, and the equation is P=F/(1+D/100)t; D/100 turns the 4% into .04, add that to 1, raise the resulting 1.04 to the t th power, and divide F by all of that.)
The issue is similar for society dealing with fossil fuels. Fossil-fuel CO2 emissions cause damages that are costly to us and to other people in the future, and those damages increase as more CO2 is emitted. So, just as for your leaky roof, we could avoid future costs by spending money now to reduce CO2 emissions. But, money spent reducing CO2 emissions is money that is not used for other purposes, such as investing in growing the economy so that our grandchildren and their grandchildren are much wealthier than we are and can afford to solve the problems caused by the CO2. The decision whether to fix the roof now or later is similar to the decision whether to reduce fossil-fuel emissions now or pay to fix the damages later.
If the discount rate is high, then the troubles our CO2 causes for future generations of people have very little present value; then, if we behave in an economically optimal manner, we should spend only a little money trying to reduce our CO2 emissions. If the discount rate is low, then optimal behavior now involves spending more to reduce CO2 emissions.
We’ll discuss how this calculation is made later. But first, let’s take a closer look at what sets the numerical value of the discount rate—1% or 4% or 7%—because it is the most important control on what behavior is economically optimal if we look at the problem in this way.
Forever, and Ever
Forever, and Ever
The discount rate is usually taken to be equal to the real rate of return you can get from investments. And this is based on three parts: growth of the economy, how quickly more stuff satisfies our desire for still more stuff, and our preference for having stuff now rather than later. For a slightly more technical discussion, see the ENRICHMENT.
Enrichment
Want to learn more?
Read the Enrichment titled Discount Rate.
Economists know that sometimes recessions or depressions happen, the Dark Ages really did engulf Europe, and civilizations have fallen in many places. But, with a sufficiently broad view, the economy has always regrown even stronger from these setbacks, as people produced more and more goods and services. Some of this growth is linked to population growth—we have more workers—but some of the growth is the increase in economic productivity per person.
Video: World GDP Per Capita (1:17)
PRESENTER: This figure from Qwfp at Wikipedia.org-- the source is down here on the lower left-- shows the history of the size of the world economy per person. So more dollars or more economic activity goes up against time starting in the year 1500 on the left and running up to 2,000. And then growth has continued.
And what you'll notice is that the economy per person as grown fairly steadily even with all the wars. Even with all the plagues and everything else, we've seen growth. This growth looks like what we call an exponential. Except, what we know is that an exponential goes to infinity and we are confident that you can't make something infinite.
The really interesting questions are whether the future eventually flattens out or whether the future might flatten out and then come down gradually, or whether the future might go way up and then crash into something horrible. And this is a subject that has to interest a lot of people in a lot of ways
In mainstream economics, the assumption is often made that this growth per person will continue for a long time, so that we are so far from any limits on growth that they do not have a meaningful effect on economic activity now. If you expect the economy to grow rapidly, then the discount rate is high—your grandchildren will have the resources to address problems from climate change even if you don’t invest much to help them. (Some economists have explored alternatives to this; we’ll visit such issues soon.)
Next, a single apple is more valuable to a starving person than to an overfed billionaire; the apple may be as valuable to the poor person as a yacht is to the billionaire. If you believe that economic growth per person can continue for a long time, then investing now to help future generations means that you’re taking apples from you, a poor person, and giving apples or yachts or dollars to your incredibly wealthy grandchildren. If this transfer of money to wealthier future generations doesn’t bother us very much, then the discount rate is low and we try to help them; if we object to giving money to rich people, then the discount rate is high and we tend to spend more on us now.
Finally, we tend to behave as if now is more valuable than later, and our generation is more valuable than future generations. We won’t give the bank a dollar unless they promise to give us more than a dollar back, and we demand a greater extra payment than can be explained by the expected growth of the economy and our objections to giving money to the wealthy, even if the “wealthy” person is just us getting our money back from the bank a year later. This extra demand is just us saying that we matter most. The more we are focused on us, the higher the discount rate, and the less we invest to help the future. This is sometimes called the “pure rate of time preference”. For a person, preferring a reward now to the same reward sometime in the future is well-known. But when we choose the reward rather than giving it to future generations, some people harrumph and refer to it as “selfishness”.
Economists do NOT tell us that this is good or bad; they tell us that they have watched people buying and saving in the real world, and this is how we behave. Rather clearly, this raises large ethical issues, which we will consider later in the course—regardless of whether you call it “pure rate of time preference” or “selfishness”, some people don’t like it. For now, please don’t worry about the ethics, or the limits to growth. Because, perhaps surprisingly, even if we assume that the economy can grow forever, and we don’t want to help the future generations very much because they will be so wealthy, and we are more important than they are anyway, we still should be spending money to head off global warming if we wish to be economically efficient!
All Together Now... Integrated Assessment
All Together Now... Integrated Assessment
So, we have a framework to help us choose today the path that gets the most economic value (the utility of consumption) by estimating the current value of various future events. With the appropriate numerical model, a skilled economist can test various possibilities to find the optimal path, the one that gives the most good from the things we use.
The modeling is normally done with integrated assessment models. We enjoy consumption today, but investing rather than consuming now gives more consumption in the future. Writing the equations for this, as they work through the whole economic system, is a well-developed branch of economics. The integrated assessment models add a representation of the climate system, its response to the CO2 generated by the greenhouse gases that now power most of the economy, and how those climate changes, in turn, affect the economy.
Video: Earth System (1:29)
PRESENTER: This complicated figure comes to us from the US Global Change Research Program-- USGCRP-- in 2006. And this is a diagram showing an integrated assessment model. And we talk a good bit in the course about what integrated assessment models are and what they do.
This is a cartoon of one of them. And what it does is to take natural causes of climate change-- but also human causes of climate change, such as CO2 and other things-- and ask, how do these interact with the ocean, with the land, with the living things, with the atmosphere, with air pollution, and with the things that we grow to eat, the logging we do, and other things to make economic activity that in turn affects so many of these other things? What you end up with out of this are estimates of what is happening to living things, what is happening to the world's climate, and what is happening to the economy as they interact with each other?
You should not try to memorize all the pieces of this. But you should see what goes into providing us the knowledge base to make wise decisions about these things.
For example, if we decide to ignore climate change, then the economy will hum along making greenhouse gases, we will initially consume a lot (good, in the model). But, the damages from the CO2 will cause economic losses that rise rapidly, so as the model is run into the future it projects greatly reduced consumption (bad, in the model). Hence, ignoring climate change is not an optimal path.
However, if we outlawed fossil fuels today, thus avoiding much future climate change and its associated costs, we would greatly reduce economic growth. (Actually, we would have an economic crash.) This would lower consumption (bad, in the model). So, the optimum must be somewhere between do-nothing and do-everything to stop climate change from our greenhouse gases. (We’ll return in Module 11 to the possibility that modern policies are actually serving to accelerate global warming by promoting fossil fuels, and thus are further from the optimum than simply doing nothing.)
Looking at all the possible choices (or at least a representative sample, using sophisticated techniques to narrow the search) between consuming, investing in actions that will slow climate change, and investing in other ways, the integrated assessment models can be used to find the best path. In the great majority of published cases, and including cases that explore the uncertainties in our knowledge, the models find that a measured response to reduce global warming is best. The result from William Nordhaus’ DICE model is probably the best known and is quite representative: put a small price on emitting carbon dioxide into the atmosphere now, and increase it at a specified rate per year (2-3% in recent work). In his book A Question of Balance (Yale University Press, 2008), this spends $2 trillion to avoid $5 trillion in damages but allows $17 trillion in damages to occur. (We will revisit these issues! Bear with us. And, all of this is in present value.)
Please note that because the model attempts to simulate the whole economy, other possible uses of that $2 trillion (curing malaria, or feeding starving children) are implicitly included in the assessment. If curing malaria is an investment (it would greatly increase the economy, for example), it is part of the investment portfolio; if we want to spend more on curing malaria than would be justified on purely economic grounds, that is a choice we make and so is a type of consumption. Any use of money, whether it is curing malaria or heading off climate change, can be treated in the same way, as long as the use is not a large fraction of the whole economy. Thus, use of the $2 trillion to head off climate change over the coming decades is appropriate because other money is available from the whole huge economy to do other things.
Activate Your Learning
You may hear arguments that we should not invest in efforts to reduce climate change because curing malaria is more important. Have you ever had to choose between taking care of an immediate need and investing against bigger losses in the future? How did you decide what to do in that situation?
Click for answer.
Whether or not to invest $2 trillion to reduce climate change more or less depends on the discount rate used. Let’s go back to your house, as a simpler case, and suppose instead of 20 years, we think about 100 years, a time-scale that matters in climate change. Suppose that there is a problem in your house that in 100 years will cost $1000 to fix. Our equation for calculating present value, from above, is P=F/(1+D/100)t. With t=100 years, and F=$1000, if the discount rate is D=4%, then the present value is $19.80. Bizarre as it may seem, spending $20 now to fix a problem that will cost $1000 is not a wise investment; better to invest the money and let future generations solve the problem with the wealth you give them. Raise the discount rate to 7%, and the current value is down to $1.15; if you have a pocket full of change, you would be economically inefficient if you spent it to head off a $1000 problem. But, drop the discount rate to 1% and you should spend as much as $370 to head off the problem. Changing the discount rate from 1% to 7% changes the current value more than 300-fold. And, you can find reasons why either value might be used.
This highlights the reality that in these integrated-assessment economic-optimization exercises, the discount rate is typically the most important issue. We will look at that soon, including the perhaps surprising result that our uncertainty about the discount rate translates into a lower discount rate over longer times. But first, a word about costs of emitting carbon.
Fees to Flush
Fees to Flush
In most of the world, it is absolutely illegal to go to the bathroom in your neighbor’s yard. Instead, people are legally required to do such things in special places (bathrooms, loos, water closets, toilets, or whatever you want to call them), and pay for sewer or septic services to assure safe disposal. Similarly, most people are required to pay someone to haul away household trash (just under 1000 pounds or 500 kilos per person per year in the US), and businesses are required to pay to dispose of their wastes. Dumping your waste in your neighbor’s yard is strictly forbidden.
If your wind turbines or solar cells break and you can’t fix them, you must pay to recycle or dispose of them. But, the roughly 20 tons of CO2 per person per year from the US economy are dumped into the air with no cost at all to the people or businesses that produce CO2. The same is true for much of the world, although some places have used policy actions to place taxes or fees on CO2 emissions, but still generally less than the damages caused (see below). And, we have high confidence that the CO2 does hurt other people.
The ability to use discounting to estimate the present value of future events means that the costs or benefits associated with emitting CO2 can be estimated. CO2 does fertilize plants, and in especially cold places warming may be economically beneficial, but the costs come to dominate. The cost today of the damages caused by emitting CO2 is called the social cost of carbon.
The 2007 IPCC (Working Group 2, ch. 20 and Summary for Policymakers) reported on more than 100 estimates of this social cost of carbon, running from $-2 per ton of CO2 (very slight benefit) to $86 per ton of CO2 (moderately large cost). For comparison, burning just over 100 gallons of gasoline will release 1 ton of CO2. Recently in the US, this has been about $300-$400 in gasoline. A car getting 25 miles per gallon and driven 10,000 miles per year would make 4 tons of CO2 per year, costing the driver about $1500 for gasoline and costing society perhaps 10% of that, if you take the average of the high and low values just above. (The numbers here are all in 2000-pound short tons of CO2. You will see different numbers if you go look at the IPCC report because they were quoted in 1000-kg metric tons, and were for tons of carbon instead of tons of CO2; we have made the conversions for you.)
Additional estimates noted by the IPCC were as high as almost $400/ton for the social cost of releasing CO2. Many factors contributed to this large range; again, the discount rate is often the most important control. In 2013, the US government reevaluated the cost of carbon used in calculations, and found that the cost of emissions in 2020 (not that far in the future) would be $12/ton for a 5% discount rate, $43 for 3%, and $65 for 2.5% (in 2007 dollars) and rising for emissions further in the future. The government also checked what would happen if the parameters in the calculation are near their most-expensive end rather than in the middle of the possible range, and found with the 3% discount rate a cost of $129 per ton.
Video: Social Cost of Carbon Graph (1:44)
PRESENTER: This figure from the US Government in 2013 shows the estimates of the social cost of carbon, how much damage is caused to society by emitting a ton of CO2 to the atmosphere. It's done with various uncertain parameters, and so they did a range of simulations of possible outcomes. And so you get a distribution in the number of simulations, they give a different number as shown here.
If we start out with the blue one, which is the discount rate of 5%, which is the future doesn't matter much, so you're basically just concerned about now, then what you end up with is a very low social cost of carbon, which you might actually be zero, but probably is a little bit above zero. However, as you go through the green into the red, which is, essentially, that the future matters a lot, what do you end up with is a much higher social cost of carbon. You estimate that when you emit carbon to the air, it costs society a whole lot.
There's a very slight chance that it's low, but there's also a larger chance that it's actually really high. And it could be very, very high. This sort of distribution-- there's a best estimate it could be a little less, a little more, or a lot more-- is very common in these. But it's clear that when we emit carbon to the atmosphere, we are causing damage to society. And allowing that carbon to be emitted to the atmosphere without paying for it is a sort of subsidy for fossil fuels.
The IPCC also noted that it is likely that all of these estimates of the cost of carbon are too low (which would probably shift the slight benefit estimates to being costly as well), because many of the damages of CO2 are not “monetized”. Suppose, for example, that climate change from rising CO2 causes the extinction of species that are not being used commercially. Some of those species may have had economic value that had not yet been realized, and many people may have valued those species for other reasons. But, if those species are not contributing to the economy now, their loss is not a cost of global warming in these studies. Other issues, such as the possibility of long-term catastrophic events (making the tropics uninhabitable for unprotected large animals, for example) are also not included in the costs of global warming. The IPCC notes that the calculated costs are based on only “a subset of impacts for which complete estimates might be calculated” (ch. 20, WGII, p. 823, 2007).
Video: 10 Pikas (3:22)
RICHARD ALLEY: (VOICEOVER) American Pika's live in though Western US and Canada, and except in very special circumstances, they have to live in cold places. They're related to other pikas, and to rabbits and hares. They're lagomorphs.
Pikas don't hibernate despite living in cold places. They spend the summer making hay. They run around gathering up flowers and leaves, grasses, and what they can, and they stow them in a space under a rock. And then they can hide in this hay and stay warm during the winter and eat it, and they're having a very good time there.
Many people think pikas are really cute. On one of our early family vacations, finding a pica was a goal, and we went out of our way looking for pikas, and we found them and we had a ball doing it.
Because pikas like cold climates, many populations are being placed in danger by a warming climate. This figure shows in the bluish areas the suitable habitat for pikas recently in the US. And then the little red areas in the centers there show the habitats that are expected to remain around the year 2090-- one human lifetime from now-- if we follow a high CO2 emissions path.
Some populations of pikas out in the Great Basin are already endangered or have disappeared. We looked at the economic analyses of global warming, which compare cost of reducing climate change to the cost of the damages if we allow change to continue. And which show that we will be better off if we take some actions now to reduce warming.
But in general, such economic analyses do not include pikas. Loss of populations of pikas, even extinction of the pika has little or no economic value. We personally spent money on tourism that involved pikas. But we probably would have gone to see something else if pikas hadn't been there.
Pikas aren't really monetized. They haven't been turned into their monetary value. And so the loss of pikas isn't monetized either in these calculations, nor would be loss of polar bears or many, many other species.
If you believe that pikas are valued, that if you pay a little money to save pikas, or if you believe we have an ethical or religious obligation to preserve creation, including pikas, then the optimum path for you would involve doing more now to slow global warming.
If you don't believe pikas are a value, the economic still says that we should do something to slow global warming if we want to be better.
The social cost of carbon, if it is not offset by a tax or other fee on emitting the carbon, is essentially a subsidy from society for fossil-fuel use. We will return to this topic when we consider policy options in the next module.
Dithering with the Discount Rate
Dithering with the Discount Rate
Recall that the discount rate is often taken as being large if the economy is expected to grow rapidly, or if we behave as if we don’t like giving money to future generations because they will be so much richer than we are, or if we prefer things now rather than later (so, essentially, we behave as if we are more important than future generations). The last of these is often the starting point for ethical critiques of such modeling and will come up again in Module 12. We won’t say too much here about our willingness to transfer money to wealthier people in future generations; but, that willingness won’t matter if future generations aren’t wealthier than we are. So, let’s take a look at the assumption of continuing economic growth.
Economists are surely correct—if you take a sufficiently broad and long view, the economy always has grown, as we have become better and better at providing goods and services for each other. Local reversals occurred, but the broadest trend has been upward.
The mere existence of this trend does not prove it will continue—when Dr. Alley was 20, he had been getting stronger and faster his whole life, and merely extrapolating those trends to today would make him a world-record holder in numerous athletic events, which did NOT occur.
But, economists not only see the trend, but they understand how new scientific discoveries and commercial innovations make economic progress possible as we invent and build, and pass on to future generations the roads and buildings, and the knowledge. Think of a smartphone, which is nothing but a little sand, a little oil, and a few appropriate rocks, plus an immense amount of accumulated know-how. Even with the recent shortage of rare-earth elements, there is little doubt that the world can produce far more smartphones than have been made to date, with more apps, contributing to economic growth in many ways.
However, some parts of the economy, such as fishing and forestry and farming and fossil fuels, are supported by much larger parts of the Earth. We have already seen that our energy system is grossly unsustainable—if we keep doing what we’ve been doing, the highly concentrated fuels that yield more energy than needed to extract them will run out as practical resources, possibly in decades, almost certainly before many centuries pass. Economists will rightly point out that resources don’t really run out; as prices rise, substitutes are found. But, an energy system that looks a lot like our current one is almost guaranteed to become impractical within a time frame that is short compared to the written history of humanity.
Many other human activities are unsustainable as well. We rely heavily on phosphorus for fertilizer (as well as nitrate; see below). The Earth has huge amounts of phosphorus, but almost all of it is very widely scattered and not even vaguely commercial at modern prices. We are using the concentrated deposits very rapidly. With enough energy, we could re-concentrate phosphorus we have scattered, or that nature has scattered, but that takes us back to the unsustainable energy system.
Many scholars have attempted to calculate the “ecological footprint” of our lifestyle—how much land and ocean is required to grow the food we use or the fish we catch, process our wastes and provide the other things we rely on. Typically, these estimates find that with our current practices and technologies, the Earth cannot support the population already here with the lifestyle we are living. And, with expectations of improved lifestyle, and the population growing, many people expect this imbalance to increase.
Video: Rabbits - Exponential Growth (2:50)
PRESENTER: This is one cute Eastern Cottontail rabbit. Young ones often have a little white mark on their forehead. If you have one cute rabbit, you have one cute rabbit.
But if you have two rabbits, before you know it, you may have four rabbits. And then you may have eight rabbits. And then you may have 16 rabbits. And then 32 rabbits. And then 64 rabbits, and more rabbits.
This is an example of what is often called exponential growth. The more you have, the faster the growth, and it clearly can't go on forever or the whole world would be rabbits. Now, this is a picture of something that looks like exponential growth, but this happens to be the growth of the size of the world economy per person over time from the year 1500, on your left, up to the year 2000, on your right.
So this is something like dollars per person per year or euros per person per year. And you can see it cranking up very rapidly. The economy has grown, and that's what economists normally assume is going to happen. But exponential growth is exponential growth, and it can't go on to infinity. You can't actually just keep running up forever and ever and ever. No, because ultimately there are limits. You run out of things. Infinity can't be reached.
The very interesting question then is what does the future hold. Will the growth roll over to some sort of stable economy? Will growth spike up and then crash down before stabilizing or before crashing completely? And those are very interesting questions that drive a lot of people to ask very big things.
But the sort of will grow forever is built into some models, or at least that we aren't close enough to rolling over that we have to worry about it. If we are close to rolling over, and that starts to show up, then our future generations won't be as wealthy as we think they are. And they won't have as easy a time dealing with climate change as we think it is, and it would be wiser for us now to do more to head off climate change.
Activate Your Learning
Why can't the Gross Domestic Product - the wealth of the people - truly grow exponentially?
Click for answer.
Technology is surely improving, as it always has, helping us deal with such challenges. But, as we bumped up against limits in the past, we used improved technologies, but we also used unoccupied space. Thus, when a shortage of natural sodium nitrate made fertilizing crops difficult, Fritz Haber figured out a new technology, using energy to convert the nitrogen from the air into nitrogen fertilizer. But, when the Yankee whalers could no longer find right whales in the Atlantic, the fleet moved to the Pacific and then into the Arctic. And for whales, when the whole ocean was utilized, that option was no longer available. True, we might have some huge breakthrough and start mining asteroids, or we might get nuclear fusion working to provide power. But without major jumps in technology, we are increasingly finding that wherever we go, someone is already there and using the resources.
Suppose we ask the question “Are there practical limits to growth, that will cause economic expansion to slow down, soon enough to affect the present value of events considered in the integrated assessment models?” You could probably find well-respected scholars making convincing but conflicting arguments that would give different answers to this question. The correct answer might be “No, there aren’t”, or “Yes, there are very strong limits that cannot be breached and that will be reached soon.” Or, the correct answer may be somewhere in-between, with the limits making growth more difficult in some areas.
Economists are well aware of these issues, and many informative discussions are available. You may be interested in the essay by R.M. Solow, 1991, Sustainability: An Economist’s Perspective, presented as the Eighteenth J. Seward Johnson Lecture to the Marine Policy Center, Woods Hole Oceanographic Institution, and available at many libraries and at sites on the web when we checked. Also see Nordhaus, W.D., 1994, Reflections on the Concept of Sustainable Economic Growth, in Economic Growth and the Structure of Long-Term Development, L.L. Pasinetti and R.M. Solow, eds., Oxford University Press, p. 309-325.
Some integrated assessment models, such as the DICE Model mentioned earlier (which you will work with in the summative assessment for this module), do consider the influence of limits to growth on economic expansion. Indeed, the version of the DICE model we will use has the global GDP growing at increasingly slower rates as we move through the next century. Uncertainty about how GDP will grow means that such models may overestimate or underestimate the present value of future damages from emitting CO2. However, other models have worked with the assumption that there are no practical limits to growth that will affect us soon enough to be included, using a constant discount rate over a century, for example. If we do hit limits to growth before then, such studies are underestimating the optimal effort to reduce warming now.
An extreme application of discounting can lead to absurd results. For example, with a constant discount rate, you could show that investing a penny now to stop the destruction of civilization 10,000 years from now would not be economically efficient. Such apparent silliness again is recognized in the research community, and motivates interesting scholarship, including the work by R.G. Newell and W.A. Pizer, 2003, Discounting the distant future: how much do uncertain rates increase valuations, Journal of Environmental Economics and Management 46, 52-71. They found that uncertainty about future discount rates translates into a lower discount rate over longer times. Importantly, this in turn almost doubles the estimated value of taking actions now to reduce global warming from fossil-fuel CO2. See the Enrichment linked below.
Enrichment
Want to learn more?
Read the Enrichment titled Uncertainty Lowers the Discount Rate.
Getting What You Measure
Getting What You Measure
As discussed earlier, the economic studies in this field often seek to identify the optimum path to maximize the utility of consumption. Consumption is often estimated by subtracting investment (in the economy or in avoiding climate change) from the Gross Domestic Product (GDP), the sum of the goods and services in the economy.
But, total consumption as estimated through GDP is a very imperfect measure of the good, or enjoyment, we get from the economy. Consider an odd example. If family A has children and raises them, and family B has children and raises them, then no economic activity has occurred. But if family A pays family B to raise the A kids, and family B pays family A to raise the B kids, then raising kids is part of the GDP. Many economic studies would find that people are better off in the second case because GDP has risen, but few people would agree, especially if taxes were extracted from the payments in the second case.
Perhaps more relevant, after a hurricane destroys a city, economic activity is lost because people are not working their usual jobs for a while, but economic activity is gained because people must clean up and rebuild. Very few people would agree that money spent fixing hurricane damage is good, but such money appears in the GDP. On the other side, if technological progress means you get a better computer for the same cost, GDP misses the improvement.
Video: Hurricane GDP (1:38)
PRESENTER: Many economic analyses say that sort of the gross domestic product-- the GDP-- is good. And a bigger GDP, spending more money in the economy is a good thing. Well, there's a lot of useful information to this, but it's not completely accurate.
These pictures from the United States Geological Survey are showing the affect of Hurricane Katrina on the coast of Mississippi near Biloxi in the USA. What you see here is a picture on top from September 19, 1998, which is well before the hurricane-- and one on the bottom from August 31, 2005 after the hurricane.
You will notice things such as there was a pier house and then it was gone. And there was a pier and then it was gone. And there was this beautiful pre-civil war mansion, and well, try to find it down below and you know it's not there anymore. Now, if they spend money to fix these things that money spent fixing these will show up in the GDP. And people will say, oh, look the economy grew, but that might not be a good thing.
If we see more disasters in the future, those disasters break things that we have to fix. Those will show up as a growing economy, but that doesn't mean that people are better off. And in that case, we probably need better measures of what we're seeing.
Various alternatives to the GDP have been developed by economists, such as the Measure of Economic Welfare (MEW; Nordhaus, W. and J. Tobin, 1972, Is growth obsolete? Columbia University Press, New York), or the Genuine Progress Indicator (e.g., Lawn, P. and M. Clarke, 2010, The end of economic growth? A contracting threshold hypothesis, Ecological Economics 69, 2213-2223). These alternatives seek to more accurately characterize real growth, or sustainable growth, in some fashion. There is much interesting and important scholarship, and much more than we can cover here.
But, if a general conclusion can be drawn from this work, it is that the recent growth of well-being probably has been slower than indicated by the recent growth of GDP. And, if this general summary is correct, then economically optimal behavior now involves greater actions to reduce climate change than indicated, because our descendants will not gain wealth and thus the ability to solve the problems from global warming as rapidly as indicated above.
One also might ask whether it is really accurate that wealth allows the solution of all problems. What if global warming generates crises that wealthy future generations cannot solve? The optimizations now generally assume that this will not happen, but if problems that resist money can arise, more action now to head off climate change may be economically justified.
Even bigger questions of whether economic growth is even desirable, or whether our future goals should be very different from our past, are beyond the scope of the instructional materials of this class. However, such questions are not beyond the scope of interest of the class participants—you might wish to think about it.
Summative Assessment
Reminder!
After completing your Summative Assessment, don't forget to take the Module 10 Quiz. If you didn't answer the Learning Checkpoint questions, take a few minutes to complete them now. They will help your study for the quiz and you may even see a few of those questions on the quiz!
Modeling the Economics of Climate Change Activity
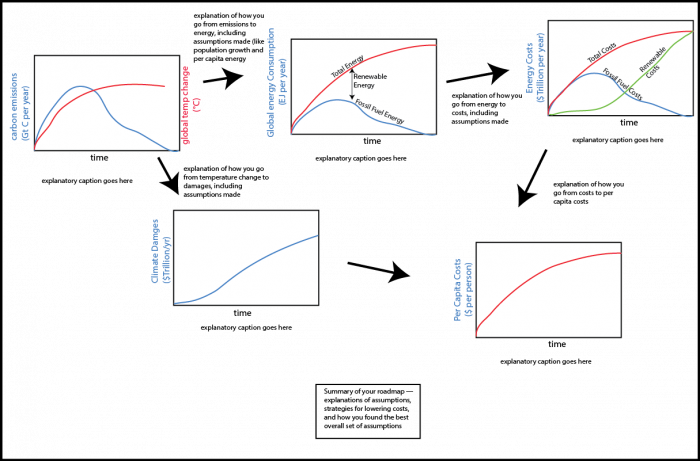
The global climate system and the global economic system are intertwined — warming will entail costs that will burden the economy, there are costs associated with reducing carbon emissions, and policy decisions about regulating emissions will affect the climate. In the language of systems thinking, this means that there are important feedback mechanisms in this system — a change in the economics realm will affect the climate realm, which will then influence the economics realm. These interconnections make for a complicated system — one that is difficult to predict and understand — thus the need for a model to help us make sense of how these interconnections might work out. In this activity, we’ll do some experiments with a model (a modified version of Nordhaus' DICE model mentioned earlier in this module) that will help us do a kind of informal cost-benefit analysis of emissions reductions and climate change. As with the other STELLA-based exercises you've done, this one will help you develop your abilities as a systems thinker.
Instructions
Read the following pages for an introduction to this model (this introductory material is also on the worksheet you download below) and then run the experiment using the directions given on the worksheet. As before, there is a practice version, with answers on the worksheet, and a graded version. Once you have completed the graded version and entered your answers on the worksheet, go to Module 10 Summative Assessment: Graded to enter your answers.
Files to Download
Download worksheet [5] to use when submitting your assignment
Submitting Your Assessment
Once you have answered all of the questions on the worksheet, go to Module 10 Summative Assessment: Graded. The questions listed in the worksheet will be repeated in this Canvas Assessment quiz. So all you will have to do is read the question and select the answer that you have on your worksheet. You should not need much time to submit your answers since all of the work should be done prior to starting the Assessment. The assessment is timed. You will have 40 minutes to complete it.
Grading and Rubric
| Item | Possible Points |
|---|---|
| Questions 1-8 | 1 point |
| Questions 9-10 | 3 points |
Activity: Modeling the Economics of Climate Change
Activity: Modeling the Economics of Climate Change
Video: Model Introduction(2:24)
For the module ten summative assessment, we're going to be working with this very large and complicated model, that consists of a number of different parts. You can see down in here this is the global carbon cycle and then that includes the percent or the concentration of CO2 in the atmosphere. That concentration of CO2 in the atmosphere then feeds into a climate model that tells us the temperature. And that temperature then goes into determining the sort of climate damages caused by a global temperature, global warming. Those climate damage costs then affect the amount of money that we have leftover to invest in the economy. So here's global capital - this is the whole kind of the heart of the economic model up in here. So climate damages come into play here. Another important cost that comes into play are the abatement costs. These are the costs related to reducing carbon emissions. And so there's something down here called the emissions control rate that we'll fiddle around with. It represents, essentially, different choices we make about how much we're going to try to limit carbon emissions. That limits how much goes in the atmosphere, it limits the temperature, and so on. But it costs money, so there's a certain abatement cost per gigaton of carbon that you are not emitting into the atmosphere. There are a whole bunch of other parts of this global climate and climate and economic model, including something that keeps track of what Nordhaus calls social utility. The global population here is sort of fixed and these are a bunch of things that just sort of sum up some of these economic components of the model. So this is the big model that's behind the scenes. When you look at the actual model, you'll be seeing something like this - an interface where you're just going to change a few basic things. And& for this summative assessment, we're really just going to change the emissions control rate here, which is a graphical function of time.
The global climate system and the global economic system are intertwined — warming will entail costs that will burden the economy, there are costs associated with reducing carbon emissions, and policy decisions about regulating emissions will affect the climate. These interconnections make for a complicated system — one that is difficult to predict and understand — thus the need for a model to help us make sense of how these interconnections might work out. In this activity, we’ll do some experiments with a model that will help us do a kind of informal cost-benefit analysis of emissions reductions and climate change.
The economic part of the model we will explore here is based on work by William Nordhaus of Yale University, who is considered by many to be the leading authority on the economics of climate change. His model is called DICE, for Dynamic, Integrated Climate, and Economics model. It consists of many different parts and to fully understand the model and all of the logic within it is well beyond the scope of this class, but with a bit of background we can carry out some experiments with this model to explore the consequences of different policy options regarding the reduction of carbon emissions.
Nordhaus’ economic model has been connected to the global carbon cycle model we used in Module 8, connected to a simple climate model like the one we used in Module 4.
The economic components are shown in a highly simplified version of a STELLA model below:
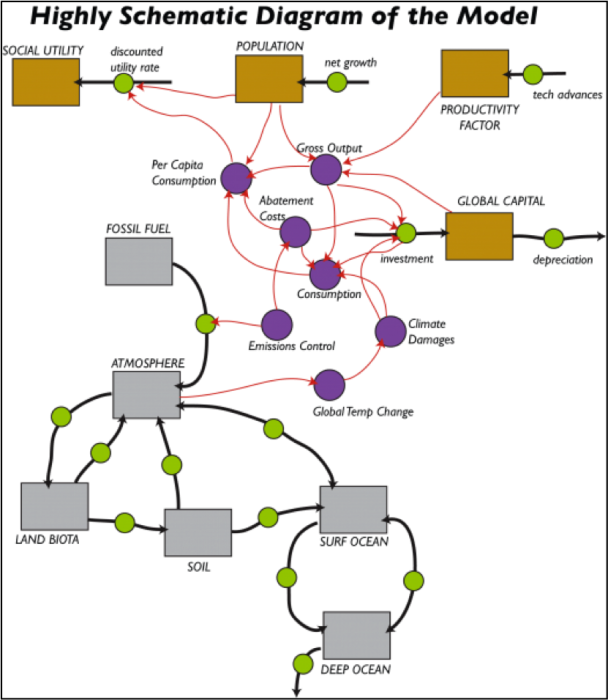
In this diagram, the gray boxes are reservoirs of carbon that represent in a very simple fashion the global carbon cycle model from Module 8; the black arrows with green circles in the middle are the flows between the reservoirs. The brown boxes are the reservoir components of the economic model, which include Global Capital, Productivity, Population, and something called Social Utility. The economic sector and the carbon sector are intertwined — the emission of fossil fuel carbon into the atmosphere is governed by the Emissions Control part of the economics model, and the global temperature change part of the carbon cycle model affects the economic sector via the Climate Damage costs. Let’s now have a look at the economic portions of the model. You should view this video about the DICE Economic Model [6] first, and then study the text that follows.
The Global Capital Reservoir
The Global Capital Reservoir
In this model, Global Capital is a reservoir that represents all the goods and services of the global economic system; so this is much more than just money in the bank. This reservoir increases as a function of investments and decreases due to depreciation. Depreciation means that value is lost as things age and the model assumes a 10% depreciation per year; the 10% value comes from observations of rates of depreciation across the global economy in the past. The investment part is calculated as follows:
Investment = Savings Rate x (GDP - Abatement Costs – Climate Damages)
The savings rate is 18.5% per year (again based on observations). The GDP is the total economic output for each year, which depends on the global population, a productivity factor, and Global Capital.
Abatement Costs
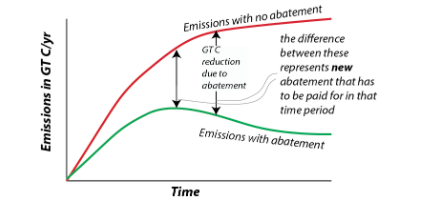
The Abatement Costs are the costs of reducing carbon emissions and are directly related to the amount by which we reduce carbon emissions. If we take steps to reduce our carbon emissions either by switching to renewable energy or improving efficiency or by direct removal of CO2 from the atmosphere, then there are costs associated with these steps. The model includes something called the abatement cost per GT C — this is the cost in trillions of dollars for each gigaton of carbon removed, and it can be changed over time. The default value is $3 trillion/GT C, which is a lot because it also includes the costs of large battery systems and new electrical transmission lines. But, the good thing about these costs is that once you pay for a GT of C removed, you don’t keep paying for it. If we were to completely cut all carbon emissions (currently around 10 GT C/yr) and do it in one year, it would cost $30 trillion or about 1/3 of the global GDP.
The diagram below shows how the abatement costs each year are figured out.
Climate Damages
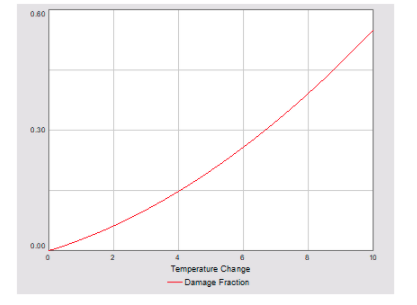
Climate Damages are the costs associated with rising global temperatures, including the costs of dealing with sea level change along coasts, extreme weather events (hurricanes, flooding, droughts, wildfires, etc.), labor (reduced productivity at higher temps), and increased human mortality (loss of workers hurts the economy). In the model, the climate damages are calculated as a fraction (think of this as a percentage) of the GDP. The fraction is a quadratic equation that looks like this:
damage fraction = slope × ΔT + coefficient × ΔTexponent
The ΔT is the global temperature change in °C. Both the slope and exponent can be adjusted in the model; the coefficient is set at 0.003. The default slope is 0.025 and the exponent is 2, which means that if we have a global temperature change of 4°C, damages equal to 15% of GDP; this rises to a devastating 55% for a temperature increase of 10°C. The diagram below shows what this damage fraction equation looks like, plotted as a function of temperature change in °C.
Relative Climate Costs
It will be useful to have a way of comparing the climate costs — the sum of the Abatement Costs and the Climate Damages — in a relative sense so that we see what the percentage of these costs is relative to the GDP of the economy. The model includes this relative measure of the climate costs (in trillions of dollars) as follows:
Relative Climate Costs = (Abatement Costs + Climate Damages) x GDP/initial GDP
Consumption
Consumption
Also related to the Global Capital reservoir is a converter called Consumption. A central premise of most economic models is that consumption is good and more consumption is great. This sounds shallow, but it makes more sense if you realize that consumption can mean more than just using things it up; in this context, it can mean spending money on goods and services, and since services include things like education, health care, infrastructure development, and basic research, you can see how more consumption of this kind can be equated with a better quality of life. So, perhaps it helps to think of consumption, or better, consumption per capita, as being one way to measure quality of life in the economic model, which provides a measure for the total value of consumed goods and services (in trillions of dollars), which is defined as follows:
Consumption = Gross Output – Climate Damages – Abatement Costs – Investment
This is essentially what remains of the GDP after accounting for the damages related to climate change, abatement costs, and investment.
The model also calculates the per capita consumption by just dividing the Consumption by the Population, and it also includes a converter called relative per capita consumption, which is just the per capita consumption divided by the GDP. In the model, this is in thousands of dollars per person.
Population & Productivity Factor
Population & Productivity Factor
Population
The population in this model is highly constrained — it is not free to vary according to other parameters in the model. Instead, it starts at 6.5 billion people in the year 2000 and grows according to a net growth rate that steadily declines until it reaches 12 billion, at which point the population stabilizes. The declining rate of growth means that as time goes on, the rate of growth decreases, so we approach 12 billion very gradually.
Productivity Factor
The model assumes that our economic productivity will increase due to technological improvements, but the rate of increase will decrease (but will not go negative), just like the rate of population growth. So the productivity keeps increasing, but it does not accelerate, which would lead to exponential growth in productivity. This decline in the rate of technological advances is once again something that is based on observations from the past.
Emissions
Emissions
The model calculates the carbon emissions as a function of the GDP of the global economy and two adjustable parameters, one of which (carbon intensity) sets the emissions per dollar value of the GDP (units are in gigatons of carbon per trillion dollars of GDP) and something called the Emissions Control Rate (ECR). The equation is simply:
Emissions = carbon intensity*(1 -ECR)*GDP ;
Currently, carbon intensity has a value of about 0.118, and the model assumes that this will decrease as time goes on due to improvements in the efficiency of our economy — we will use less carbon to generate a dollar’s worth of goods and services in the future, reflecting what has happened in the recent past. The ECR can vary from 0 to 1, with 0 reflecting a policy of doing nothing with respect to reducing emissions, and 1 reflecting a policy where we do the maximum possible. Note that when ECR = 1, then the whole Emissions equation above gives a result of 0 — that is, no human emissions of carbon to the atmosphere from the burning of fossil fuels. In our model, the ECR is initially set to 0.005, but it can be altered as a graphical function of time to represent different policy scenarios. In other words, by changing this graph, we are effectively making a policy — and everyone follows this policy in our model world!
Making Comparisons — the Discount Rate
Making Comparisons — the Discount Rate
We would like to be able to see whether one policy for reducing emissions of carbon is economically better than another. Different policies will call for different histories of reductions, and to compare them, we need to find a way to compare the expected future damages associated with each policy. A problem comes when we try to compare 200 million in damages at some time in the future vs. 20 million in damages today. Economists use something called a discount rate to do this. Here is an example to help you see how this idea works: imagine you have a pig farm with 100 pigs, and the pigs increase at 5% per year by natural means. If you do nothing but sit back and watch the pigs do their thing, you’d have 105 pigs next year. So 105 pigs next year can be equated to 100 pigs in the present, with a 5% discount rate. Thus, the discount rate is kind of like the return on investment. Now think about climate damages. If we assume that there is a 4% discount rate, then $1092 million in damages 100 years from now is $20 million in present-day terms. Here is how this works in an equation:This is a standard exponential growth equation is called Euler’s number and has a value of about 2.7. Now, let’s say we calculate some cost in the future — 8 million dollars 200 years from now — we can apply a discount rate to this future cost in order to put it into today’s context. Here is how that would look:
It is important to remember that this assumes our global economy will grow at a 4% annual rate for the next 200 years. The 4% figure is the estimated long-term market return on capital, but this may very well grow smaller in the future, as it does in our model. Although we’re not going to dwell on the discount rate any more in this exercise, it is good to understand the basic concept.
A simpler way of comparing future costs or benefits with respect to the present is to express these costs and benefits relative to the size of the economy at any one time — which our model will calculate. This gets around the kind of shaky assumption that the economy is going to grow at some fixed rate. These relative economic measures are easy to do — just divide some parameter from the model, like the per capita consumption, by the GDP. Below is a list of the model parameters that we will keep an eye on in the following experiments:
Below is a list of the model parameters that we will keep an eye on in the following experiments:
Global capital — the size of the global economy in trillions of dollars;
GDP — the yearly global economic production in trillions of dollars
Per capita consumption — consumption/population; this is a good indicator of the quality of life — the higher it is, the better off we all are; units are in thousands of dollars per person
Relative per capita consumption — annual per capita consumption x (GDP/initial GDP); again, a good indicator of the quality of life, in a form that enables comparison across different times; units are in thousands of starting time dollars per person
Sum of relative pc consumption — the sum of the above— kind of like the final grade on quality of life. If you take the ending sum and divide by 200 yrs, it gives the average per capita consumption for the whole period of the model run.
Relative climate costs — an annual measure of (abatement costs + climate damages) x (GDP/initial GDP); this combines the costs of reducing emissions with the climate damages, in a form that can be compared across different times; the units are trillions of dollars.
Sum of relative climate costs — sum of the relative climate costs — the final grade on costs related to dealing with emissions reductions (abatement) and climate; this is the sum of a bunch of fractions, so it is still dimensionless.
Global temp change — in °C, from the climate model
Experiment 1
Experiment 1 - Changing the Emissions Control Rate (ECR)
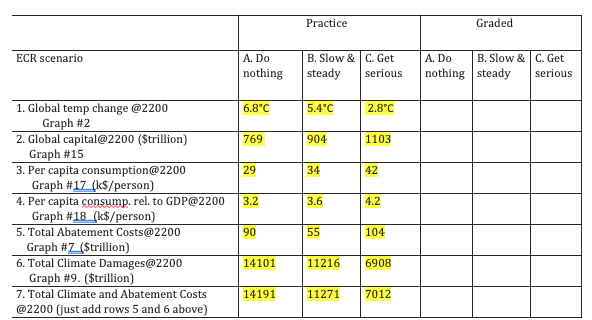
In the model [7], the ECR can vary from 0 to 1, and it expresses the degree to which we take steps to curb emissions; a value of 0 means we do nothing, while a value of 1 means that we essentially bring carbon emissions to a halt. According to Nordhaus, the most efficient way of implementing this control is through some kind of carbon tax, in which case a value close to 1 represents a very hefty carbon tax that would provide strong incentives to develop other forms of energy. In this experiment, we’ll explore 3 scenarios — in A, we’ll keep ECR at a very low level — this is the “do nothing” policy scenario, in B we'll ramp it up steadily through time — this is the “slow and steady” policy scenario, and in C, we’ll ramp it much more quickly, eventually reaching a value of 1.0 — this is the “get serious” policy scenario. You can make these changes in the ECR by altering the graphical converter.
The three different scenarios consist of 5 numbers that are the ECR values for 5 points in time (corresponding to the five vertical lines in the graph); these times are the years 2000, 2050, 2100, 2150, and 2200. There are 2 videos to watch in Module 10 Summative Assessment— the Model Introduction, which gives you an overview of the model and ECR Scenarios which explains how to modify the model to do these problems.
| 1. Do nothing | 2. Slow and Steady | 3. Get Serious | |
|---|---|---|---|
| Practice | Use defaults values (no need to change anything) | 0.005; 0.15; 0.3; 0.45; 0.6 (see video about adjusting these) |
0.005; 0.33; .66; 1.0; 1.0 |
| Graded | Use defaults values (no need to change anything) | 0.005; 0.2; 0.4; 0.6; 0.8 | 0.005; 0.5; 1.0; 1.0;1.0 |
For each scenario, run the model, study the model results, and record the results indicated in the table below and then refer to your results in answering the questions below.
This short video below explains how to make changes to the model. Please take a few minutes to watch the ECR Scenarios video. You will be happy you did later!
Video: ECR Scenarios (5:45)
For this summative assessment, we're basically going to do three different runs with this model. Each one will have a different history of the emissions control rate. So when you open the model up, just reset everything first. The reset button clears everything. Then we're gonna run it with the default values. So for the practice version we use the default values, we're not gonna change anything, we're just gonna run it. We run it and see what happens. Here you can see in red the temperature rising and it gets up to about six point eight degrees Celsius warming. In blue is the carbon emissions that rises and it reaches a peak of about thirty-one gigatonnes of carbon. And then it starts to decrease and then it just sort of ;falls off a cliff right here. It falls off a cliff right there because we actually would run out of fossil fuels at that point. And if you click ahead a few graphs, you can see...there's the emissions. Sorry, go back one. This graph shows the fossil fuels remaining. That drops to zero at this point, so we've totally run out of fossil fuels at that point. So that's a scenario number one. That's they do-nothing scenario.
The next scenario B is called the slow and steady one. And if you look over here in this table, there are some numbers that tell us the values of this emissions control rate at different points in time. So here's what you do. You click on the emissions control right here. You click on table and then these Y values here, ;the numbers that are reflected over here. So .005 point is already there. Now we're gonna put in 0.15, and then 0.3, and then 0.45, and then finally 0.60, and hit okay. And now we see we have a nice slow steady increase in the emissions control rate. That means as time goes on we're gonna kind of slowly do more and more in terms of reducing carbon emissions. That's all we have to change and then we run the model and you see that that results in a somewhat lower global temperature change. Still rises to 5.45 degrees C which is a pretty serious warming by the year 2200.
Now, will it will do one more scenario. This is the get-serious scenario and the values here according to the table are .33, .66, and then 1.0. Now when this has a value one, that effectively means we're going all out, we're going to do whatever it takes to eliminate all carbon emissions. And so we set that up and you can see here it tops out and stays at one there. We run that scenario and sure enough the temperature changes quite a bit less. We have 2.8 degrees of temperature change by the end of time. And you know if you look at the carbon emissions, let's see if you go to this one here, this is all three runs carbon emissions. So the third one would get serious. The carbon emissions they actually drop to zero by the time we get to the year 2152. And they stay at zero at that point.
So then, you've done these three runs. On a number of these graphs, the different curves are presented...run one, run two, run three. So run one would be the do-nothing scenario, run two would be the slow and steady scenario, and run three would be the get-serious scenario. And so there are a whole bunch of different graphs here. Everything is plotted. Here, by the way, these are the total abatement costs. And you can see in the first run the abatement costs are essentially zero all the way along. And then the abatement costs get very big once we've run out of fossil fuels. We have to make up for that with renewable energy and so that's going to be associated with some significant cost. The abatement costs rise up dramatically there and then level off as time goes on.
So then, in this worksheet, you see there are a whole bunch of questions to answer. What is the global temperature change at the year 2200 for a scenario A, ;B, and C? And these are the answers that you could get off of these graphs. Graph number 2, graph number 15, 17, 18, 7, 9, and so on. from doing these three scenarios and then toggling back and forth between these graphs, running your cursor along here until you get to the year 2200, and then recording the values, and filling them in in this table. So, if you fill in this part of the table with those values, then you can use these numbers to help you answer the various questions that go along with this experiment.
If you haven't already run the model for this experiment, run the Model now! [8]
For each scenario, study the model results, and record the results indicated in the table below and then refer to your results in answering the questions below.
| Items | Do nothing | Slow and Steady | Get Serious |
|---|---|---|---|
| 1. Global temp change @ 2200 | |||
| 2. Global capital @ 2200 | |||
| 3. Per capita consumption @ 2200 | |||
| 4. Relative per capita consumption @ 2200 | |||
| 5. Sum of relative per capita consumption @ 2200 | |||
| 6. Relative climate costs @ 2200 | |||
| 7. Sum of relative climate costs @ 2200 |
Questions
1. Which of these 3 scenarios leads to the lowest global temperature change?
- Do nothing
- Slow and steady
- Get serious
2. For answer to #1, global temp change @2200 = ____________ (±0.5°C)
3. Which of these 3 scenarios leads to the highest global capital?
- Do nothing
- Slow and steady
- Get serious
4. For answer to #2, global capital @2200 = ____________ (trillion$ ±50)
5. Which of these 3 scenarios leads to the lowest relative climate costs?
- Do nothing
- Slow and steady
- Get serious
6. For answer to #5, relative climate costs @2200 = _______________ (±0.5)
7. Which of these 3 scenarios leads to the greatest relative per capita consumption?
- Do nothing
- Slow and steady
- Get serious
8. In terms of both economic costs (lowest relative climate costs) and benefits (highest relative per capita consumption), which scenario is the best?
- Do nothing — best in both costs and benefits
- Slow and steady — best in both costs and benefits
- Get serious — best in both costs and benefits
- Do nothing — best in benefits; Get serious — best in costs
- Slow and steady — best in benefits; Do nothing — best in costs
Now we step back and consider what we’ve done and learned by responding to the following questions.
9. You have probably heard people (mainly from the realms of business and politics) say that we should not do anything about global climate change because it is too expensive and will hurt our economy. After experimenting with this model, do you agree with them, or do you think they are missing something (and if so, what is it they are missing)?
10. Remember that each ECR history reflects a different economic/political policy. Briefly explain how you came to figure out which policy was the best. In answering this, you have to think about what “best” means — the least environmental damage; the greatest economic gain per person; the easiest policy to implement; or some combination of these?
Summary and Final Tasks
Summary
The part of economics dealing with climate change goes much deeper than we have covered here. If you are interested, check out some of the references in this module. But, you should now have a working sketch of many of the main results.
Because the climate changes driven by the CO2 from our fossil fuels will make life harder for people in the future, as well as for at least some people now, there is a social cost of emitting carbon dioxide to the atmosphere. This cost can be understood by first discounting the future damages to their present value. But, if we spend money to reduce CO2 emissions and thus lower the damages from climate change, we are not spending money on consumption today, or on other investments for the future.
By using integrated assessment models, economists can compare the economic costs and benefits of different possible divisions of money among consumption, investment in the broad economy, and investment in reducing climate change. The optimal path is almost always found to involve doing some of all of those. Thus, rather surprisingly to some people, hard-nosed economics motivates serious responses to climate change, beginning as soon as possible. Typically, this response involves small actions now, increasing over the next decades, and relying on consistency in policies.
Because some of the damages of climate change are not yet accounted for quantitatively in these studies, they probably underestimate the size and speed of the optimal response. Similarly, if future economic growth is going to be more limited by the finite nature of the planet than assumed in the models, or by other issues, or if current calculations are overestimating the good that comes from increasing economic activity, then it is likely that more action to limit climate change would be recommended now. On the other hand, if future economic growth is faster than expected, or if we are underestimating the good from increasing economic activity, less action would be recommended now to reduce climate change. However, the balance of the literature seems to suggest overall that following the optimal path from the models or doing a little more now to reduce climate change is the economically best path.
Reminder - Complete all of the Module 10 tasks!
You have reached the end of Module 10! Double-check the to-do list in the Module Roadmap to make sure you have completed all of the activities listed there before you begin Module 11.
References and Further Reading
Enrichments
Discount Rate
Discount Rate
The discount rate is often approximated as the real rate of return on capital, R, along an optimal path. This is given by the Ramsey equation, which in turn is made up of three parts.
The first is the growth rate of consumption per person in the economy, Ġ.
The second is the elasticity of the marginal utility of consumption, S. The marginal utility of consumption is how much good you get from consuming something, and its elasticity here is taken as how this good changes as you consume more. Wealthy people get less good from the next dollar than poor people do, but how much less? If we think that the good decreases rapidly as people get richer, and we don't want to help rich people in the future who won't appreciate the help, then we have a large discount rate and tend to help ourselves rather than them by spending on us rather than investing for them.
The third part of the discount rate is the pure rate of time preference, E. This is related to our observed tendency to choose to have something, such as an apple, or an Apple, now rather than in the future.
The Ramsey equation puts these together to give the real rate of return on capital as R=E+ĠS. And, economists often set this as being equal to the discount rate.
Interesting Discounts
Interesting Discounts
In the example in the text, 1000 dollars this year becomes 1040 dollars next year after the bank adds the interest. You can say that the present value is P, the future value F, the interest i=F-P, and the interest rate r=i/P=(F-P)/P. The discount rate is d=(F-P)/F. A little algebra will show you that d=r/(1+r) and r=d/(1-d). Here r and d are in the decimal forms (0.04, not 4%). In the main text, we will use D=100d for the discount rate in percent. The economic models eventually assume a discount rate, such as 4%, but often you will see calculations made with 3% and 5%, and sometimes 1% and 7%, because the discount rate is quite uncertain. This uncertainty in the discount rate is much larger than the difference between the interest and discount rates, so using either one will get you close.
The example in the text used an interest rate of 0.04, which gives d=0.04/(1+0.04)=0.03846. . . , which looks messy. But, we could have taken d=0.04, which would have given r=0.04/(1-0.04)=0.041666. . ., which makes the interest rate look messy. Your bank may indeed advertise interest rates such as '4.17%!!!'
Inflation is the tendency for all prices and wages to rise in an economy. Measuring inflation is not a trivial task, but useful estimates are available for the inflation rate at different times in different places. Mathematically, it is not difficult to remove the effects of inflation - if everything goes up together, we can correct everything together, reducing the values back to what they would have been at some chosen time (or inflating them to what they will be at some other chosen time). When effects of inflation have been removed from a calculation, you may see costs and benefits referred to in 'constant dollars' or '2005 dollars' or '(some other specific year) dollars' in a government report on decision-making about energy.
Uncertainty Lowers the Discount Rate
Uncertainty Lowers the Discount Rate
This module has covered the techniques for calculating the present value of future events. But, how uncertainty shows up in this is possibly surprising.
Suppose you estimate that damages of $1000 will occur in 100 years, and you want to estimate their present value as properly as possible. But, you aren’t sure whether the discount rate is D=1% or D=7%—you think that 1% and 7% are equally likely to be correct. You decide to split the difference, by assuming that the average of the present values of these cases is your best estimate of the present value.
You recall that earlier in this module we found that P=F/(1+d)t, allowing you to calculate the present value P from the future value F=1000 for time t=100 using the discount rate d=D/100.
You might be tempted to assume that the answer can be obtained by averaging 1% and 7% to get 4% and then calculating P for this discount rate of 4%. You would be wrong.
If you got out your calculator, you would find
For D=7%, P=1.15
For D=4%, P=19.80
For D=1%, P=369.71
You want the average of the present values for the 1% and 7% cases, which is (369.71+1.15)/2=185.43. That is almost 10 times larger than the value P=19.80 you get for a 4% discount rate.
What happened? For sufficiently high discount rate and sufficiently long time, the present value of any future event is very small, and you can’t lower a small value very much more by using a higher discount rate or longer time. Under those conditions, the average of the present values with an uncertain discount rate is not too far from being half of the present value, with the lower discount rate.
You could put the average present value, 185.43, into the equation above and solve for the discount rate that would give it. The result is D=1.7%, far below the 4% you would get by averaging 1% and 7%.
If you then decided to look at the present value of damages of 1000 occurring 200 years in the future rather than 100 years, you would find
D=7%, P=0.001 (that’s one-tenth of a cent)
D=4%, P=0.39 (that’s 39 cents)
D=1%, P=137.69
The average of 137.69 and 0.001 is 68.85, almost exactly half of the low-discount case. And if you calculate the one discount rate that would give this, it is 1.3%, even lower than the 1.7% for 100 years.
So, if you want to use a single number for the discount rate, but you know that there really is uncertainty about what that number should be, the single number is lower than the average of the possible discount rates, and the single number gets smaller as you look further into the future. In turn, our lack of knowledge about the future means that an economically efficient response involves more actions now to prevent global warming than you would calculate by simply taking a discount rate in the middle of the possible values.
For additional insights on why the discount rate should be made smaller when looking further into the future, motivating more action now to reduce global warming, see K. Arrow et al., 2013, Determining benefits and costs for future generations, Science 341, 349-350. (Note that in the Newell and Pizer paper referenced in the main text, and in this Arrow paper, time is made continuous and discounting is exponential; their equation looks different from ours, but the numerical difference from what we did here with annual values is very small—for example, Newell and Pizer get 34 cents rather than 39 cents for the present value of 4% discounting of 1000 in damages 200 years in the future.)
Module 11: Policy Options
Overview
Strong science and economics give us high confidence that reducing greenhouse gases can be a sound investment. If we use the knowledge efficiently as we make decisions, we will be economically better off. But, we’re a little like a worker with an illness related to their job—the job brings great good as well as bad, and the same is true of fossil fuels.
If you go to a doctor with an illness, the doctor has lots of options. She may give you medicines that cure the disease, or others that lessen the symptoms. She may help you learn coping strategies to reduce the problems, and other actions to prevent additional illnesses or treat other difficulties that are making this illness worse.
In the same way, we can think about “curing” the global-warming problem by switching to other fuels that don’t raise the Earth’s temperature, or by putting CO2 back in the ground; such actions to reduce or eliminate the warming are often called mitigation. Or, we can look for ways to cope with the coming climate changes, by breeding heat-resistant crops, building walls against the rising sea or moving out of the way, and otherwise engaging in adaptation as the changes happen. We even can try to cover up the symptoms, using geoengineering to block the sun. And, we can encourage research, education and innovation to help make the transition.
How do we really do any of these? What decisions need to be made? What other issues are involved? Let’s go policy-wonking!
Goals and Objectives
Goals:
- Recognize the role of human actions in determining the future of our climate, except that by avoiding climate change, the shift will make the economy better and thus increase employment
- Explain scientific concepts in language non-scientists can understand
- Find reliable sources of information on the internet
Learning Outcomes
By the end of this module, you should be able to:
- Recognize the multitude of policy options available for our energy system and economy
- Explain how the effectiveness of emissions treaties and carbon taxes can be verified internationally using remote data collection
- Recognize that shifting gradually to renewable energy is likely to have little overall impact on employment rates
- Recall that energy policies and subsidies have been in use for decades, and some of these have promoted fossil fuels over renewable resources
- Research and evaluate an example of an energy subsidy reported by the IMF
Roadmap
| To Read | Materials on the course website (Module 11). | |
|---|---|---|
| To Do | DiscussionPost [9] Discussion Comment [9] Quiz 11 |
Due Wednesday Due Sunday Due Sunday |
Questions?
If you prefer to use email:
If you have any questions, please email your faculty member through your campus CMS (Canvas/Moodle/myShip). We will check daily to respond. If your question is one that is relevant to the entire class, we may respond to the entire class rather than individually.
If you have any questions, please post them to Help Discussion. We will check that discussion forum daily to respond. While you are there, feel free to post your own responses if you, too, are able to help out a classmate.
Policy Options and Regulations
Policy Options and Regulations
Short Version:
A huge range of policy options is available, and many regulations likely would be required to implement some of them. Or, a price on carbon, such as a carbon tax, could be used to get the whole economy working on the problem. If paired with a tax swap to reduce more-intrusive taxes, this would have little impact on the economy and might cause growth, even if the benefits of avoiding global warming are ignored. International harmonization of carbon taxes could be used, with econometric and geophysical verification. Such an approach is likely to have collateral benefits through avoiding negative externalities of some fossil-fuel use, improving national security through avoided environmental problems, reducing rapid changes in energy prices, and possibly increasing employment. Current policy positions probably are serving to accelerate global warming, so a neutral stance or reduction in global warming would require policy actions. Clearly, effective responses require well-designed and implemented policies; it is possible to mess things up with poor policies.
Longer, but friendlier version:
On June 25, 2013, US President Barack Obama made a major speech introducing his administration’s Climate Action Plan [10].
The 21-page document that accompanied the speech sketched a series of policy actions proposed for the remaining years of the president’s term in office. By the time you read this, that speech will be old news. But, it is instructive even as it becomes history because despite the sheer number of proposals, and their great breadth and depth, this plan did not even mention the most commonly discussed policy option.
Consider some of the proposals. (Many of the words that follow are directly from the Plan, but some are paraphrased.) Don’t try to learn or memorize these; just notice how many there are:
Cut Carbon Pollution in America by:
- Completing carbon-pollution standards for new and existing power plants;
- Promoting renewable energy, including accelerating clean energy permitting, developing hydroelectric power at existing dams, deploying renewable energy through the Department of Defense, increasing federally installed renewable energy, and expanding and modernizing the electric grid, including streamlining transmission projects;
- Unlocking long-term investment in clean energy innovation, including increasing funding for areas ranging from advanced biofuels to emerging nuclear technologies such as modular reactors to clean coal, guaranteeing loans for projects to avoid, reduce or sequester human-produced greenhouse gases, and instituting a Federal Quadrennial Energy Review to assess and guide actions;
- Advancing transportation, including fuel-economy standards for heavy-duty trucks, buses, and vans, improving biofuels, and leveraging public-private partnerships to deploy cleaner fuels such as advanced batteries and fuel cell technologies;
- Reducing energy bills by increasing energy efficiency standards, reducing barriers to investment in energy efficiency by financing efficiency investments in rural America, and developing a new fund to allow testing of novel approaches to cost-effective residential electricity, and expanding programs for better buildings;
- Reducing emissions of other greenhouse gases, including various programs to curb emissions of hydrofluorocarbons and methane, and preserving forests;
- Providing federal leadership, including consumption of clean energy and energy efficiency, with initiatives such as (quoting from the bottom of p. 11 in the plan)
In the report, these proposals to cut carbon pollution were followed by proposals to Prepare the United States for the Impacts of Climate Change, and to Lead International Efforts to Address Global Climate Change, with similar detail.
Many people provided opinions about the plan in the days after it was released, but among those experts who favored policy actions to address climate change, there was widespread acceptance that these proposals were serious and moving in a useful direction. Standard contracts, synchronized building codes, and access to capital markets for investments are indeed important, as are many more policy options.
But recognize that 21 pages of this sort of text were needed just to sketch a suite of policy responses—the rules and regulations were not in the document, just statements committing the administration to working on those rules and regulations. And, this is just one level of government in just one country in a very big world. Furthermore, a price on carbon emissions was not even discussed (see below).
So, if you expect a truly comprehensive discussion of policy options in this chapter, you will be disappointed. The energy system is so huge and pervasive in our lives, and so strongly linked to release of CO2, that almost everything we do, publicly or in private, can be changed to influence global warming.
Instead, we’ll look at a few of the most frequently discussed options. We’ll also look at additional motivations, and effects of policy actions.
Dr. Alley, your tour guide here, is a geologist by training, and a recognized expert on some aspects of glaciers and ice sheets. This does NOT make him a policy expert. Furthermore, a lot of what follows could be misinterpreted as an endorsement of some particular policy or policies. So, let’s get it out in the open right now: We are NOT endorsing any particular policy here. It is up to you to make up your own mind. We do hope that the evidence and reasoning presented here will help you with this. We are NOT telling you how to vote about issues such as synchronized building codes to reduce carbon pollution. But, we are trying to show you what the best understanding says about motivations and options for this often-contentious and very important topic. And again, because the topic is so vast, we will hit only a few of the high points.
Tax and What?
Tax and What?
Outlaw Dumping of Carbon Dioxide
Outlaw Dumping of Carbon Dioxide
One possible policy approach to global warming is to outlaw dumping of CO2 into the air where it affects neighbors, just as we outlaw dumping human waste onto a neighbor’s lawn. This is not a favored policy approach for now; Dr. Alley knows of no serious proposals to outlaw most CO2 emissions in the short term. However, some of the proposals in President Obama’s plan involve laws or regulations that reduce emissions, through actions such as requiring that trucks travel more miles per gallon of diesel fuel, or that power plants emit less CO2 per kilowatt-hour of electric generation. In some sense, this is outlawing a small fraction of CO2 emissions.
Economists generally recognize the utility of at least some regulations, such as those prohibiting dumping of human waste on a neighbor’s lawn. (Although, the British publication The Economist editorialized against sewers in 1848, as reported by S. Halliday in The Great Stink of London, 1999.) But, there is fairly broad support among economists for using “price signals” instead of regulations where practicable.
Cap and Trade
For example, instead of outlawing CO2 emissions, governments could set a limit on how much CO2 could be emitted, and sell or give away permits to emit that much CO2. Then, the people holding those permits could actually emit that CO2, or sell (trade) those permits to other people who wanted to emit the CO2. This process is often called cap and trade. By reducing the permitted emissions over time, or raising the price of the permits, total emissions could be reduced.
At any time, the trading of permits allows the economy to reduce emissions at the lowest possible price. If CO2 is reduced by regulations rather than price signals, those regulations might be written with an eye toward political expediency rather than economic optimization, and so might end up cutting emissions in rather expensive ways. By letting markets achieve the reductions, more-efficient ways are likely to be found. At the time of this writing, cap and trade was being used in Europe to address CO2, in the US to reduce acid rain, and in other ways around the globe. Some danger typically exists that political considerations will cause caps to be set so high that there is little practical effect of the policies. However, with appropriately set caps and sufficiently well-regulated and monitored markets and emissions, this approach can work, and has done so in some cases.
In the broadest sense, cap-and-trade with permits sold by the government is a complex way to levy a tax on CO2 emissions. In part because of the complexity, many economists argue that it would be much more efficient to just tax CO2 emissions directly.
A Highly Relevant Detour
A Highly Relevant Detour
Now, a bit of a highly relevant detour. Governments levy taxes to raise funds so the governments can function, but those taxes always have impacts in addition to the fund-raising. In the United States, governments tax tobacco to raise money and reduce smoking. Governments tax alcohol to raise money and reduce drinking. And, governments tax the wages of workers to raise money… and reduce working?
Reducing the value of work does reduce working. For example, suppose Dr. Alley has $100 to get help with some task. Compare two options: he offers some students $100 to help, or, he offers the students $50 to help, and the government gets the other $50. Which is more likely to convince the students to change their plans and go help Dr. Alley? The answer should be clear.
Just as taxing tobacco, alcohol and wages tends to reduce smoking, drinking and working, respectively, taxing our fossil fuels would reduce their use, as well as promoting substitutes that now are more expensive than the fossil fuels. And, because energy use powers the economy, this would reduce economic activity unless certain other actions were taken.
If a tax (or a cap-and-trade program) were developed to reduce CO2 emissions, the economic impacts would depend hugely on what was done with the money raised. Some political campaigns in the US recently featured advertisements using numbers assuming that money collected from a cap-and-trade system was then run through a shredder, disappearing completely from the economy. This makes the cap-and-trade program sound very expensive, which may be politically useful. But, in our experience, governments that get money tend to spend it rather than shredding it.
Tax Swap
Tax Swap
Probably the most frequently discussed policy option is to place a tax on carbon emissions, and use the money in a “tax swap” to reduce the tax on wages, or to reduce other taxes that especially reduce economic growth. (Other options include giving the money back to people directly, or using the money to stimulate research—the funds would be available for anything that money can be spent on.) In 2013, the US Congressional Budget Office summarized available research showing that if we ignore all of the benefits of reducing fossil-fuel emissions and avoiding global warming, a properly designed tax swap would have little impact on the economy as a whole—it might slow growth a little, or speed growth a little, but without too much change (Effects of a Carbon Tax on the Economy and the Environment, 2013 [11]). Earlier, the US EPA had conducted a similar study and found a slightly overall increase in household consumption over the next 30 years in response to a price on carbon—a stronger economy from putting a price on carbon emissions and using the money to reduce the tax on work. (U.S. Environmental Protection Agency, Office of Atmospheric Programs, 2009, Revenue recycling to reduce labor taxes, in Supplemental EPA Analysis of the American Clean Energy and Security Act of 2009 [12]H.R. 2454 in the 111th Congress, p. 23, scenario 16.) You might think of this as arising from the fact that replacing fossil fuels is difficult, and taxing fossil fuels causes inefficiency in the economy, but replacing workers is about as difficult and perhaps even more difficult, and taxing their wages causes about as much and may be even more inefficiency in the economy.
Such studies also show that it is possible for governments to raise taxes on carbon and then use the resulting money in ways that are not as helpful to the economy so that the carbon tax really does reduce economic growth significantly. (The worst example of this might be taking the money and shredding it!) But, used appropriately, there is little economic cost and possibly economic gain from a carbon tax even if you ignore the benefits of reducing CO2 emissions. And, as noted in the previous chapter, a cost on carbon emissions is strongly justified if the costs of global warming are included.
One objection to a carbon tax, even if implemented efficiently with a tax swap, is that it takes relatively more money from poor people than from the wealthy; such a policy is often called regressive. In contrast, income taxes tend to be designed in a progressive manner, so that wealthier people pay relatively more. However, other policies can be designed to address such issues if they are deemed important.
In his 2008 book, A Question of Balance, the Yale economist William Nordhaus (we met him in Module 10) devoted a whole chapter to “The many advantages of carbon taxes”. Three days after the Obama administration’s 21-page sketch of policy actions, economist Henry Jacoby of MIT told National Public Radio’s David Kestenbaum (Morning Edition, June 28, 2013) that economists could solve the problem with a one-page bill. Kestenbaum’s analysis in the interview says “This is why economists love a carbon tax: One change to the tax code and the entire economy shifts to reduce carbon emissions. If you do it right, a carbon tax can be nearly painless for the economy as a whole.” (And, again, this ignores the benefits of reducing global warming, which make the carbon tax more favorable.)
Impact on Coal Miners
Impact on Coal Miners
A carbon tax (or cap and trade, or regulations, or any other serious attempt to reduce CO2 emissions, probably including carbon capture and sequestration) is likely to have unfavorable impacts on some groups, and favorable impacts on others. In particular, coal miners are likely to lose. One of the short-term responses to reductions in greenhouse gases is likely to be a switch to natural gas for generating electricity—gas emits about half as much CO2 as coal for a given amount of electric generation, and the greater ability of gas turbines than coal-fired boilers to change their output quickly means that more renewables can be used easily in an energy system that has more gas-fired and less coal-fired generation.
Video: Coal Miner (1:33)
PRESENTER: This photograph, from the US Library of Congress, shows a coal miner from 1942 from the Pittsburgh, Pennsylvania area, the Montour Number 4 mine of the Pittsburgh Coal Company. We don't even know the miner's name. We do know that a lot of miners have done very difficult jobs to help their families, to help their communities, to help their countries. No one likes going around firing coal miners.
Coal, right now, is under a lot of pressure. Some of it does come from government regulations. Probably, more of it is coming from natural gas being cheaper, although you'll find an argument on that.
The economically optimal path for dealing with CO2 involves starting very slowly to deal with the problem, and making changes over decades, with the idea, in part, that coal miners, who made honest decisions to be coal miners, will retire in their jobs, coal investors will get their money back, but future generations will do something else. If we ignore the science and the economics, for now, we let another generation coal miners get started, then the economically optimal path will involve much faster changes, with a greater likelihood of firing coal miners. So in some sense, if you really hate the idea of firing coal miners, you want to put our knowledge into the decision-making now.
There is a fascinating issue here, which overlaps with ethics in the next module. The economically efficient path puts a small price on carbon now, and then raises that price slowly but steadily, by perhaps 2-4% per year, so that in a few decades the price becomes high. A person who already decided to be a coal miner, obtaining the education, mortgage, and other things that go with that choice, has a good chance on the economically optimal path to retire as a coal miner, with future generations doing something else (or else with future generations mining coal and then capturing and sequestering the carbon). If someone invested in a coal-fired power plant, they likely will get their investment back on the optimal path.
But, the social cost of carbon is projected to climb rapidly as temperatures and damages rise. If we notably delay starting our response, so that a new generation of people become coal miners or coal-plant investors, the higher social cost of carbon in the future will mean that an optimal path starting in the future involves faster changes, which will make it much harder for those new “coal” people to complete their careers or recoup their investments. If you really are ethically opposed to the general act of firing coal miners or hurting the investors in coal plants, starting now to deal with climate change is probably better than delaying, because of the likelihood that delay now will lead to more coal miners being fired later. (The biggest danger to coal-mine jobs and investors in the US now may be the recent drop in gas prices as fracking has increased gas supply; the free market does not adopt 30-year plans to minimize impacts on coal miners. And, as noted below, the fracking boom involves commercialization of research that in significant part was paid for by the US government, so in that sense government policies have caused trouble for coal miners. Notice, though, as described in the Enrichment linked below, that even if the main danger to coal-mine jobs comes from the free-market influence of gas, the public communications may paint a very different picture.)
Want to learn more?
Read the Enrichment titled Coal Mining Jobs.
Harmonious Taxes
Harmonious Taxes
Emitting carbon dioxide has a social cost, as we saw in the previous module, so any actions to reduce emissions give some benefit. But, making a measurably significant difference in the future of global climate will require major reductions in CO2 emissions across large parts of the whole world’s economy, and really solving the problem will involve almost all of us. International cooperation thus is almost surely required to address global warming seriously.
Treaties
One possible approach is to use treaties or other agreements to limit the quantity of CO2 that can be emitted. The Kyoto Protocol to the United Nations Framework Convention on Climate Change (UNFCCC) takes this approach, setting limits on allowable emissions from many, primarily industrialized countries. The UNFCCC commits signatories (essentially the whole world) to “…stabilization of greenhouse gas concentrations in the atmosphere at a level that would prevent dangerous anthropogenic interference with the climate system” (Article 2), and Kyoto attempted to start a strategy to achieve that objective (United Nations Framework Convention on Climate Change, Background on the UNFCCC. [14])
Kyoto can claim some successes among countries in reducing greenhouse-gas emissions. Overall, however, emissions have risen since the protocol was enacted. One could argue that the task is so difficult that we should not expect immediate success, but one could also argue that this approach is not working as well as it should.
Internationally Harmonized Carbon Taxes
Another possible approach is through internationally harmonized carbon taxes. (Again, we are leaning on the work of W. Nordhaus, among many others.) As this was being written, carbon taxes were functioning in many places including British Columbia and several European countries, and discussions were ongoing in additional countries including China. Suppose that the international community broadened this participation by negotiating use of a carbon tax in all countries. The tax rate might be targeted at the economically efficient level, possibly with variations in when it became fully active based on the status of economic development or other issues. Monitoring and enforcement would involve some discussions, as would issues of what in detail to include. For example, deforestation does contribute to global warming, so are trees included? Where Dr. Alley lives, in Pennsylvania in the USA, trees were cut down in previous centuries, and many trees have been growing back—is it right for Pennsylvania to get credit for regrowing trees when other countries are penalized for cutting down their trees?
But, start with the simplest possible model: a tax on the extraction of fossil fuels, set at an initially small level for everyone and then raised at a rate such as 2% per year. Suppose that more than half of the world’s economy initially agreed to this. They could then, perhaps through the UN, offer a deal to countries not yet participating—participate, tax your own carbon, and keep the money for any purpose except stimulating fossil-fuel use; or, refuse to participate, and the participating countries will keep the funds raised from tariffs they will levy on all trade into and out of the nonparticipating countries, and set at a level equal to that for harmonized carbon taxes. (This probably would require changes to international trade rules, but changing such rules is not impossible.) Such an arrangement might turn out to be much simpler than extending the Kyoto Protocol to greatly reduce fossil-fuel emissions of CO2. Many people will have many questions about such a plan, but it is an interesting alternative that is receiving serious if cautious support.
Problems with Treaties and International Carbon Taxes
Any international treaty runs into the issue of verification—how can a nation tell whether other nations are cheating? The US National Research Council looked into that question in 2010 (Verifying Greenhouse Gas Emissions: Methods to Support International Climate Agreements), and found that verification of compliance is practicable. This would include a combination of national inventories (econometric data; who is buying what), and geophysical techniques (satellite, airborne and surface-based monitoring of atmospheric concentrations and isotopic ratios). The small variations in concentration of CO2 around the planet reveal sources and sinks of the gas, and the isotopic composition can separate biological (higher carbon-12 to carbon-13 ratio; either recently living plants or long-dead fossil fuels) from abiological (volcanic, for example) carbon, and modern-biosphere (lower carbon-12 to carbon-14 ratio) from fossil-fuel carbon. Combining the geophysical and economic data can provide a clearer picture than is available from either source by itself.
A carbon tax rising by 2% or 4% per year cannot be a solution for government funding forever because as decades become centuries, the cost per gallon would pass the cost of the car and continue onto huge values. Clearly, policies are reexamined before decades become centuries. The goal of ultimately reaching a sustainable energy system means that taxing fossil fuels cannot continue forever. But, for decades at least, harmonized carbon taxes could supply much government revenue while reducing global warming, having little direct effect on the economy, and improving the economy if the value of avoiding the global warming is considered.
Activate Your Learning
Video: CO2 Map (1:52)
PRESENTER: This figure from NASA-- from the AIRS team-- shows the concentration of CO2 in the atmosphere in May of 2013. This is after a winter of lots of fossil fuel burning in the north and lots of decaying plants and just before the plants really start growing in the spring and taking out CO2 from the air. What you see in this broad band up here is a relatively high CO2 from the fossil fuel burning and the plant decay. Whereas down here, where plants have been growing really rapidly, the CO2 is a little on the low side.
If you were to come back a few months later, these would have reversed a little bit. Now these variations are very small. 402 was the highest, 391 is the lowest. It's barely more than plus or minus 1% about the mean because there's a lot of mixing around the planet.
CO2 goes up and down with winter and summer, and CO2 goes up and with fossil fuel burning. What's useful here is that these images, plus measurements that are made on the ground, plus economic data, tell us who is burning fossil fuels and adding it to the atmosphere, as well as what's going on naturally. If we were to have a treaty that limited fossil fuel burning, it could be verified by using available data. You can't cheat on fossil fuel burning and releasing the CO2 because the CO2 is measurable in the air.
Explain how the data shown in the figure above would allow us to determine if countries are obeying emissions regulations.
Click for answer.
Policy Pile-On
Policy Pile-On
In the previous module, we looked at the basic economic analysis showing that the world’s people will be better off if the solid scholarship on energy and environment is used efficiently. And, we mentioned that if we are close to being influenced by limits to growth, then the motivation to use the scholarship is stronger. Earlier in this module, we looked at some of the ways that policies can be used to address these issues. Next, we will briefly consider a number of issues that influence policy choices, including national security and price stability.
Extinguishing Externalities:
Any energy source that supplies a significant fraction of human use is almost guaranteed to have “externalities”—unintended consequences for people and other living things. Solar farms in the desertmay shade the habitat of cacti and tortoises, wind turbines kill some birds and interrupt views, nuclear plants require long-term storage of potentially poisonous waste, fracking produces “flow-back” fluids containing possibly harmful chemicals that must be disposed of, and so on. Realistically, we have no practical hope of an energy system that doesn’t involve unintended costs and “Not in My Back Yard” (NIMBY) issues.
But, several studies have found that wind turbines are not nearly as deadly to birds as cables on radio towers, skyscrapers, cats, or the climate changes from fossil fuels that will be avoided by use of wind turbines (see Enrichment on the next page).
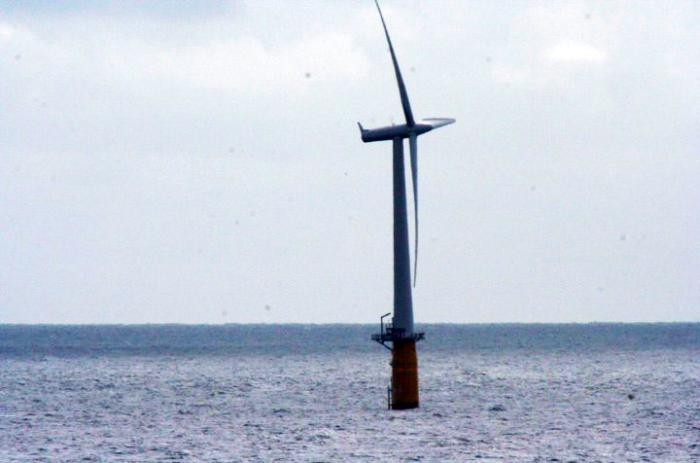
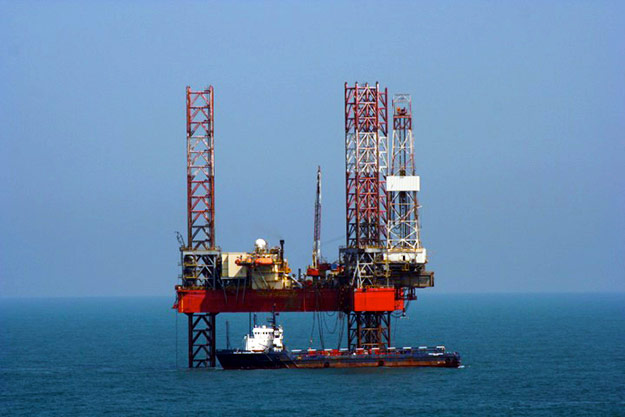
Want to learn more?
Read the Enrichment titled Living with Wind Turbines and Coal Exhaust.
In general, the externalities of renewable energy are quite low—covering thedesert with solar cells does not use the most productive landscape, and covering roofs with solar cells replaces one human-made surface with another that has essentially the same effect on neighbors, except it generates electricity.
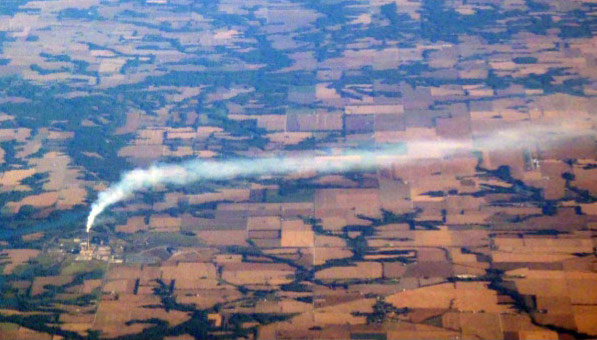
In contrast, recent scholarship shows that coal-fired electricity as currently practiced in the US and some other places (parts of China, for example) has very high negative externalities, from issues such as particles and mercury causing health problems. Some studies for the US (see Enrichment) have indicated that for each dollar spent by consumers on coal-fired electricity, society spends a similar amount, or more, in lost health and environmental quality. Hence, these studies indicate that there would be economic gains from additional regulations or other policy actions to clean up or reduce coal burning, even if the effects on climate change are ignored.
Earth: The Operators' Manual
Video: Yes in My Backyard (aka YIMBY!) (9:08)
To see how people in Denmark and Texas came to welcome the wind into their backyard, you can watch this clip. Beauty really may be in the eye of the beholder, and things that pay the beholder good money may look just a little more beautiful.
Narrator: Are there other examples of communities and nations that have begun the transition away from fossil fuels? What does it take to welcome the turbines and solar farms of the new energy system, and say, "Yes, In My Backyard." This is the story of two communities that at first look very different. Samso is a small island off the Danish mainland. West Texas is a vast, dry expanse in America's South. What both have is abundant wind. At times, Samso produces more electricity than it uses, exporting surplus power to the Danish mainland. And Texas wind now generates as much power as the next three U.S. states combined. Samso and West Texas both solved the NIMBY, not in my backyard challenge that has stymied so many renewable energy projects. It's not easy, but with patience, and persistence, and the efforts of the right people, it can be done.
Soren: Okay-- My name is Soren Hermansen, and I am the Director of the Samso Energy Academy. Samso means, in Danish, means the Meeting Island-- when you make a circle around all of Denmark, then Samso is right in the center of the circle.
Narrator: But it wasn't geography that brought Lykke Friis, then Denmark's Minister of Climate and Energy, here in mid-2011. It was why and how this community had turned NIMBY into "Yes, in my backyard."
Lykke Friis: Well, Samso is a pioneering project, in the sense that Samso, way back, decided that Samso should become independent of fossil fuels.
Narrator: Before its transformation, people thought of Samso as just a cute tourist community, busy in summer, empty and desolate in winter. Now people come here not just to see the turbines, but to understand the process that got the community to welcome wind energy. After a national competition, Samso was selected by the Danish government to be a proof of concept for how to transition from fossil fuels. But it was up to individuals like Soren Hermansen, with the passion and skills to effect change, to figure out just how.
Soren: So when we won, the normal reaction from most people was, "Yeah, you can do this project, that's OK, but just leave me out of it."
Narrator: Samso has a deep attachment to its past and values its traditional way of life.
Soren: But gradually we won their confidence in establishing easy projects to understand, and also easy projects to finance. Because basically it's all about, "What's in it for me?" Because it's not convinced idealists or green environmental hippies who lives here.
Narrator: Soren, a native of the island, convinced some of his neighbors to become early adopters. They found success, and spread the word. Jorgen Tranberg operated a large and profitable herd of milk cows. After initial reservations, he invested in a turbine on his own land. When that went well, Jorgen became part owner of one of the offshore turbines.
Soren: Farmers, they have to invent new things and be ready for changes. So when they see a potential, they look at it, no matter what it is. They look at it, say, "Could I do this?" And if they see fellow farmers do the same thing, they are quick to respond to that. So even being very traditional and conservative in their heads I think they have this ability of making moves and do things, because they have this independency in them. A farmer is a free man-- maybe he owes a lot of money to the bank, but he's still a free man in his thinking.
Narrator: It was seeing what was in it for them and for their community, that won over landowners in West Texas. And it took one of their own, a man whose family had deep roots in Roscoe's cotton fields, to educate them about wind farming. Cliff Etheredge: Well, I'm really a farmer-farmer, you see. I farmed for almost over 40 years. We're in-- right in the middle of the Roscoe Wind Farm. And we've got about 780 megawatts of production, that's per hour, enough electricity for about 265,000 average homes.
Narrator: Roscoe had no oil and faced hard times in the early 90's, but it did have wind.
Cliff: When this land was acquired there was absolutely no value to the wind. Fact is, it was a severe detriment, because of the evaporation of the moisture.
Narrator: Cliff, like Soren, had to work with his neighbors to get them ready to accept wind turbines.
Cliff: The first thing farmers want to know is, "Well, how much is it going to cost me?" It costs them nothing. "What's it going to hurt?" Three to five percent of your farmland is all it's going to take up. You can do what you want to with the rest of it. Then it came down to, "Well, how much money is this going to make me?"
Narrator: Cliff did his research and checked his numbers with wind experts and the Farm Bureau.
Cliff: Then I was able to go to our Landowners' Association and show them, where they had been receiving 35 to 40 dollars an acre, then the landowners could expect somewhere in the neighborhood of three times that.
Narrator: In fact, farmers stand to make 10 to 15 thousand dollars a year, per turbine, just from leasing the wind rights.
Cliff: There was no guarantees in it from the very beginning, but sure enough we've got, I think, in the neighborhood of 95 or more percent of our area that accepted the wind farm.
Narrator: In both Samso and West Texas, individuals saw economic benefits. But the whole community, beyond the investors and land-owners, benefited too.
Cliff: Because of the wind farm, now, and the people working in the wind industry, now we've got jobs available and opportunities for young people to come back from college or from technical school or from whatever. It's just been a Godsend.
Narrator: For Kim Alexander, superintendent of the Roscoe school district, that godsend translates into dollars.
Kim Alexander: In 2007, prior to the wind values coming on our tax roll, our property values were at about $65 million. And then, that wind development, they jumped to approximately $400 million, to $465 million.
Narrator: The school district will get more than $10 million dollars over a decade. That guaranteed revenue stream unlocked additional funding. School buildings, some dating from the 1930's, could be updated, and computer labs added.
Cliff: This is an indication to me of what can be done for rural areas, and will be done, all the way to Canada-- bringing life and prosperity back to these rural communities that are suffering just like we have.
Narrator: The same oil shock that got Brazil started on ethanol, got Denmark started on manufacturing wind turbines, just in time to compensate for a decline in its ship-building industry.
Lykke: And it's also good for the economy, in terms of export. I mean, 10% of Danish exports comes from the cleantech area.
Narrator: Energy and environment always require tradeoffs, such as clear vistas versus clean energy. It's something that communities have to make time to work through. Cliff, for one, believes it's worth it.
Cliff: Everything, the schools, the churches, the civic organizations, all the businesses will benefit from this. It will increase, hopefully, our town's populations, and our economics.
Kim Alexander: My granddad used to say, not realizing he was prophetic, but "If we could sell the wind, we'd be wealthy." Well, who would have ever thought we'd be able to sell the wind?
Narrator: For Samso, Denmark and Texas, clean energy brought economic benefits and energy security. But replacing fossil fuel emissions with wind power has other advantages.
Lykke: And let's not forget, also good for climate and health, and such, and that's a very important argument.
Cliff: We've got a constant wind resource here, that's tremendously valuable, and as opposed to oil and gas, it'll last forever, and it doesn't pollute anything.
Credit: Earth: The Operators' Manual [16]. "Yes, In My BackYard" (aka YIMBY!). [17]" YouTube. April 22, 2012.
Calming Commerce
Calming Commerce
Businesses routinely pay more for long-term, guaranteed supplies than the lowest short-term price available on the spot market. Unexpected, large price increases ("shocks") have real costs. There is, for example, a rather close relation between oil-price shocks and major economic recessions. One fairly recent study, from members of the Research Department of the US Federal Reserve Bank of Philadelphia, concluded that even with optimal policies, central banks cannot completely offset the “recessionary consequences of oil shocks” (Leduc, S. and K. Sill, 2004, A quantitative analysis of oil-price shocks, systematic monetary policy, and economic downturns, Journal of Monetary Economics 51, 781-808). Reducing reliance on oil may help offset such shocks, however, and the analogy to common business practices suggests that at least some extra cost is justified to smooth such fluctuations.
Until recently, countries with local resources of coal or gas might have relied on them; the greater difficulty of transporting coal and gas long distances for international trade has insulated them from some of the spikes in oil prices arising from the effects of Mideast political unrest or other issues. However, huge investments are being made to increase the shipping of coal and gas. This may reduce (but not eliminate) variability in oil prices, by broadening the total supply of easily traded fossil fuels, but likely by increasing variability in coal and gas prices.
Renewables and nuclear power typically have high construction costs but low operating costs compared to fossil fuels; once built, the price of power from renewables and nuclear tends to be more predictable than from oil. Ironically, the fluctuations of renewable energy sources over times from seconds to seasons (wind dies, sun sets) are highly challenging for engineers, complicating construction of an energy system based on these sources; however, at longer times the fluctuations of fossil fuels are larger, with renewables offering stability and predictability for the financial side of the industry. The US Pentagon has stated that it is increasing its use of renewables and its conservation efforts in part to provide protection from energy price fluctuations (U.S. Department of Defense, 2010, Quadrennial Defense Review Report [18], p. 87,).
Providing for the Common Defense
Providing for the Common Defense
Militaries around the world face the difficulty of defending their countries, and contributing to peacekeeping or humanitarian efforts. Changing conditions make this mission more challenging.
The US military, in its Quadrennial Defense Review (2010), made the often-quoted statement “. . . climate change, energy security, and economic stability are inextricably linked. Climate change will contribute to food and water scarcity, will increase the spread of disease, and may spur or exacerbate mass migration.”
The importance of climate change for security was echoed by US Navy Admiral Samuel J. Locklear III, whose duties include relations with North Korea and many other Pacific nations. When asked about the biggest threat to stability in the region, he stated that climate change “…is probably the most likely thing that is going to happen… that will cripple the security environment” over the long-term (Bryan Bender, Boston Globe, March 9, 2013).
Slowing down climate change thus may improve issues that the military considers important for national security, in the US and many other countries. If national security merits investments above those for an economically optimal path, this would tend to motivate more action now to address the coupled problems of energy and environment.
Earth: The Operators' Manual
For a little more about what the US military thinks about climate change, and what why are doing, take a look at these two short clips.
Video: The Pentagon & Climate Change (4:19)
So physics and chemistry show us carbon dioxide is at levels never seen in human history. And the evidence says it's all of us burning fossil fuels that's driving the increase. But what about climate change and global warming... are they for real? Here's what those who have looked at all the data say about the future. (3rd party voice) "Climate change, energy security "and economic stability are inextricably linked... "Climate change will contribute "to food and water scarcity, "will increase the spread of disease, "and may spur or exacerbate mass migration..." Who do you suppose said that? Not a pundit, not a politician... the Pentagon.
(machine gun fire) These war games at Fort Irwin, California, provide realistic training to keep our soldiers safe. The purpose of the Pentagon's Quadrennial Defense Review, the Q.D.R. is to keep the nation safe. The review covers military strategies for an uncertain world. The Pentagon has to think long-term, and be ready for all contingencies. The 2010 Q.D.R. was the first time that those contingencies included climate change. Rear Admiral David Titley is Oceanographer of the Navy, and contributed to the Defense Review. I think the Q.D.R. really talks about climate change in terms that really isn't for debate. And you take a look at the global temperatures... you take a look at sea level rise, you take a look at what the glaciers are doing, not just one or two glaciers but really glaciers worldwide, and you add all of those up together, and that's one of the reasons we really believe that the climate is changing.
So the observations tell us that. Physics tells us this as well. (Richard Alley) What climate change means for key global hot spots is less clear. (Rear Admiral Titley) We understand the Earth is getting warmer, we understand the oceans are getting warmer. What we do not understand is exactly how that will affect things like strong storms, uh, rainfall rates, rainfall distribution. So yes, climate change is a certainty, but what is it going to be like in specific regions of the world and when? (Richard Alley) One area of particular concern to the Navy is sea level rise... Sea level rise is going to be a long-term and very, very significant issue for the 21st Century. (Richard Alley) The Q.D.R. included an "infrastructure vulnerability assessment" that found that 153 naval installations are at significant risk from climatic stresses. From Pearl Harbor, Hawaii, to Norfolk, Virginia, the bases and their nearby communities will have to adapt. (Rear Admiral Titley) Even with one to two meters of sea level rise, which is very, very substantial... we have time. This is not a crisis, but it is certainly going to be a strategic challenge.
(Richard Alley) Globally, climate change is expected to mean more fires, floods and famine. Nations may be destabilized. For the Pentagon, climate change is a threat multiplier. But with sound climate science, Titley believes, forewarned is forearmed. The good thing is, science has advanced enough in oceanography, glaciology, meteorology, that we have some skill at some timeframes of predicting this. And if we choose to use those projections, we can in fact, by our behavior, alter the future in our favor. (Richard Alley) Titley and the Pentagon think the facts are in. Climate change is happening, and there is very, very strong evidence that a large part of this is, in fact, man-made. (indistinct talking) (Richard Alley) The military is America's single largest user of energy, and it recognizes that its use of fossil fuels has to change.
Credit: Earth: The Operators' Manual [16]. "The Pentagon & Climate Change [19]." YouTube. April 16, 2012.
 Earth: The Operators' Manual
Video: Toward a Sustainable Future: "Khaki Goes Green" (4:33)
(Richard Alley) The military is America's single largest user of energy, and it recognizes that its use of fossil fuels has to change. The Pentagon uses 300,000 barrels of oil each day. That's more than 12 million gallons. An armored Humvee gets four miles to the gallon. At full speed, an Abrams battle tank uses four gallons to the mile. And it can cost as much as $400 a gallon to get gas to some remote bases in Afghanistan. Fort Irwin is a test-bed to see if the army can operate just as effectively while using less fossil fuel and more renewables.
And it's not just Fort Irwin and the Army. (Marine Corps cadence) Mama, mama, can't you see... (Richard Alley) At Camp Pendleton, Marines were trained on an energy saving Experimental Forward Operating Base that deployed with them to Afghanistan. Before any equipment goes into theater, we want marines to get trained on it. So what are some of the things that we could take hold of right away and make sure that we can make a difference for the war-fighter down range? (Richard Alley) They test out different kinds of portable solar power units. They also practice how to purify stagnant water and make it drinkable. It's good. (Richard Alley) The Army and Marines both want to minimize the number of convoys trucking in fuel and water. A report for the Army found that in five years, more than 3,000 service-members had been killed or wounded in supply convoys. And if you've got Marines guarding that convoy, and if, God forbid, it get hit by an IED, then what are the wounded, and what are the deaths involved in that, and really, are we really utilizing those Marines and that capability, uh, the way we should. (Richard Alley) Generators used to keep accommodations livable and computers running are also major gas-guzzlers. (Capt. Adorjan Ferenczy) Right now what we are doing is putting up a power shade. It has flexible solar panels on the top, and gives us enough power to run small electronics such as lighting systems and laptop computers. It also provides shade over the tent structure.
Experimenting with this equipment in Africa proved that it could reduce the internal temperature of the tent seven to ten degrees. (Richard Alley) All the LED lights in the entire tent use just 91 watts, less than one single, old-fashioned incandescent bulb. It's a no-brainer when it comes to efficiency. (Richard Alley) Light emitting diodes don't weigh much, but they're still rugged enough to survive a typical Marine's gentle touch. (Zach Lyman) When we put something into a military application, and they beat it up, it's ruggedized. It's ready for the worst that the world can take. And so, one thing that people say is, if, you know, if the military has used this thing, and they trust it, then maybe it's okay for my backyard.
(Richard Alley) Renewable energy will also play an important role at sea and in the air. The Navy's Makin Island is an amphibious assault ship with jump jets, helicopters and landing craft. It's the first vessel to have both gas turbines and a hybrid electric drive, which it can use for 75% of its time at sea. This "Prius of the ocean" cut fuel costs by two million dollars on its maiden voyage. By 2016, the Navy plans to have what it calls a "Great Green Fleet", a complete carrier group running on renewable fuels, with nuclear ships, hybrid-electric surface vessels, and aircraft flying only biofuels. By 2020, the goal is to cut usage of fossil fuels by 50%. Once deployed to Afghanistan, the Ex-FOB cut down on gas used in generators by over 80%. In the past, the Pentagon's innovations in computers, GPS and radar have spun-off into civilian life. In the future, the military's use of renewable energy can reduce dependence on foreign oil, increase operational security, and save lives and money. (Col. Jim Chevallier) A lot of the times it is a culture change more than anything else. And the Department of Defense over the years has proved, time and time again, that it can lead the way in that culture change.
Credit: Earth: The Operators' Manual [16]. "Toward a Sustainable Future: "Khaki Goes Green [20]."" YouTube. April 9, 2012.
Working on a Solution
Working on a Solution
Employment is an important and often contentious issue in most countries, with concerns about providing enough good jobs for everyone who wants one. Fossil-fuel companies unequivocally provide many jobs, and good ones. Recently, natural-gas fracking in Pennsylvania, where Dr. Alley lives, has generated many jobs (although some of them have come at the expense of coal jobs). How many? Do you count only the jobs in the industry? Or the jobs in supply industries? Or the jobs that are supported by the salaries of people in the industry and the supply industries through the money they spend? Different groups promote different numbers, which can vary greatly. Real issues underlie some of the choices—you could argue that if Pennsylvania did not produce gas, it would produce coal, or wind energy, or something, so the jobs would exist. Or, you could argue that if Pennsylvania did not produce gas, the jobs would all go to Texas or Saudi Arabia, and then you need to decide whether Pennsylvania should count jobs there or not.
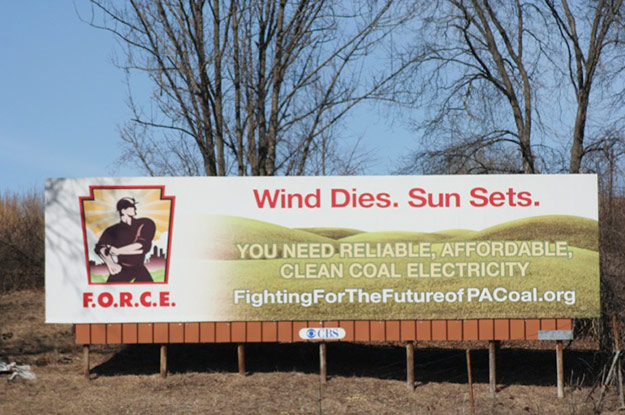

With a sufficiently broad view, the most accurate assessment probably is that, if we ignore the economic good from avoided climate change, switching from fossil fuels to alternatives will have relatively little influence on employment overall, if the switch is done so as to minimize impacts or maximize gains in the economy, as described above. A small but notable body of literature points to gains in employment with a switch. And, if the advantages of an economically optimal course as opposed to a business-as-usual course are considered, gains in employment become likely. A few relevant references are given in the Enrichment. Note that although the literature on employment effects of energy choices is growing rapidly, it has not reached the level of reliability that applies to, say, the radiative effects of CO2.
Pulling a few things together
Pulling a few things together
The preceding sections are not a complete list of policy-relevant issues. And, as noted earlier, politics, psychology, and other issues are important. Policy choices that shift employment from one profession to another have costs for people who located, trained, and otherwise prepared for the lost jobs. And, those losing jobs have faces and names, whereas the people who will get the new jobs generally don’t know who they are, and often are still in school somewhere, so policy choices that have no effect on total employment nonetheless have real economic costs and often much larger political costs.
Nonetheless, the available scholarship shows clearly that an efficient response to climate change is economically beneficial if the costs of climate change are included. Even ignoring the benefits of avoiding climate change, the response can be made at a cost that is small compared to the whole economy (say, 1% or less, rather than 10% or more), with the possibility of the most efficient response having no effect or even yielding economic and employment benefits, while the response clearly can have benefits for national security and avoidance of negative externalities of the energy system.
The Present Policy Position
The Present Policy Position
If you find yourself in a hole, stop digging.
- Often attributed to Will Rogers, U.S. humorist
We hope it is clear to everyone that inappropriate policy response can make this problem, or any other problem, worse—the discussion above assumes efficient policy responses. But, this raises the question of the current policy response—how much are we doing now to stop global warming?
Subsidies:
One measure might be to look at subsidies, because their cost is probably much easier to estimate than the impact of regulations. The International Energy Agency (IEA), an intergovernmental organization established through the Organisation for Economic Co-operation and Development (OECD), estimated subsidies for their World Energy Outlook 2012. They found world-wide subsidies for renewable energy in 2011 of $88 billion, or just over 0.1% of the world economy. (International Energy Agency World Energy Outlook 2012 [21], chapter 7,). However, IEA also found that direct fossil-fuel subsidies worldwide totaled $523 billion, almost six times more, and just over 0.7% of the world economy (World Energy Outlook, Executive Summary, 2012). [22]
The International Monetary Fund (IMF) provided a more comprehensive estimate of subsidies for fossil-fuel energy (Energy Subsidy Reform: Lessons and Implications, 2013 [23]). The IMF considered pre-tax and post-tax subsidies. Pre-tax subsidies are primarily payments or other ways that allow consumers to spend less than the market rate for fossil fuels, and are mostly found in the developing world. Post-tax subsidies include lower tax rates on sales of fossil fuels than on sales of other goods and services, and failure of tax rates to recover the externality damages from fossil-fuel use to health, environment, etc.; this includes climate change, which was calculated at the social cost of $25 per ton of CO2, perhaps on the low end but within the range typically seen in such studies.
The IMF estimated global pre-tax subsidies in 2011 as $480 billion, similar to the IEA estimate; this is about 0.7% of global Gross Domestic Product (GDP, which is roughly, the size of the whole global economy), or 2% of total government revenues. Total subsidies, including lower tax rates and externalities, were much larger, globally $1.9 trillion in 2011, about 2 ½ % of world GDP, or 8% of total government revenue. Post-tax subsidies were more concentrated in the developed world, with the US the single largest subsidizer ($502 billion, to China’s $279 billion).
Worldwide, these reports indicate that direct subsidies for renewables and fossil fuels per kilowatt-hour are very roughly equal, with subsidies relatively larger for renewables in the developed economies and smaller in the developing countries. Including the full subsidies with externalities, the data suggest fossil fuels are much more subsidized than renewables per kilowatt-hour in developing and developed economies, including the US.
Research:
Public support for research is also relevant, because it helps produce the technologies that enter the market. For example, the fracking boom was commercialized by private companies, but development received notable support from funding of the US Department of Energy and other sources (see, for example, Begos, K., Decades of federal dollars helped fuel gas boom [24], Sept. 23, 2012, Associated Press).
Estimates of research funding are available from the IEA. As of 2010, IEA member nations (most of the big players in worldwide research) had increased funding for Energy RD&D (Research, Development and Demonstration projects) to about 4% of their total research portfolio, still a very small fraction (research on topics such as health and medicine tends to be much bigger) (IEA, Global Gaps in Clean Energy RD&D 2010 [25], International Energy Agency). Over decades, the energy research portfolio has been dominated by fission, fusion and fossil fuels, with fossil-fuel research exceeding research on all renewables combined. By 2010, increasing research on renewables had almost caught up with fossil fuels if stimulus funds during the recent widespread recession were omitted, although fossil fuels benefitted more from stimulus funds than did renewables. Thus, over the time during which much of the research was done that is now contributing to economic activity, fossil fuels have been favored over renewables in publicly funded research (Figure 1, p. 6 in Global Gaps, IEA, 2010).
You can be confident that many people, on many sides, would argue about the discussion here. Where the IMF has identified subsidies because fossil fuels are taxed at a lower rate than, say, computers, the fossil-fuel industry is likely to view any tax above zero as a subsidy for non-fossil-fuel energy sources. In the US, money is collected from fuel sales for cars and trucks, and used to build and maintain roads. Is this a tax, serving to reduce fossil fuel use? Or, a user fee, with no net effect on fossil-fuel use? Or, a subsidy, enhancing fossil-fuel use? (By having the government build new roads, “eminent domain” can be used to force private landowners to sell property for roadways, allowing more roads at lower cost and thus more car and truck transport than would be possible under private funding with “normal” landowner rights. Similarly, when the interstate highway system was started under the administration of President Eisenhower, it was authorized by the National Interstate and Defense Highways Act of 1956, with an explicit tie to national defense; this likely made funding easier, and the roads served to greatly increase truck and automobile traffic, and “suburban sprawl”, at the expense of trains.
Video: Road Subsidy (1:06)
PRESENTER: This road is headed north into Canada just east of the Great Glacier Waterton Lakes International Peace Park that straddles the Canada, Alberta, border. The road has been built, and then you'll see that the road has been maintained. And in many countries, roads are built and maintained with small taxes on gasoline petrol, motor fuel.
When economists, policymakers talk about using taxes to reduce fossil fuel use, that would assume that the money raised is not used for purposes, such as building and maintaining roads, that actually serve to promote more use of fossil fuels. It is quite possible that the sort of tax that is used to fix the roads is actually a sort of subsidy for fossil fuel use because it encourages more use. And if you want to use a tax to reduce fossil fuel use, the money has to go to something other than promoting more fossil fuels.
Past Policies
Past Policies
Policy decisions made in the past are relevant as well, because business-as-usual assumes that we continue doing what we have done in the recent past, which in turn is based on policies that were adopted further in the past. Consider the case of rural electrification and wind.
As told below (click on link below) before his election as US president, Abraham Lincoln gave a speech highlighting the value of learning and inventing, and in particular pointing out the potential for wind power in places such as his home state of Illinois. Rapid development followed, with the wind power initially used primarily for pumping water, but increasingly with generators and batteries to provide electricity for remote farms.
Many people are surprised that Lincoln was a promoter of wind energy, but he believed deeply in education and the good that science and engineering could do for people. He was an inventor, the only US president with a patent to his name, as described in this clip from the Earth: The Operators’ Manual team. And, in signing the bill founding the US National Academy of Sciences, he gave the US and the world a highly respected source of unbiased information on science. Take a look at this slightly longer than 5-minute clip to learn more.
Earth: The Operators' Manual
Video: Abraham Lincoln and the Founding of the National Academy of Sciences (5:11)
We've been in this situation before a time of war a nation divided and science called upon to deal with matters of national security that's why we're here at the Lincoln Memorial most of us know Abraham Lincoln was a great president you may not know he's the only u.s. president to hold a patent for an invention he came up with an ingenious way to use inflatable pontoons to get river boats over shallows there's no evidence it was ever made but it shows his interest in science and engineering and the challenges he faced his commander in chief during the Civil War also had to do his ships in 1862 the Confederate ship Virginia sides have been armored with iron plates the origin of the name ironclad sank two wooden ships from the Union Navy and threatened their the arrival of the u.s. ironclad monitor saved the third ship as the two vessels fought to a draw it was clear that a new era of naval warfare had dawned and everyone would need to adjust.
There were two serious problems one is that iron rusts really rapidly in salt water and the other you can see here this is a civil war-era compass you don't have to be an expert to know that iron interferes with it if you're trying to navigate in battle and you're not sure whether your compass needle points north you really are lost at sea Lincoln and his advisors came up with a new idea on March the third 1863 the Senate and House passed an act to incorporate the National Academy of Sciences two months later the Department of the Navy asked the new Academy to figure out how to deal with the problem of compasses onboard ironclads some of the nation's leading scientists took part always volunteers and for no pay something that's still the tradition for all National Academy panels the solution was to use an array of small magnets to offset the effects of the iron plates and the invention was good enough to keep the ships on course.
Some 50 years later when Woodrow Wilson wanted advice about military preparedness. It was once again the Academy he turned to and when president George W Bush wanted impartial advice on the reality of climate change it was the academy he asked to do a new assessment their report included a prominent skeptic but still it concluded greenhouse gases are accumulating in Earth's atmosphere as a result of human activities causing surface air temperatures and subsurface ocean temperatures to rise we cannot rule out that some significant part of these changes is also a reflection natural variability but the committee generally agrees the assessment of human-caused climate change presented in the IPCC report when you need a compass to steer by us we do now in matters of energy and climate you can't do better than to rely on an assessment by the National Academy of Sciences.
In 2007 the National Academy began to study how to reach America's energy future their report found that energy efficiency can provide the most immediate step forward reducing projected usage by about one-third by 2030. They said America needs an improved electricity grid to support smart meters and integrate large amounts of wind and solar energy renewables could be one-quarter of us energy supply by 2035 as China's doing the Academy supports aggressive research and development on carbon sequestration to see if coal can realistically contribute energy without pollution and co2 emissions in transportation they see a continuing role for gasoline cars with better miles per gallon but also liquid fuel from non-food biomass plus electric vehicles.
They say next generation nuclear should be explored if cost and safety can be handled but overall they find that the US will benefit from long-term solutions and consistent sustained action America has to make hard choices and soon fewer than a billion and a half people were alive on earth to mourn Lincoln's death more than seven billion of us now wonder how long the oil and coal will last and whether their exhaust will click our future but with a little help from wind water Sun and atoms and a lot of brain power we can make a blinkin proud greet the new century with 10 billion smiling people for Earth the operator's manual this is Richard alley.
Credit: Earth: The Operators' Manual [16]. "Abraham Lincoln and the Founding of the National Academy of Sciences [26]." YouTube. October 6, 2012.
However, beginning in 1935, the US Government supported a program of rural electrification, providing loans and in other ways promoting centrally sourced electricity for remote farms, often with coal-fired generation systems. The advent of such centralized, subsidized power made off-the-grid systems less competitive. Many other forces were at work as well, but the government actions on topics including rural electrification and interstate highways have contributed to increased fossil-fuel use.
Video: Rural Electrification (1:07)
PRESENTER: This picture from the US National Archives shows the TVA, the Tennessee Valley Authority, during the 1930s, engaged in rural electrification, bringing power to the people. They built dams to make hydroelectric power, but they also used coal, and the government helped bring the wires that brought the electricity to people.
This government decision had a lot of winners that included the people they got the power, it included people who were building coal fired power plants, and people building dams. It also had losers, including people who made windmills, because with the government supporting this centralized power coming in through the wire, getting your own distributed power from your own windmill was less favorable.And so when governments make decisions, they really do have winners and losers. And the situation we have now, with more coal than wind, in part comes from decisions that were made in the past by the government.
Activate Your Learning
You may hear people say that it is not the government's business to regulate energy or subsidize renewable energy research and infrastructure. What examples could you provide to show that the government has been supporting energy projects for a long time, and many of these projects have favored fossil fuels?
Click for answer.
So, recognize that there are more reasons for disagreement on the nature of a fossil-fuel subsidies than on the radiative effects of the CO2 from burning the fossil fuel. And, Dr. Alley would be happier reporting the current state of policies if the relevant literature were broader and deeper, with more impartial assessments.
Still, the sources cited here are reliable, and together present a clear picture. Suppose we ask where we are on a spectrum of possible policies, extending from “work really hard now to reduce future global warming” through “neutral” to “work really hard now to accelerate future global warming.” Based on the sources cited here, the best estimate of the net effect of past and ongoing government policies and government-funded research is still on the “accelerate global warming” side of neutral for the world and for the US. Policies probably are moving toward neutral, with renewables gaining in research and subsidies, but with more to do to reach a balanced approach, and even more to reach an economically efficient position. And, considering the inertia of the current system, moving well past neutral may be required to really overcome the history of fossil-fuel promotion.
For a little more Enrichment on policies, have a look at this short clip. This is a very U.S.-centered piece, and while we in this course have tried to avoid telling you what to do, some of the people interviewed in this clip were happy to offer their opinions.
Earth: The Operators' Manual
Video: Avoid the Energy Abyss (4:18)
Narrator: Old energy technologies can be cleaned up. New ones can come online. Other nations are moving ahead. What will it take to keep the lights on in the United States, and Avoid The Energy Abyss. There's no question that transitioning to clean and renewable energy is going to be a huge task. But America has done similar things before. Take the Hoover Dam, and the electrification program of the 1930s. Or the building of the Interstate highway system.
Hofmeister: Well, I am optimistic. John Hofmeister is a former oil man, based in Texas. He headed up Shell in the United States. He also wrote a book entitled Why We Hate The Oil Companies, and he's worried that today America isn't making the right decisions about energy.
Hofmeister: You need to think of energy in a 50-year time frame. And our elected officials are thinking of energy in two-year election cycles. That's ridiculous! And it is going to take us, as a nation, to an energy abyss, because you can't design an energy system to replace the 20th century, which is growing old, and running out in some cases, you can't replace that with two year cycles of decision making.
Narrator: Other nations have changed. Look around Copenhagen and you see pedestrian walkways and bikes as a major form of transportation. In response to the Oil Shocks of the 1970s, Denmark turned away from fossil fuel and toward sustainable energy.
Soren: In Denmark we had car-free Sundays where nobody was allowed to drive their cars on Sundays. And there was a rationing of fuel and gas.
Lykke: These are sort of things that people remember, "Well, we need to change."
Narrator: The U.S. also experienced the Oil Shocks, with gas lines and angry citizens. And for a while, America got serious about exploring alternatives to imported gasoline and fossil fuel. Here's the energy share of all Federal, non-defense Research and Development investment from 1957 through 2011. Investment ramped up in the Oil Shock, but then went down, down, down. And without serious new commitments, the 2009 stimulus funds for energy, will just have been a temporary upward blip.
Hofmeister: We're not making the decisions at the national level that need to be made, in terms of the next decade, and the next several decades after that.
Narrator: Hofmeister and other experts look around the world and see other countries moving ahead to defend their nation's energy security.
Hofmeister: Places like China have a clear plan, and they are driving forward. And they are building an energy infrastructure for the 21st century, which will perhaps one day supply energy to the world's largest economy-- China, not the U.S.
Narrator: In America, energy policies change with each new Administration, if not sooner. Since our interview, Denmark's government has changed parties, but now former Minister of Climate and Energy, Lykke Friis, doesn't expect energy policy to change that much.
Lykke: Even if we are kicked out of office, this will not lead to a huge change in our energy policy. Hofmeister: We need decisions that go beyond a single term of a President, that go beyond a single Congress, with a Republican or a Democratic majority. And we're not doing it. Other parts of the world are.
Lykke: All countries have to embark upon this transformation. And the lesson is, it can be done, because Denmark, we've had also growth rate by 80% since the 80s. But our energy consumption and CO2 emissions have been more or less stable.
Hofmeister: We're going to find ourselves as a nation, entering third world status when it comes to the reliability of our energy system, within a decade, if we don't get with a different program. And I don't see any inclination now to make hard decisions. I see divisiveness, I see partisan paralysis, I see short-term political time thinking, and I see dysfunctional government.
Credit: Earth: The Operators' Manual [16]. "Avoid the Energy Abyss" (Powering the Planet) [27]." YouTube. April 22, 2012.
Discussion Assignment
Reminder!
After completing your Discussion Assignment, don't forget to take the Module 11 Quiz. If you didn't answer the Learning Checkpoint questions, take a few minutes to complete them now. They will help your study for the quiz and you may even see a few of those question on the quiz!
Discussion Question
Objective:
Learn about energy subsidies using information provided by IMF. Explore the International Monetary Fund (IMF) website's information on reforming energy subsidies and find something interesting to share.
Goals:
- Find reliable sources of information on the internet
- Communicate scientific ideas in language non-scientists can understand
Description:
The International Monetary Fund has many resources on energy subsidies. We would like you to explore them and share what you found most interesting.
First, surf on over there and have a look around the website, International Monetary Fund [28].
A lot of useful information is available in the left-hand column. Click to download the paper Case Studies on Energy Subsidy Reform—Lessons and Implications [29]. Read about subsidies in one of the countries described there, and give us a brief synopsis. Be sure to describe the country you read about, what subsidies were used, how the subsidies were reformed, and what lessons were learned from making these reformations. At the end, include your own opinion on whether or not these subsidies (in their reformed versions) are a good idea, and explain your thinking.
Instructions
Your discussion post should be 150-200 words and should answer the question completely. In addition, you are required to comment on one of your peers' posts. You can comment on as many posts as you like, but please make your first comment to a post that does not have any comments yet. Once you have an idea of what you want your post to be, go to the course discussion for your campus and create a new post, including the name of the country in the title of your post.
Scoring Information and Rubric
The discussion post is worth a total of 20 points. The comment is worth an additional 5 points.
| Description | Possible Points |
|---|---|
| Summary of case study or other article read | 15 |
| Comment on whether energy subsidies are practical in the U.S. | 5 |
| Comment on someone else's post | 5 |
Summary and Final Tasks
Summary
If we decide to take action to reduce climate change by altering our energy system, many options exist for policies. As with any issue, it is possible to pass laws that fail to reach their goals on climate and energy. However, much scholarship shows that the policy actions available on this topic include efficient options that will improve the economy.
Governments could enact regulations reducing or outlawing some fossil-fuel emissions. Or, governments could choose to send a “price signal”, making it more expensive for people to do things that change the climate.
The most commonly discussed price-signal policies involve cap and trade, or carbon taxes. Under cap and trade, a government legally limits the amount of CO2 or other greenhouse gases that can be emitted, selling (or giving away) permits for such emissions; the permits then can be traded or sold, allowing the market to reduce greenhouse-gas emissions as efficiently as possible. The most commonly discussed form of a carbon tax would simply tax the amount of carbon in a fossil fuel when it is extracted from the ground or imported to a country.
You can find a wide diversity of opinions on all aspects of this. Overall, economists seem to prefer the efficiency of price signals over regulations, and prefer the simplicity of a carbon tax over cap and trade, although in the broadest sense cap and trade can be viewed as a sort of carbon tax.
If a price signal is used, the effect on the economy depends very strongly on how the money raised is then spent. A tax swap that reduces taxes on things we like (wages, for example) would cause the impact of a carbon tax on the economy to be small, with the possibility that the tax would actually accelerate economic growth a little, even if you ignore the benefits of avoiding climate change; including those benefits in the calculation makes a carbon tax with tax swap more beneficial to the economy.
Carbon taxes can be harmonized across countries to gain international cooperation. The trade system might be used. For example, suppose that some countries decided not to tax their carbon. Other countries might convince these nonparticipants to change their minds and cooperate by offering the nonparticipants a choice: Tax your own carbon and keep the money in your own country to do good things, or have the participating countries keep the money from a tax on all trade with the nonparticipants.
If we go to the effort of developing and implementing efficient policies to deal with climate change, there are likely to be many related benefits, including greater national security, reduction in economic recessions caused by oil price swings, reduction in unintended damages from the energy system, and perhaps increased employment.
However, the available scholarship suggests that the current policy position for the world as a whole, and for many or most countries, is serving to accelerate rather than to reduce climate change and that this has been true over the previous decades. “Business as usual” then is not neutral on this topic, but serves to accelerate fossil fuel use and climate change.
Reminder - Complete all of the Module 11 tasks!
You have reached the end of Module 11! Double-check the to-do list in the Module Roadmap to make sure you have completed all of the activities listed there before you begin Module 12.
Enrichments
Coal Mining Jobs
Coal Mining Jobs
Suppose that we consider the fates of two people, a coal miner from a mid-latitude place such as Poland or Pennsylvania, and a subsistence farmer from a low-latitude place such as the Sahel. Suppose further that because of resource depletion and technological change including cheap fracked gas, the coal-miner's job is ultimately unsustainable; in contrast, the farmer's job was sustainable if very difficult in the face of natural weather events, but is being made ultimately unsustainable by the additional stress from climate change. (Yes, we just made several suppositions, and the individual case here may not be accurate, but the broader issues are relevant.)
In the coal miner's case, even though the job is ultimately going to be lost for economic reasons, some triggering event is likely to control the exact timing, and that event may be the start of a new government regulation to limit climate change. In the farmer's case, even though the farm is ultimately going to be lost because of climate change, some triggering event such as a weather-related drought is likely to control the exact timing. The short-term story that is easiest for news media to cover is that weather hurt the farmer and efforts to combat climate change hurt the miner; the long-term story is that the evolving economy hurt the miner and climate change hurt the farmer.
The slow nature of global warming, and the fact that so much of the damage comes from weather events that were made more likely or worse but were not completely caused by the changing climate, poses a large communications challenge. The story that is easiest to tell is largely wrong, with actions that help people getting bad press.
This example was carefully constructed, and there likely will be coal-mine jobs lost because of any serious effort to limit climate change. But, the issues raised are real.
Living with Wind Turbines and Coal Exhaust
Living with Wind Turbines and Coal Exhaust
We can't look at all of the externalities of all of the different energy sources. But, here are a few observations on wind, and then on coal.
Wind
The National Research Council (US) in 2007 looked at Environmental Impacts of Wind-Energy Projects (Washington, DC). Summarizing other research on p. 51 of the report, for the U.S.:
Collisions with buildings kill 97 to 976 million birds annually; collisions with high-tension lines kill at least 130 million birds, perhaps more than one billion; collisions with communications towers kill between 4 and 5 million based on 'conservative estimates,' but could be as high as 50 million; cars may kill 80 million birds per year; and collisions with wind turbines killed an estimated at 20,000 to 37,000 birds per year in 2003, with all but 9,200 of those deaths occurring in California. Toxic chemicals, including pesticides, kill more than 72 million birds each year, while domestic cats are estimated to kill hundreds of millions of songbirds and other species each year.
A recent study for Canada (Calvert, A.M., and 6 others, 2013, A synthesis of human-related avian mortality in Canada, Avian Conservation and Ecology 8(2), article 11) found the following rates of bird deaths from the listed causes (the mid-range estimates are shown here, with some ''lumping'' - for example, the study separates feral cats from domestic cats, but we added them together here as "cats," and made some other similar combinations; note that 'buildings' involves birds flying into buildings, not buildings falling on birds):
- Cats: 196 million
- Power lines: 28 million
- Transportation (cars and trucks): 14 million
- Hunting: 5 million
- Pesticides: 3 million
- Buildings: 2.5 million
- Hay cutting: 2.2 million
- Forestry: 1.4 million
- Communications towers: 0.2 million
- Mining: 0.2 million
- Hydroelectric reservoirs: 0.15 million
- Oil and gas: 0.025 million
- Fisheries: 0.023 million
- Wind energy: 0.017 million
Power lines might carry electricity from wind energy, but also might carry electricity made with oil and gas, or other sources.
Even increasing wind to generate 100% of our energy (something that is not envisioned) probably would leave wind turbines less dangerous to birds than some other human-caused conditions. And, again, considering the dangers of climate change to wildlife, and the potential to avoid climate change through construction of wind turbines, it is likely each wind-turbine built saves more birds than it kills (e.g., Sovacool, B.K., 2012, The avian and wildlife costs of fossil fuels and nuclear power, Journal of Integrative Environmental Sciences 9, 255-278).
Wind farms certainly make some noise, and block some views. So do many other things. Recently, much discussion has focused on 'infrasound', low-frequency noise from wind turbines. Astudy for the Environmental Protection Agency in South Australia (Evans, T., J. Cooper and V. Lenchine, 2013, (Infrasound levels near windfarms and in other environments [30]) found similar infrasound levels at rural sites close to and far from wind farms, and generally higher levels in urban areas far removed from wind farms.
A fascinating psychological study also looked at this issue (Crichton, F., G. Dodd, G. Schmid, G. Gamble and K.J. Petrie, Can expectations produce symptoms from infrasound associated with wind turbines? Health Psychology, March 11, 2013, doi: 10.1037/a0031760). The people in the study ('subjects') expected to be exposed to infrasound, but then some were exposed to infrasound and some weren't. The subjects were shown either materials quoting scientists that infrasound at such levels is not a health issue, or first-person accounts of people claiming health impacts from wind-farm infrasound. Subjects exposed to the stories of wind-farm health impacts reported that the infrasound gave them similar symptoms, whereas subjects exposed to the scientists did not report such symptoms, with no differences related to whether the subjects were or were not exposed to infrasound. Thus, this study found that infrasound did not cause people to report health problems, but stories about the dangers of infrasound did.
There clearly is much more literature on this topic than these few examples. But, we believe that these examples tell representative stories; there are externalities of wind, but they are far smaller than for most alternatives.
Here is one more possibly relevant story on externalities of wind. As described in his book Earth: The Operators' Manual, when Dr. Alley spent a few months on Cape Cod in the autumn of 2009, wind power was in the news extensively. Dr. Alley did not conduct any formal studies, but he read the local newspaper every day, listened to local radio and TV, and talked to people. Anecdotally, wind power being used to clean up polluted local groundwater, or to lower local taxes, was primarily viewed as being highly beneficial, with few dissenting voices. However, wind power that was planned to be built offshore of the Cape, in the view of the people living there, for the primary purpose of shipping energy off-Cape, and with the people expecting little or no direct benefits, was primarily viewed negatively. When the people expected to benefit from the wind power, most of them were not worried about the externalities; when the people did not expect to benefit, many more worries were expressed about externalities.
Coal
The relevant scholarship on coal tends to show much greater externalities than for wind or other renewables. Some people who rely heavily on coal are still quite willing to experience the externalities, but overall the economic impacts of the illnesses caused by the coal can be quite large. The studies discussed below are all for the USA. Note, however, that because the regulatory situation has been changing, and natural gas has been replacing some older coal plants, the situation may be somewhat better now than when the studies cited below were conducted.
One study (Epstein, P.R. and 11 others, 2011, Full cost accounting for the life cycle of coal, Annals of the New York Academy of Sciences 1219, 73-98) estimated that a subset of the externalities from coal, such as illnesses from airborne particles and mercury, costs society at least as much as the coal-fired electricity costs customers, and probably at least twice as much (climate-change costs were estimated as less than 20% of this total). Thus, this study found that for each dollar spent on coal-fired electricity by a customer, causing the power company to mine the coal and generate the electricity, society loses more than another dollar because of health impacts and other problems.
This result is supported by the study of Muller et al. (Muller, N.Z., R. Mendelsohn and W. Nordhaus, 2011, Environmental accounting for pollution in the United States economy, American Economic Review 101, 1649-1675), who found that for the economy as a whole, '. . .coal-fired power plants have air pollution damages larger than their value added. . . damages range from 0.8 to 5.6 times value added.' Again, climate-change costs are small compared to other costs of coal, and again, this study did not assess all of the negative externalities of coal-fired electricity.
Levy et al. (Levy, J.I., L.K. Baxter and J. Schwartz, 2009, Uncertainty and variability in health-related damages from coal-fired power plants in the United States, Risk Analysis 29, 1000-1014) looked at damages from particulate air pollution (including particles formed in the atmosphere from sulfur dioxide and nitrogen oxide emissions), for 407 coal-fired power plants in 1999, considering both emissions from each plant and how many people were exposed because they lived close by. This study found that the health impacts from just the particulates exceeded the cost of the electricity for most of the plants. With a typical retail cost of electricity of about $0.09 per kilowatt-hour, the negative externalities were estimated as ranging from $0.02 to $1.57 per kilowatt-hour for the different plants. Clearly, it is possible to build coal-fired power plants with much lower impacts than from some operating plants, and the very high costs from some plants do not prove that all coal-fired power is 'bad'. But, if actions are taken to reduce power generated from such plants and replace it with almost any other source, there are likely to be large benefits to society. And, while cleaner coal plants would cause lower externalities than the older, dirtier ones, most other alternatives would lower externalities even more.
You can probably find literature with smaller estimates of damages. However, the weight of the literature does indicate that fossil-fuel externalities are notable, and especially in the case of coal are quite high compared to other energy sources, including traditional oil and natural gas. (Tar sands are being developed now, and in some ways may turn out to have certain similarities to coal. This will be an interesting story to follow to get clearer answers.)
Module 12: Ethical Issues
Module 12 Overview
We have seen that an economically efficient path for humanity involves starting now to reduce future warming from greenhouse gas emissions of fossil fuels, and that there are many policy paths that would achieve this goal, while increasing national security, reducing damaging price shocks, reducing unintended consequences of the energy system, and perhaps increasing employment. But, many more issues arise for most people.
Climate change especially hurts future generations, and poor people living in hot places now, whereas relatively wealthy people living now in colder places are using the most fossil fuels per person and thus driving climate change. This is clearly an ethical issue. However, if everyone today were to hugely and very rapidly reduce fossil-fuel use, the economic damages would be high across the world, so the ethical discussion is more complex than simply telling people to quit burning fossil fuels.
Many people argue that actions to counter global change will cause government intrusions into people’s lives that are ethically unacceptable to libertarians. However, additional consideration shows that some possible policies are not especially intrusive. Furthermore, the history that governments often become especially active during hard times and natural disasters, and the clear scholarship that failure to act will promote hard times and natural disasters, suggests that libertarians may instead favor appropriate government actions now.
Response to climate change can also reduce extinctions and take out insurance against disasters, and may avoid some bad societal conditions.
Goals and Objectives
Goals
- Recognize the role of human actions in determining the future of our climate
- Explain scientific concepts in language non-scientists can understand
- Find reliable sources of information on the internet
Learning Outcomes
By the end of this module, you should be able to:
- explain that decisions about energy and environment have important but very complicated ethical implications.
- recognize that relying more on natural resources does not always correlate with greater wealth or higher quality of life.
- recall that if we value our grandchildren's quality of life as much as we value our own, then it is worthwhile to do more now to avoid climate change.
- assess what you have learned in Unit 3.
Roadmap
| To Read | Materials on the course website (Module 12) | |
|---|---|---|
| To Do | Quiz 12 Unit 3 Self-Assessment Capstone Project [31] |
Due Friday Due Friday Due Finals week -- see Syllabus link for precise date. |
Questions?
If you prefer to use email:
If you have any questions, please email your faculty member through your campus CMS (Canvas/Moodle/myShip). We will check daily to respond. If your question is one that is relevant to the entire class, we may respond to the entire class rather than individually.
If you prefer to use the discussion forums:
If you have any questions, please post them to Help Discussion. We will check that discussion forum daily to respond. While you are there, feel free to post your own responses if you, too, are able to help out a classmate.
Wanting What We Do
Wanting What We Do
Billions of people follow religions with strong statements on right and wrong, addressing what we should do as well as what we can do. Billions more people have moral codes developed in other ways. Maximizing the utility of consumption is probably not the only motivation, and arguably not the main motivation, for many people. We want to stay alive and have some fun, raise our children, help other people, and do the right things for the right reasons.
How do we do deal with problems as big as energy and environment, when there is so much good on many sides? Let’s look at a few more issues. This is not a complete list, and we cannot tell you what to do, but some of the “obvious” arguments may not be quite as clear as they first seem, and other arguments provide useful guidance.
Short version:
Perhaps the greatest challenge in energy and environment is to help people now and in the future, and no single action can be best at doing both. Business-as-usual is highly likely to bring an inefficient economy and natural disasters that motivate government intervention, so many libertarians may wish to support some intervention now to avoid that greater future intervention. Even many ardent environmentalists deeply dedicated to helping future generations recognize our dependence on fossil fuels and the dangers of changing too rapidly. But wise policy action will help people now and in the future, while helping preserve endangered species, and taking out insurance against possible if unlikely extreme disasters.
Friendlier but longer version:
As an Earth scientist, Dr. Alley suspects that he took the easy way out, leaving the hard problems for economists, political scientists, and ethicists. Consider the two short discussions below, only slightly tongue-in-cheek, “Libertarians for Government Intervention?” and “Environmentalists for Economic Growth?”
Libertarians for Government Intervention?
Libertarians for Government Intervention?
Perhaps the most common argument about the philosophy of global warming and fossil fuels comes from those who favor libertarian principles and the free market. Many individuals and groups argue that “solutions” to the climate-change problem will cause government growth, but “that government is best that governs least” (Thoreau, Civil Disobedience, 1849), and that the government should not be in the business of picking winners and losers.
Reading the 21-page document from US President Obama’s administration outlining policy responses to CO2 and climate change, as introduced in the previous module, may suggest how many regulations could be written to deal with this issue. And, more regulations generally bring more government.
Despite such a clear example, however, this argument really is more nuanced. A libertarian's desire for less government may actually recommend response now to fossil-fuel CO2.
Enrichment: To learn more about how government intervention was implemented in our pioneering past, see the Enrichment titled Scarcity and Government Intervention in Colonial Massachusetts.
First, as described in the previous module, there is no requirement for complex regulations to respond to climate change. Indeed, a carbon tax on fossil fuels, at the point where they are extracted from the ground or imported into a country, could be simpler than some of the taxes it might replace. Most fossil fuels currently have some tax or impact fee levied on them, so many of the mechanisms to implement a carbon tax already exist. And there are far fewer producers of fossil fuels than there are people earning wages, so replacing wage taxes with carbon taxes could make many things easier.
An additional issue is that, in times of shortage or crisis, governments often become more active or intrusive—the recent recession led to “stimulus” activities in many countries, as did the depression of the 1930s, and natural disasters frequently motivate government efforts. Thus, careful actions to avoid shortages and natural disasters may limit government rather than promote it.
The strong scholarship showing that ignoring climate change leads to a suboptimal economic path, and that rising CO2 is likely to increase natural disasters of many types, is surely relevant. The statements from the US military that global warming is expected to make more work for them also suggest that ignoring climate change may increase government intervention.
Hence, free-market proponents or libertarians might argue that their goals are better served by guiding simple and transparent policy responses to climate change rather than by opposing all responses.
An argument often coupled to limiting government is that responses to climate change should be avoided because governments should not be in the business of picking winners and losers. This argument might be applied to favor government actions that are general rather than specific. For example, people who do not want the government to specifically promote certain groups might favor a carbon tax rather than loan guarantees to start-up companies.
More generally, a little careful reflection will show that any significant government action gives arelative advantage to some people or groups over others. And, deciding to continue with current policies is a significant government action, which also gives arelative advantage to some people or groups over others. Thus, governments cannot avoid “picking winners and losers” at some level.
A silly and extreme example of government actions benefiting some people more than others may be a useful starting point. Suppose government-supported doctors stop an epidemic and save the lives of millions of people. In the short-term, the government has caused money loss for gravediggers, undertakers, shop owners selling sympathy cards and flower arrangements, the real estate agents and auctioneers who would have disposed of the property of the deceased, lawyers who would have handled the estates, and many others.
Perhaps more seriously, consider the history of the construction of modern storm and sanitary sewers, and clean water supply in London in the latter 1800s and in many other cities. This massive effort ended cholera outbreaks that had brought huge death tolls, and otherwise greatly improved public health and well-being. But, modern sanitation also ended whole professions such as “night-soil hauler” (those who gathered human waste and sold it to farmers as fertilizers), while making new professions—the government actions unequivocally created winners and losers. Furthermore, the transition to modern sanitation was greeted with many of the same arguments about government intervention, individual liberty, and natural processes that now address climate-change issues, including The Economist editorializing against aspects of the transition, as mentioned earlier.
Earth: The Operators' Manual
Video: Toilets and the SMART GRID (4:00)
A fascinating case study on the transition from "night-soil haulers" to sanitary sewers is dramatized in this clip.
Richard Alley: So, the Earth provides lots of choices for clean, low carbon energy. And Brazil, China and Texas show there are ways forward. But can we afford it? Can society make the kinds of changes needed? Well, we've done it before. (Bagpipes play) Let's take a walk through history in Edinburgh, Scotland, but it could be many other big cities a couple of centuries ago. Here's what a visitor from London wrote in 1754--
[Man with English accent] "When I first came into the High Street of that city, I thought I had not seen anything of the kind more magnificent-- the extreme height of the houses, which are, for the most part, built with stone, and well sashed..."
Alley: It's evening, time for a wee bite! Scottish taverns, then as now, were noisy places, buzzing with good conversation and high spirits. The visitor from London dined well and drank a few glasses of fine French claret, but then his new friends did something that was second nature to them in the 18th Century, but seems very strange to us today.
[English accent] "The clock struck ten, then the company began to light pieces of paper, and throw them upon the table to smoke the room..."
Alley: Lighting those pieces of paper was meant to mix one bad smell with another. Chambermaid: "Gardyloo!"
Alley: You see, ten o'clock was when you could empty brimming chamber pots down into the streets. Chambermaid: "Gardyloo!" Man: "Hud your haunde"/ Hold your hand!
Alley: The London visitor safely dodged the terrible shower, but then he was forced to hide between his bed sheets to avoid the smell pouring into his room from the filth. And yet the people had gotten used to this, to the inconvenience and disease, and some people made a living hauling away the human waste. The English visitor thought all this simply had no remedy.
[English accent] "Anything so expensive as a conveyance for the waste down from the uppermost floor could never be agreed on. Nor could there be made, within the building, any receiver suitable to such numbers of people."
Alley: So, what do chamber pots have to do with carbon dioxide and sustainable energy? Not to mince words, we're pouring CO2, another form of human waste, into the public space, and we'll have to deal with the consequences if we don't clean it up. Today, of course, most of us have conveyances down from bathrooms, and sinks to wash in, and receivers for our waste. What happened?
Look around your house. How much did the porcelain throne in your bathroom really cost? It took a considerable investment for all those pipes bringing water to wash with, and to take the waste away. The revolution in hygiene involved an extensive infrastructure of toilets in homes, sewers underneath our cities, water treatment plants. Today we might call it the Sanitation Smart Grid. So, how much did all this cost? Not that much, if you consider the millions of lives saved with clean water, prevention of diseases like cholera and typhoid-- something like 1% of the economy, in very round numbers. And that's more or less the estimated cost of switching the world to a sustainable energy system that doesn't dump fossil fuel CO2 into the public space. Cleaning up the cities took decades and even centuries, and we're trying to do things a little faster, but the revolution in waste management shows that we can do big things to get benefits that none of us would ever walk away from.
Credit: Earth: The Operators' Manual [16]. "Toilets and the SMART GRID (Powering the Planet) [32]" YouTube. April 22, 2012.
Pushing this analogy a little further, suppose that after scientific arguments were brought forward linking poor sanitation to death from cholera, the lawmakers of London had decided to do nothing to improve the sewers, and a huge cholera epidemic had then engulfed the city. (One additional and somewhat outlying epidemic did occur before the cleanup was completed, but no more epidemics occurred after the full system was in place.) It seems highly likely that the families of the deceased would have viewed the decision, which favored business-as-usual rather than cleanup, as a policy decision with very clear losers. And, it seems highly likely that the families of the deceased would not have been happy with that decision.
The analogy to the modern situation with CO2 is not exact. When London was deciding about sewers, the scientific knowledge showing that human waste in drinking water spread cholera was not nearly so strong as the scientific knowledge we now have showing that CO2 from fossil fuels in the air changes the climate; the Londoners did not have knowledge of the mechanism causing the illness, for example. But, “clean this up or you might die next week” tends to provide a stronger motivation than “clean this up or risk a suboptimal economy over the next decades”. The issues of attribution of extremes are very relevant here, though; people now are dying in disasters that cannot be said to have been caused by climate change, but that are being made more likely or worse by climate change.
Enrichment: For more on the history of winners and loses from interactions with governments, see the Enrichment titled Public-Private Partnerships in Oklahoma.
Environmentalists for Economic Growth?
Environmentalists for Economic Growth?
Grossly oversimplified, considering the use of fossil fuels and the damages from the resulting climate changes, the big winners today are wealthy people living in places with winter, air conditioners and bulldozers who are changing the climate a lot, and the big losers today are poor people living in places without winter, air conditioners and bulldozers who are not changing the climate much.
With winter, the warming may hurt ski areas, but warming up the uncomfortably cold times may have relatively little cost or even overall benefits. Air conditioning allows people to work during hot summers and saves them from heat-related illness, thus greatly reducing the damages from excess heat. And bulldozers (and all the other machines) allow building walls against the rising seas or otherwise dealing with problems arising. People lacking winter, air conditioners and bulldozers are endangered by rising heat stress and sea level without the means to deal these problems.
The main religions and traditions of the world all include some principle or law functionally equivalent to the “Golden Rule”, which is often stated as “Do unto others as you would have others do unto you”.
The Wikipedia entry, Golden Rule [34], is fascinating to read for the remarkable universality of this “ethic of reciprocity”. You also might look at Vogel, G., 2004, The evolution of the Golden Rule, Science 303, 1128-1131 for a bit on the science of this, and how it extends beyond humans.
And, it is very clear that if the people causing the most climate change are suffering the least from it, and the people causing the least climate change are suffering the most from it, the Golden Rule is not being followed. No one can legally dump their human waste in your yard, but people can dump their fossil-fuel waste into the atmosphere you live in and change the climate where you live.
This is an important ethical argument that concerns many people. However, the answer may not be as simple as stopping the waste-dumping. Because the winter air conditioner-bulldozer people can help the have-nots get air conditioners and bulldozers to deal with the changing climate.
Activate Your Learning
Strong scholarship shows that wealthier people in colder places are using fossil fuels faster per person than the rest of the world, and this is causing climate changes that primarily are hurting poorer people in warmer places, and future generations. Does this mean that wealthy people should stop using fossil fuels now and let the rest of the world catch up?
Click for answer.
Suppose, as a thought experiment, that by continuing with business as usual, climate change will increase the economy by 2.5% in a high-latitude industrial country, and reduce the economy by 25% in a low-latitude agricultural country of similar size and similar population, but that today the economy is 20 times bigger in the high-latitude country. Or, the high-latitude country could spend 2.5% of their economy to stop climate change. If you poke around with those numbers, allowing the climate change to occur gains the high-latitude country more money than the low-latitude country loses, whereas working to stop the climate change prevents the relatively large loss from the low-latitude country but leaves the countries combined with a smaller economy. Allowing the climate to change, and taking some of the extra money from the high-latitude country and giving it to the low-latitude country, could leave both countries better off than working to stop the climate change.
Lots of questions arise. Maybe the biggest one is whether the high-latitude country will really transfer that money. And, can the transfer be efficient, and will the low-latitude country be happy with charity rather than their traditional lifestyle, and more. But, the economically optimal path allows much climate change to occur because the use of fossil fuels is so valuable to people now. The tendency for many low-latitude poor countries to subsidize fossil fuels for their people may be viewed as showing how much those people want the energy from the fossil fuels.
Perhaps the most direct interpretation of this these two brief studies is to provide support for the idea that wise response involves both helping people now, and heading off future changes, and that these may occasionally work at cross purposes.
Many other issues are ethical or include ethical elements. Some are quite complex, but others much simpler. Let's take a look at a few more as we move forward in this module.
Sharing the Jump Ramp Fairly?
Sharing the Jump Ramp Fairly?
The world’s governments have agreed, through the United Nations Framework Convention on Climate Change (UNFCCC), to avoid dangerous anthropogenic influence on the climate system. What exactly that means was not spelled out in the Convention, but many people have tried to interpret it.
Perhaps the easiest interpretation is that, as global average temperature rises, damages rise faster, so temperature change must be limited to some chosen value. Some groups have advocated for 2°C above the average for some specified time before the bulk of human-caused global warming. As discussed in Unit 1, stopping the warming at 2°C would require considering many human-caused changes, including the warming effects of methane, nitrous oxide, and other gases, such as chlorofluorocarbons, the effect of soot on the reflectivity of snow, and more, although CO2 is still the biggest issue. If we go too far beyond 2°C, we are fairly confident that CO2 dominates, because it has the biggest source and stays around long enough to really accumulate in the atmosphere. And, in that case, it doesn’t matter where the CO2 was emitted, and it doesn’t matter very much when the CO2 was emitted because it mixes around the globe and accumulates in the air. Thus, if we were to accept a number such as 2°C warming, or 3°C, or 4°C, then we have essentially specified the total amount of fossil-fuel CO2 we can emit to the atmosphere.
But, who gets to emit that CO2? The people who got started first? The people with the biggest economy? The people who pay the most for the right to do so?
If you looked at the Enrichment earlier in this module about Eastham, Massachusetts, you saw a tiny bit of the long history of people negotiating over rights and responsibilities of “commons”, those parts of the Earth that we control together rather than individually. The atmosphere and ocean are the greatest commons of all, spreading whatever we do around the globe and thus linking all of us.
Per nation, China is now the biggest emitter of CO2 per year. But, per person, China still falls far behind many other countries including the United States. And, if you include emissions in the past, China is not even close to much of the developed world. But, is a modern Briton really responsible for the industrial revolution?
We might decide to divide the allowable emissions by country, or by person and might use future emissions only, or include past emissions back some time to be determined. (R.T. Pierrehumbert, 2013, Cumulative carbon and just allocation of the global carbon commons, Chicago Journal of International Law 13, 527-548.) This is a quite different approach than the economic optimizations, and strikes many people as being inherently fairer—each person (or perhaps each country) gets a share. One could even set up a program of trading the shares, in a cap-and-trade system.
Additional issues arise, however, and, history may matter in additional ways. A sustainable future seems likely to involve solar cells and a smart grid with a lot of computer power. The solar cells and transistors for the computers were invented at Bell Labs, in the USA. One might make a case that some fossil-fuel burners have used the energy to contribute to the valuable intellectual commons. Indeed, it is almost impossible for a person to live without having some negative impact on the carrying capacity of the planet, so one might balance the negative against the positive—did someone, or some country, contribute more than they took?
This issue can become rather personal. Dr. Alley travels a lot to do research and communicate about energy and environment. Personally, he has taken actions such as bicycling rather than driving to his office, and his family works in other ways to reduce emissions. But, those efforts don’t fully offset the effects of his travels. He tries hard to “phone in” talks and meetings rather than traveling, but he still travels. Is he wrong to travel to do the research and communicate the results? You might argue that he is.
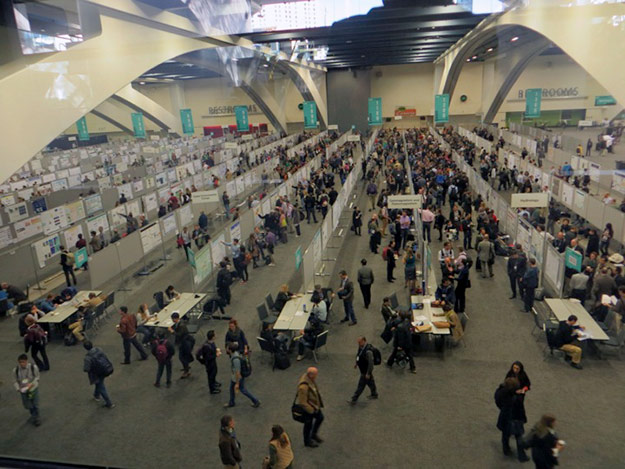
But, if all of the scholars who understand the problem were to sit down and shut up the moment they understand, would the rest of the world ever gain the knowledge needed to reach a sustainable future? A stunt biker trying to jump over an obstacle will accelerate to hit the ramp hard, and many people believe that in studying and communicating about the Earth, scholars are doing the same thing, accelerating towards a possible problem so that we can jump over it.
Indeed, most people, if they see a person in danger, will provide warning and try to help, and will disapprove strongly of someone who fails to warn an endangered person. (In certain circumstances, failure to warn or failure to report can be a crime.) So, are scientists and engineers morally obligated to travel and communicate and invent and build to warn and help fellow humans? A firefighter battling a dangerous blaze may set a small fire to control a big one; are the CO2 emissions of some travelers fully analogous? And, does such CO2 count against the “fair share” that started this section?
We won’t answer any of these questions for you. But, we suspect that in thinking about them and discussing them with others, you will gain interesting insights that might help many other people. Instead, we’ll move on to some topics that may prove a little easier.
Pure Rate of Time Preference
Pure Rate of Time Preference
Whether or not the limits on growth and measures of growth (from Module 10) are treated properly in economic models, the other part of the discount rate is easier to discuss ethically. The economically efficient path typically allows much global warming to occur in part by treating people today as being more important than people in the future—the pure rate of time preference. In the extreme, if you could spend a penny now to stop a problem that would cause the end of civilization ten thousand years in the future, it would not be economically justified under the simplest application of the optimizations. (Economists do understand such issues, as discussed briefly in Module 10, but reducing them to absurdity is sometimes useful to start a discussion, just as long as everyone remembers what was done.)
We do often behave as if we are more important than future generations, as observed by economists. But when we are discussing what policies we should adopt, is that an ethically justifiable stance? Especially when considering future generations, rather than just ourselves in a few decades, many people are very uneasy assuming that we matter more than they do. And, if this pure rate of time preference does not apply to future generations, or applies at a lower level, then more action is justified now to avoid climate change than is calculated in the economic optimizations.
For more on the ethics of the Pure Rate of Time Preference, and how using a lower value motivates much more effort now to reduce global warming, see the Stern Review (Stern Review on the Economics of Climate Change, 2006 [35], Her Majesty’s Treasury, United Kingdom,).
Extinction Is Forever
Extinction Is Forever
Many scientists have speculated on the possibility that we can use genetic engineering to bring back extinct species. But, so far, we can’t. And, we don’t know whether we will be able to. Furthermore, a lot of rare species in remote rain forests or deep in the sea are very unlikely to ever leave us samples that we could use to bring them back, and extinction may come before we even discover many of those species. Some of those species may have genetic diversity that would improve our food crops, or in other ways help us—the mere fact of their existence means that they are unique in some way, and do some thing(s) well. Others may offer no commercial prospects, but they raise the question of whether it is right for us to cause extinction. Many people and many religions have rather strong views about being stewards of the Earth and the creatures on it, and causing widespread extinctions is often not viewed as good stewardship.
If we value the other species on the Earth, climate change is a real challenge that risks widespread extinction. Simply switching back to burning trees rather than fossil fuels is not a good answer. Finding ways to sustainably generate power while not changing the atmosphere is a better answer. So, greater efforts to reduce global warming than the economically efficient path would be justified if we value biodiversity, or traditional lifestyles, or natural ecosystems, more than they are currently reflected in measures such as GDP.
Video: 10 Pikas and Climate Change (3:22)
If you already watched the pika video back in Module 10, you don’t need to watch it again. But, if you didn’t, or you want to review, here it is because it is relevant in both Modules.
RICHARD ALLEY: (VOICEOVER) American pika's live in though Western US and Canada, and except in very special circumstances, they have to live in cold places. They're related to other pikas, and to rabbits and hares. They're lagomorphs.
Pikas don't hibernate despite living in cold places. They spend the summer making hay. They run around gathering up flowers and leaves, grasses, and what they can, and they stow them in a space under a rock. And then they can hide in this hay and stay warm during the winter and eat it, and they're having a very good time there.
Many people think pikas are really cute. On one of our early family vacations, finding a pica was a goal, and we went out of our way looking for pikas, and we found them and we had a ball doing it.
Because pikas like cold climates, many populations are being placed in danger by a warming climate. This figure shows in the bluish areas the suitable habitat for pikas recently in the US. And then the little red areas in the centers there show the habitats that are expected to remain around the year 2090-- one human lifetime from now-- if we follow a high CO2 emissions path.
Some populations of pikas out in the Great Basin are already endangered or have disappeared. We looked at the economic analyses of global warming, which compare cost of reducing climate change to the cost of the damages if we allow change to continue. And which show that we will be better off if we take some actions now to reduce warming.
But in general, such economic analyses do not include pikas. Loss of populations of pikas, even extinction of the pika has little or no economic value. We personally spent money on tourism that involved pikas. But we probably would have gone to see something else if pikas hadn't been there.
Pikas aren't really monetized. They haven't been turned into their monetary value. And so the loss of pikas isn't monetized either in these calculations, nor would be loss of polar bears or many, many other species.
If you believe that pikas are valued, that if you pay a little money to save pikas, or if you believe we have an ethical or religious obligation to preserve creation, including pikas, then the optimum path for you would involve doing more now to slow global warming.
If you don't believe pikas are a value, the economic still says that we should do something to slow global warming if we want to be better.
Resource Curse
Resource Curse
“As mining, oil, and gas profits have soared, living standards and overall economic growth in many resource-rich developing countries have remained flat or have even declined. This ‘resource curse’…” (United States Agency for International Development, 2010, Alliance Industry Guide: Extractives Sector, p. 4)
Video: Earth 104 Module 12 Resource Curse (1:41).
PRESENTER: This is a redrawn figure from Saxon Warner a famous paper from back in 2001. Each dot here is a country. And what we have at the bottom is how much of the economy of that country was exports of natural resources in the year 1970. So the countries that exported a lot of natural resources are out here. The countries with very little natural resources as a fraction of the total economy are down there. And then what's shown here is how much did that economy grow over the next 20 years.
What you' l notice is that all of the countries that really relied on exporting natural resources in 1970 had very slow or actually negative growth over the next 20 years. Some countries that did not have many natural resources also had slow growth, but all of the countries with fast growth did not rely on natural resources.Now a correlation does not tell you what caused it, but there are enough reasons to believe that when you rely really heavily on unnatural resources there may be a tendency to work hard to control the natural resource rather than to building a wonderful place for everyone to live. And if that's true then there may be some relationship in here that is meaningful and reliance on the natural resources may not be a good thing for having a big healthy economy.
Video: Earth 104 Module 12 Resource Curse Math (1:56).
PRESENTER: This plot from the OECD is actually fairly similar to the resource curse plot that we showed in the previous figure. High share of rents from natural resources and the national income, these countries out here on the far right, have a lot of oil or, otherwise, are relying on natural resources. So this is not that different from the previous plot.
But shown here, rather than economic growth, is how their students performed on an international test of mathematics competence. And what you'll notice is that for the countries that relied very heavily on natural resources, including the oil, you don't have those countries doing really, really well in this international comparison. Some countries that don't have natural resources also didn't perform well. But the countries that performed really well are fairly low in reliance on their natural resources. They're using something else to make their economy work.
Just like the previous figure, there is no proof in this one, that relying on oil gives you poor students. You could argue about who representative the test is. You can argue about history, whether people are taking it seriously. But in general, we like to see our students do well.
And in general, seeing this sort of behavior in the data makes some people nervous and makes them ask whether there really is a sort of resource curse, that relying very heavily on resources leads to poor societal outcomes. And if there's a chance of that, then some people wonder whether it might be wise long term to try to move your country more in this direction.
The two graphs here don’t answer questions but ask them. The first, from the well-known 2001 paper by Sachs and Warner (Sachs, J.D. and A.M. Warner, 2001, Natural resources and economic development, European Economic Review 45, 827-838), shows, for a wide range of countries, how much they depended on exporting natural resources (oil, coal, gas, diamonds, iron, etc.) in 1970, and how much their economies grew in the next 20 years. You will see a lot of variability, but no fast-growing countries that relied heavily on natural-resource exports, and many fast-growing countries that exported few natural resources. The second figure, from the Organization for Economic Co-operation and Development, 14 March 2012), compares student performance on a standardized test to their country’s reliance on “rents”; in economic-speak, the money that goes to a property owner for the oil pumped out from under their land is rent, so the horizontal axis in this plot is actually quite similar to the horizontal axis in the previous plot. You will again see much variability, but with the countries that rely most heavily on rents having poor student performance, and the countries with the best student performance having little reliance on rents.
The mere fact that we showed these plots and brought up this topic will make some people mad. A few people may argue that the data are somehow not representative. Many more will argue that correlation is not causation, and that some additional factor that correlates with reliance on natural resources is controlling economic growth and student performance. The extra factor might be a history of colonial oppression, or extreme initial poverty, or something else.
But, consider the possibility that reliance on selling oil or other natural resources does lead to economic difficulties. Turning oil, or diamonds, into money, requires controlling the resource and access to a trade route, and some knowledge and ability to get the valuable thing out of the ground and into the trade system. Extraction of a hard-to-get resource may be expensive and high-tech, requiring many people and great cooperation. However, for the most efficient producers of the easiest oil, the costs of production may be as low as $5 for a barrel of oil that sells for $100. That translates into a need for few people with few jobs, with huge profit (“rent”) available for controlling the resource.
Contrast that with the task of turning sand and red rocks into cell phones, which requires a complex web of technical, economic, social and political interactions, and a vigorous educational system. Selling a readily available, concentrated natural resource is a quicker and easier way to make money than is generating an integrated economy capable of doing a variety of high-tech, artistic, educational and other things. But, the integrated economy might just make a better place to live. And, the effort to control a scarce resource might just lead to the people in control taking actions that don’t make everyone happy.
Suppose that there is at least a little reality in this “resource curse”. A slow, predictable reduction in the concentrated high value of the fossil-fuel resource over a few decades in the regions relying heavily on it just might be the way to shift toward development of integrated economies, with greater economic growth and educational achievement. People looking at the two plots shown above often get a little nervous about betting the future on oil, or gas, or any other single, concentrated natural resource, which would move their region to the right on these plots—that doesn’t prove that their economy or their students will trend downward, but it does raise questions. And with the evidence, that for now, fossil fuels are more subsidized than a diverse portfolio of renewables, that nervousness may motivate more effort now to move away from fossil fuels than in the economically efficient path.
Risking It
Risking It
We all know that building things is more difficult than breaking them. No one could construct a college classroom or a computer or cell phone with just a hammer, but any of them can be broken with a hammer (a big hammer—a wrecking ball—for the classroom).
By analogy, we see no plausible way that simply raising CO2 in the atmosphere can turn the Earth into Eden, a paradise for all of us. But, the worst possibilities from global warming are rather scary—tropics too hot for unprotected large animals including us, farm fields too hot for our crops to grow, all of the ice sheets melting and raising sea level roughly 200 feet, poison gases belching out of anoxic oceans. We don’t think that any of these are likely, and they would be well into the future if they happened, but even a slight possibility of such outcomes is not balanced by a similar possibility of highly beneficial outcomes.
Taking Extensive Precautions
When faced with similar situations in everyday life, we take extensive precautions. Driving a car includes the slight chance of being killed by a drunk driver, so we use seat belts and put kids in especially safe child seats, buy cars with air bags and crumple zones, pay for road improvements and police surveillance, and support Mothers Against Drunk Driving. If we think that it is unethical to risk hugely damaging events in the future and that instead we should treat climate change like many other aspects of our lives and take out insurance, then more action would be justified now to slow the changes.
The extensive precautions we take in many ways to avoid possible large disasters are consistent with the Precautionary Principle. This is a generalization of the old medical principle “First, do no harm”.
The United Nations Rio Conference put it this way: "In order to protect the environment, the precautionary approach shall be widely applied by States according to their capabilities. Where there are threats of serious or irreversible damage, lack of full scientific certainty shall not be used as a reason for postponing cost-effective measures to prevent environmental degradation.” (United Nations Environment Programme Rio Declaration on Environment and Development [39], 1992, Principle #15, DocumentID=78&ArticleID=1163).
We discussed earlier how actions have “winners” and “losers”, or at least help one group more than another. Some people have argued that the precautionary principle means that we should slow our changes to the environment until we understand better. But, other people have argued that moving away from fossil fuels might harm the economy, so we should continue with business as usual until we understand better.
In such a situation, one way forward is to assess our experience with similar changes in the past, both environmentally and economically. And, such a comparison suggests that we have successfully negotiated larger economic changes, but have no experience with changes so large in the atmosphere, as discussed next.
Moving Toward the Optimal Path
Looking first at the economics, moving towards the optimal path is often estimated to cost a few months of economic growth over a few decades if you ignore the value of the climate changes avoided, and to improve the economy if you count those changes. Suppose for a moment that all of the climate science proves to be wrong. (Yes, this is a crazy supposition, but just suppose.) If so, then shifting away from fossil fuels is not needed for climatic reasons.
Eventually, the shift still will be needed for supply reasons, so starting to shift now would be an exercise in getting to a sustainable energy system while there is still a fossil-fuel safety net. The fossil fuels not burned would still be there, and could be burned if desired. The economy would have slowed slightly. Some people would have lost jobs, and others gained them. But the big-picture costs of experimenting with a sustainable energy system for a few decades are projected to be small relative to the size of the whole economy.
Governments frequently change their portfolio of taxes and subsidies, so a policy response such as a partial switch from wage taxes to carbon taxes over a few decades would not be far outside of experience. Moving away from fossil fuels would not even lose the technical know-how in the industry, both because serious plans do not envision a complete end to fossil-fuel use releasing CO2 for at least decades, and because most of the skills likely would be needed for geothermal energy or carbon-capture-and-sequestration uses.
The extra costs of running a fully sustainable energy system, with its larger changes than for the economically optimal path, are often estimated as roughly 1% of the economy.
Energy is now about 10% of the economy, so this is an increase in energy costs, but less than some of the oil-price shocks that the economy has experienced in the past. And, this ignores the benefits of slowing and then stopping the warming and other changes from the CO2.
The extra cost of the optimal path, and even of a fully sustainable system, is similar to the extra cost of the modern water-and-sewer sanitary system, as opposed to a minimal system such as existed in London in the days of cholera. Humanity has surely done bigger things, both bad (think of a world war) and good, including building the current energy system. We probably have never agreed to do something this big, but we have muddled through larger changes.
In contrast, atmospheric CO2 is now higher than ever experienced before by modern humans and may be heading for levels not seen in tens or possibly even hundreds of millions of years. Thus, if one subscribes to the precautionary principle, striving first to do no harm, the economic effects of response are well within experience, whereas the climatic effects of failure to respond are well outside of experience. Thus, if you think that the precautionary principle is useful, you probably would recommend more action now to slow fossil-fuel emissions of CO2.
Earth: The Operators' Manual
Video: Look before you Leap (5:03)
To see a little more on why you might want to take out insurance against disasters, go bungy-jumping with Dr. Alley in New Zealand in this clip.
Narrator: Burning fossil fuel emits black soot and other pollutants that fall out of the atmosphere quite quickly. But it also releases carbon dioxide, which remains in the air much longer, to influence Earth's climate. Richard Alley's ice core research shows that sometimes the Earth experiences abrupt climate changes, known as tipping points. And if we keep on burning fossil fuels without capturing CO2 emissions, we may increase the risk of pushing Earth's climate over the edge. It might be wise to Look Before You Leap.
Richard Alley: The Earth's climate system is usually well-behaved-- a little more Sun, a little more CO2, and we get a predictable amount of warming. This is the pattern of natural variability of the climate our planet has experienced over the past 400 thousand years, as recorded in the physics and chemistry of ice cores. The regular ups and downs in temperature are the result of changes in Earth's orbit around the Sun, and their subsequent effects on levels of carbon dioxide and other heat-trapping gases. You can think of this natural variation as the Ice Age roller coaster. As a geologist, I'm at home in the vast expanses of time. So let's take a ride, cresting hills and rolling through valleys, following the more-or-less regular pattern of changing climate, over hundreds of thousands of years. Here we're down at 180 parts per million of CO2 and in an Ice Age. Now we're climbing to 280 parts per million, a warmer interglacial period. Then down to a cold 180 and up again, to a warmer 280. Then repeating 180-280, the natural cycling of the climate roller coaster. But if we look in greater detail at 100,000 years of Earth history, and specifically at the ice core record from Greenland, it's obvious our planet's climate hasn't always had smooth ups and downs. Occasionally, we cross some sort of a tipping point, and the Earth evolves really rapidly to a new state which is very different.
Over the last 100,000 years of the Ice Age cycling, we've had a couple of dozen of these large, abrupt, widespread climate shifts, almost as if the Earth was bungy-jumping off the climate roller coaster. Of course, you'd have to be a little nuts to bungy off a roller coaster, which is why I'm leaving this to my computer avatar. But these abrupt climate changes are real. Here's one of the largest and most recent. About 13,000 years ago, as the Earth was climbing out of the last Ice Age, the North passed a tipping point and rapidly slid back into a cold millennium-- drying monsoon regions of Asia where huge populations now rely on rain and warming the South. There were weather and climate disruptions worldwide. But then, another tipping point was reached, and in ten years or so, temperatures in Greenland rose by about 10 degrees Centigrade, 18 Fahrenheit-- numbers we know with high confidence from the ice core record. Today, whatever climate model we use to project the impact of rising levels of CO2, you see a relatively smooth curve, heading upward, but in principle a change we could adapt to. But Earth's history shows us that Earth's climate doesn't always work this way. Sometimes it really does get as crazy and unpredictable as bungy jumping off the climate roller coaster.
An abrupt climate change could be really bad for people. We're optimistic that we won't have one, but we're not certain. And the science suggests that the harder and faster we turn the CO2 knob, the more likely we are to cross a tipping point and trigger one. Yet here we are today, racing up a hill to who knows where. As burning fossil fuels means we've blown past 390 parts per million, without slowing down. Will our ascent be smooth and manageable? Or will our ride come off the rails? If we wanted to take out insurance against the possibility of such a change, we could look at slowing down now before we tip over the edge.
Credit: Earth: The Operators' Manual [16]. "Look Before You Leap" (Powering the Planet) [40]." YouTube. April 22, 2012.
Self-Assessment
Reminder!
After completing your Self-Assessment, don't forget to take the Module 12 Quiz. If you didn't answer the Learning Checkpoint questions, take a few minutes to complete them now. They will help you study for the quiz and you may even see a few of those question on the quiz!
Learning Outcomes Survey
We have now come to the end of Unit 3. The purpose of this exercise is to encourage you to think a little bit about what you have learned well, and just as importantly, about what you feel you have not learned so well. Think about the learning objectives presented at the beginning of the Unit, and repeated below. What did you find difficult or challenging about the things you feel you should have learned better than you did? What do you think would have helped you learn these things better?
For each Module in Unit 3, rank the learning outcomes in order of how well you believe you have mastered them. A rank of 1 means you are most confident in your mastery of that objective. Use each rank only once - so if there are four objectives for a given module, you should mark one with a 1, one with a 2, one with a 3, and one with a 4. All items must be ranked. For each Module, indicate what was difficult about the objective you have marked at the lowest confidence level.
Module 10
___Recognize that there is a cost to future society of emitting CO2 to the air today.
___Describe how one might balance immediate needs against protection from future losses.
___Explain why growth cannot be infinite in a world of finite resources.
___Use an Integrated Assessment Model to determine the most economically beneficial approach to dealing with emissions and climate change.
What did you find most challenging about the objective you ranked the lowest?
Module 11
___Recognize the multitude of policy options available for our energy system and economy.
___Explain how the effectiveness of emissions treaties and carbon taxes can be verified internationally using remote data collection.
___Recognize that shifting gradually to renewable energy is likely to have little overall impact on employment rates.
___Recall that energy policies and subsidies have been in use for decades, and some of these have promoted fossil fuels over renewable resources.
___Research and evaluate an example of an energy subsidy reported by the IMF.
What did you find most challenging about the objective you ranked the lowest?
Module 12
___Explain that decisions about energy and environment have important but very complicated ethical implications.
___Recognize that relying more on natural resources does not always correlate with greater wealth or higher quality of life.
___Recall that if we value our grandchildren's quality of life as much as we value our own, then it is worthwhile to do more now to avoid climate change.
___Assess what you have learned in Unit 3.
What did you find most challenging about the objective you ranked the lowest?
Scoring Information and Rubric
The self-assessment is worth a total of 25 points.
| Description | Possible Points |
|---|---|
| All options are ranked | 10 |
| Questions are answered thoughtfully and completely | 15 |
Summary and Final Tasks
Summary
Unchecked, climate change is highly likely to bring widespread extinctions and ecosystem disruptions, which will make traditional human lifestyles difficult or impossible, with at least a slight danger of hugely damaging disasters. Ethical concern about such issues, and about the well-being of future generations, motivates more response now than the response that is already economically justified. Although responses can involve intrusive government actions, they do not need to, and a wise response may actually reduce government intrusions.
Video: America: The Operators Manual (4:35)
PRESENTER 1: Richard Alley agrees, science and sustainability both come together in an operator's manual for America.
RICHARD ALLEY: Like thousands of Portlanders, I commute by bike. Like many in Fort Worth, I've worked for an energy company. My university runs a herd of cows, so I connect with Kansans.
I've spent time in some pretty cold places, so I know some of the challenges Alaska faces. And I appreciate the importance of affordable energy to everyone, including the citizens of Baltimore.
So as we look around our planet with eyes informed by climate science and with an appreciation of the vast potential for clean, low-carbon sources of energy, I think we can be optimistic about our prospects while being realistic about how humans are affecting the planet.
Our world is complex, like a giant jigsaw puzzle. But earth science gives us an operator's manual to help us see where most of the pieces go. Some things we know with really high confidence.
Carbon dioxide levels are increasing in Earth's atmosphere and basic physics and objective research show that CO2 warms things up. Analyzing the chemistry of the CO2 shows that most of the carbon is coming from our use of fossil fuel.
Satellites looking down from space show that the atmosphere is warming down here but cooling up here, high in the stratosphere, showing that the warmth isn't from the sun. We've got lots more solid knowledge that just about every climate scientist agrees on.
Of course, there are some things we still don't know. We'd like to know more about clouds. On balance, do they work to make climate changes bigger or smaller? And we'd like to know how weather extremes will change and how fast.
Some things we simply can't know. When will the next big volcanic eruption spread cooling clouds of ash around the planet for a year or two? But even with these uncertainties, the big picture is pretty clear.
In a very real sense, the most important questions aren't about science and engineering but society and policies. What do we want to do? And on that, surprisingly, there's a growing consensus across political parties, businesses, and community groups who are listening to the science and looking to the future.
PRESENTER 2: Obviously, in some ways, there is a diversity of opinion about the degree to which man-made activities affect the climate. Now, I happen to be on the side of those who believe there is an affect.
But suppose one were not. Whether one's focus is on national security, a geopolitical effect, or the environment, in the end all of these things track in the same direction.
PRESENTER 3: Everyone's always talking about the exceptionalism of the United States in global leadership and the clear thought leadership culturally, socially, and I believe in all that.
But if you believe in all that, you then can't turn around and say, well, we're helpless and we're just a little bit of the problem and no matter what we do, China and India will go their own way.
There's just no evidence that that's the case. If the United States leads in this way, others will follow. I mean, that's what leadership's about.
PRESENTER 4: At the end of the day, the atmosphere doesn't care one whit what people think. The atmosphere cares what people do. We can reduce emissions in real time. Why people do it as long as they do it doesn't matter to us.
RICHARD ALLEY: For all we know about the climate, for all the promise of renewables, perhaps even more important is figuring out how to unleash people power to energize our nation.
PRESENTER 5: We got barbecue, we got drinks over here.
RICHARD ALLEY: That's what an operator's manual is all about. It tells us how something works and how to get the very best performance out of it. I also have faith in how America's democracy works.
We can make positive changes if we think clearly and move forward together. That's my hope, that's my faith. For Earth: The Operators' Manual, I'm Richard Alley.
PRESENTER 6: Energy Quest USA. Earth: The Operators' Manual is made possible by NSF, the National Science Foundation, where discoveries begin.
Credit: Earth: The Operators' Manual [16]. "America: the Operators' Manual [41]." YouTube. April 22, 2012.
Reminder - Complete all of the Module 12 tasks!
You have reached the end of Module 12! Double-check the to-do list on the Module Roadmap to make sure you have completed all of the activities listed there.
Enrichments
Public-Private Partnerships in Oklahoma
Public-Private Partnerships in Oklahoma
The United States government bought the Louisiana Purchase from France in 1803, acquiring all or parts of what are now 15 states as well as land that extended into what are now the Canadian provinces of Alberta and Saskatchewan. This solved some problems for the US but created others, including a debate about whether the action was allowed under the US Constitution. What to do with all of this land became a long-term issue for the young country. Issues about the expansion of slavery were prominent in discussions.
The original title and other information for this picture from the Dust Bowl during the Great Depression of the 1930s are:
Title: A sod homestead built in 1900. Pennington County, South Dakota. Since 1900 this sod house has been standing to mark a farmer's effort to reap wealth from the Great Plains. At the time of its construction, there must have been skirmish after skirmish with the cattlemen as the fence of the homesteader narrowed down the range. Then wartime prosperity, with the price of wheat booming. Then the years of intermittent drought, up to the present, and instead of wealth, a bitter battle to achieve mere subsistence on the parched earth Creator(s): Rothstein, Arthur, 1915-1985, photographer Date Created/Published: 1936 May-June. Medium: 1 negative: nitrate; 3 1/4 x 4 1/4 inches or smaller. Reproduction Number: LC-USF34-004666-D (b&w film nitrate neg.) Rights Advisory: No known restrictions. For information, see U.S. Farm Security Administration/Office of War Information Black & White Photographs [43]. Call Number: LC-USF34- 004666-D [P&P] Other Number: G 154 Repository: Library of Congress Prints and Photographs Division Washington, DC 20540 USA [44].
The idea of making relatively small plots of land available to settlers at low or zero cost ('homesteading') was favored by many. But, opposition came from southerners who feared that this would work against plantation-style slave-holding agriculture, and from factory owners in the northeast who believed that cheap or free western lands would raise labor costs by giving more favorable opportunities to many low-cost workers. The secession of the southern states at the start of the US Civil War reduced opposition notably, and the Homestead Act of 1862 was passed soon thereafter. The Morrill Act allowed the creation of land-grant universities, which have provided so much valuable advice to homesteaders and others, and the act establishing the US National Academy of Sciences, which also has contributed greatly to the well-being of so many of these settlers, also passed about this time.
The Homestead Act offered 160 acres free to anyone who met certain requirements of living on and improving the land. Land was often distributed in a "land rush", in which a particular region was opened for settlement beginning at a certain time. 'Sooners' or 'moonlighters' (those who got in 'sooner' by the light of the moon) included some people, such as certain employees of the railroads or the government, who were legally allowed to go in sooner, but others who did so illegally. Complex and long-lasting court cases arose about land claimed by illegal Sooners. (Oklahoma is often called the 'Sooner State', a term that was viewed negatively a century ago because of the implication of cheating, but now is generally viewed positively.)
The homesteaders and their barbed-wire fences often came into conflict with ranchers or cowboys who used large tracts of land for cattle. In drier regions, 160 acres was really too small to make a productive and profitable farm, so in some sense, the government actions may have contributed to the great difficulties that arose when major droughts hit, as during the 'Dust Bowl' of the 1930s. Still, the settlement led to well-established, productive states where millions of people now live happily.
This history can be viewed, or 'spun', in many ways. An opponent of government actions might point to the unfairness of government and railroad employees having access to lands before others, and might point out that government meddling in the free market helped cause the economic and human tragedy of the Dust Bowl. A proponent of government actions might counter that 15 states and millions of people owe their existence to proactive government policies. The story is very different if viewed from the perspective of native Americans, cowboys, plantation owners, factory owners, homesteaders in relatively rainy places or near water sources, homesteaders in relatively dry places far from water sources, and many other groups.
A few points relevant to this chapter are very clear, however. The main events were not controlled by the public, nor by private interests, but by diverse public and private groups and individuals interacting in various ways. The many different interacting groups were impacted by the main policy decisions in distinct ways, with greater or lesser benefit or harm. And, each policy decision built on a long history of earlier decisions that themselves had winners and losers; thus, changing paths is a policy choice with winners and losers, but keeping the same rules is also a policy choice with winners and losers. Because society tends to adapt to existing policies, a change always has short-term costs of switching these adaptations, no matter how beneficial the long-term outcome and this plus the political effort needed to make a change tend to favor continuation of existing policies. But, the choice to continue existing policies is still a policy choice with winners and losers.
A few of the many resources on this topic include:
- US National Archives, Teaching with Documents: The Homestead Act of 1862 [33] (This site includes this image: Homesteading Family [45])
- The Oklahoma State Nickname as the 'Sooner State' [46]
- Oklahoma Historical Society's Encyclopedia of Oklahoma History and Culture [47], entry for Sooner
Scarcity and Government Intervention in Colonial Massachusetts
Scarcity and Government Intervention in Colonial Massachusetts
Serious European settlement of Cape Cod in Massachusetts, USA began with the arrival of the Pilgrims in 1620. The land was almost totally tree-covered, but logging for fuel and building material, and to clear fields for cultivation, quickly became widespread. Wood was burned in great amounts, boiling sea water to obtain salt for packing cod for shipping and to 'try' whale meat to extract the valuable oil. The consequences of deforestation, including soil drying and erosion, as well as the scarcity of fuel, became so severe that government actions were quickly taken.
In Eastham, the freedom-loving pioneers banned cutting of wood on the common lands in 1690 except to supply wood for sales out of town. In 1694, this prohibition was extended beyond the common lands to any source of wood. In 1695, cutting wood on the common was prohibited even for outside cash sales. Similarly, in 1711-12, Truro on the Cape was requiring Court-granted permission before people could cut wood for certain uses. (Rubertone, P. E., 1985, 'Ecological Transformations,' in Part II: Changes in the Coastal Wilderness: Historical Land Use Patterns on Outer Cape Cod, 17th - 19th Centuries, in McManamon, F.P. (ed.), Chapters in the Archaeology of Cape Cod, III: The Historic Period and Historic Period Archaeology, Cultural Resources Management Study Number 13 (Division of Cultural Resources, North Atlantic Regional Office, National Park Service, U.S. Department of the Interior, Washington, DC), p. 78.)
Interestingly, the scarcity was overcome, in part by the reliance of 'renewable' resources. With windmills to pump seawater into solar drying troughs, the Cape Codders secured large quantities of inexpensive salt, without cutting trees.
Estimates
Estimates
Dr. Alley summarized many estimates of the costs of dealing with climate change in his book Earth: The Operators' Manual. Some of those are repeated here.
The Intergovernmental Panel on Climate Change (IPCC) from 2007 found costs of between slight growth (0.6%) and somewhat larger magnitude shrinkage (3.0%) of global GDP in 2030, versus business-as-usual, for different paths toward stabilizing the atmospheric concentration of CO2 at between 1.6 and 2.5 times the level before the industrial revolution.
IPCC, 2007, Summary for Policymakers, in Metz, B., O. R. Davidson, P. R. Bosch, R. Dave and L. A. Meyer (eds.), Climate Change 2007: Mitigation. Contribution of Working Group III to the Fourth Assessment Report of the Intergovernmental Panel on Climate Change (Cambridge University Press, New York).
Much relevant work has been done in Germany. The German Advisory Council on Global Change also considered various rates and levels of stabilization, finding costs centered on about 0.7% of the world economy.
German Advisory Council on Global Change (WBGU [48]) (Grassl, H., J. Kokott, M. Kulessa, J. Luther, F. Nuscheler, R. Sauerborn, H.-J. Schellnhuber, R. Schubert and E.-D. Schulze), 2003, Climate Protection Strategies for the 21st Century: Kyoto and Beyond.
Comparable estimates - average about 1% cost, as low as 1% benefit and as high as 4% costs - were summarized in Hasselmann, K., 2009, 'What to do? Does science have a role?' European Physical Journal Special Topics 176: 37 - 51.)
Course Summary
Course Summary
Video: Earth 104 Course Wrap Up (3:02)
DR. RICHARD ALLEY: It's a cold day in Pennsylvania and a cold winter in a warming world. Some days this winter, most of Alaska has been hotter than Pennsylvania. Some days, the North Pole was hotter.
And my colleagues working in Antarctica had warmer temperatures than we had here. The global warming is only about a degree so far, and that's small enough that we do have record lows. But it's enough to validate our scientific understanding, which shows, with high confidence, that if we keep burning fossil fuels and releasing the CO2, we face much larger climate changes than what has happened so far.
A little warming, winners and losers. A lot of warming, more and more losers. It gets harder and harder for us. The snow, we knew it was coming because we had a good weather forecast. We know when the hurricanes or typhoons or tornadoes, when floods and heat waves and cold snaps are coming because weather forecasts are good. They're not perfect, but they give us information we can use.
Weather is one roll of the dice. Climate is the average of a bunch of roles, but otherwise, they're often done by the same companies, the same government agencies, people in the same departments and universities, people trained in the same ways using similar or the same tools, and climate projections are skillful, too. They don't tell you what to do, but they do tell you what you can do. And we have very high confidence that, if we use the climate projections together with what we care about and where we want to go, that we can make a brighter future. If we release the CO2 from all our fossil fuels to the air-- burn before we learn-- we face a terrible energy crisis in a world that's much harder to live in. If we used the scholarship, the knowledge of sustainable alternatives, we face a world that can affordably power everyone almost forever.
Since our ancestors first started burning trees faster than they grew back, we have not been able to make a sustainable energy system and now we can. Speaking for the instructional team, we hope you've learned a lot from this course. We hope you've enjoyed what you've learned and that it's useful to you, and we hope that you see the remarkably bright future that awaits all of us. Thanks for coming.
Twelve modules later, we come to the end of the course. We hope that you are energized by our journey together.
Energy is hugely important to us. Quite literally, without external energy sources, most of us would be dead.
We have a long history of relying on an energy source, using it much more rapidly than nature supplies more, suffering as the resource becomes scarce, and then figuring out a new source.
We now rely on fossil fuels for roughly 85% of our use, mainly oil, natural gas, and coal, and some people are working hard to expand fracking to retrieve more oil and gas, and to expand to tar sands, oil shales, and clathrate resources. If we succeed, the total amount of fossil fuel that we can burn is much larger than the amount already burned, but fossil fuel still is likely to become scarce, perhaps late in this century, or perhaps another century or so in the future.
Physics, known for more than a century and really refined by the US Air Force after WWII, gives us very high confidence that the CO2 from fossil-fuel burning is having a warming influence on Earth’s climate. The warmer air picks up and carries along more water vapor from the vast ocean, and melts reflective snow and ice, both amplifying the warming. The ongoing warming we observe, and the history of Earth’s climate and CO2, confirm the physics.
If we burn much of the remaining resource of fossil fuels, we have high confidence that we will cause much larger climate changes than those that humans have caused thus far. Small changes bring winners and losers, but as the changes move well outside experience, losers are projected to grow to greatly outnumber winners. And the uncertainties are mostly on the “bad” side—we don’t see how turning up CO2 can bring paradise, because building something good takes getting many things right, but we can see how too much warming could kill the crops that feed us or even kill unprotected people in the tropics, or in other ways cause huge problems.
Fortunately, we have vast renewable resources available with wind and sun, especially able to supply far more energy than people use, almost forever. The extra costs of such a system are estimated as being a small fraction of what we spend on energy now, perhaps 10%, or 1% of the world economy, with the possibility that additional discoveries will make the renewable sources even cheaper.
Economic analyses show that starting now to reduce fossil-fuel use is economically beneficial. The optimal path involves small actions now that increase slowly but steadily into the future.
Many policy options exist to achieve this. Economists are especially interested in taxing things we don’t like, such as climate-changing greenhouse gases, instead of things we do like, such as our paychecks. Such a “tax swap” may grow the economy a little faster than “business as usual”, even if the benefits of avoiding climate change are ignored.
Actions to reduce climate change, if taken in an economically efficient way, are also expected to improve national security, maintain or increase employment, clean the environment, save endangered species, reduce external damages of our energy system, reduce economic costs of energy-price fluctuations, and allow behavior more consistent with the golden rule.
A shift from fossil fuels to renewable energy sources will undoubtedly shift money around the economy, benefit some people more than others, hurt some people more than others, and otherwise cause many stresses and disruptions. Some of the people who fear that they will “lose” during the changes are vocal in opposing change and are likely to continue to be. This discussion probably will continue through our whole lives and through future generations.
Even if we start to shift away from fossil fuels now, the world is likely to need petroleum engineers and seismologists for a long time in the future. The economically efficient path is slow in part to reduce the damage of firing workers or throwing away valuable investments.
We can see the way to a sustainable energy system, powering everyone on the planet almost forever. And that is a powerful vision of a bright future. We hope you have enjoyed exploring the scholarship of energy and environment, and that it helps you in your future.
Capstone Project
Capstone - Roadmap to a Sustainable, Prosperous Future
This is where you are given the freedom to put it all together and craft a roadmap for a sustainable, prosperous future. We’ll pretend you have been granted the authority to completely control global carbon emissions and your job is to put together an emissions scenario for the next 200 years that accomplishes 4 things:
- Keeps the global temperature change below 2.0°C (relative to pre-industrial, so about 1°C above the present temperature).
- Meets the energy demands of the world’s population.
- Leaves us in the year 2200 with at least another 100 years worth of fossil fuel carbon.
- Minimizes the per capita costs (combination of climate damages and costs related to shifting to other forms of energy). We’ll assume that the plan that costs the least will leave more money for economic growth and prosperity.
Follow the directions in Steps 1-6 and then cycle through these steps until you find your ideal scenario, then proceed to Step 7 and complete the project by making a poster. The poster will illustrate and explain your plan using a combination of graphs and text — it is the kind of thing that you’d expect a classmate to be able to understand in 10 minutes of study. There is an example of what this might look like in Step 7.
Submitting your Assessment
Submit your assignment in the Capstone Dropbox in Canvas. You can save as a PDF file (this can be done from Powerpoint), a regular PowerPoint file, or as a Google Slides file.
Grading and Rubric
| Description | Possible Points |
|---|---|
| Clarity of graphs and captions for graphs. The captions should explain what is plotted and what the units are. Recall that the goals of this course include developing the ability to interpret plots of data and to explain and understand the different units represented by the data — so you should keep this in mind while writing the captions. | 10 points |
|
Clarity of explanatory text. The graphs should be linked together with some explanatory text that explains how things are calculated, what assumptions you’ve used, and why they are reasonable assumptions. There should also be at least one short paragraph that sums it all up, explaining why this is the best roadmap. This explanatory text is the way that you will demonstrate a range of abilities that align with the goals and objectives of this course, including: the ability to explain scientific concepts in language that a non-scientist can understand; your systems-thinking knowledge, talking about feedbacks and interconnections between different parts of the system — how climate, energy, and economics are intertwined. We expect you to also convey your knowledge of the policy options that would be needed to make your roadmap a reality. |
20 points |
| Overall layout. There should be a clear flow of logic in the way the poster is laid out. Following the steps laid out in the process will help with this. | 10 points |
| Bonus There is a bonus for the roadmap that comes in with the lowest per capita total costs, using assumptions that are clearly justified. | 10 points |
Step 1
Step 1
Instructions
Open the model [49]. Create a carbon emissions history that keeps the temperature below 2.0°C. If you just run the model as is, you'll see that global T change rises to about 4.5°C, so you need to reduce the carbon emissions by clicking on the graphical icon to the right and changing the curve. You'll probably have to try several versions of this until you get the temperature change to stay below 2°C. The video below, Capstone Project Step 1 Instructions, will show you how to do this. Please watch the video before doing anything with the model or answering the questions below.
Video: Capstone Project Step 1 Instructions (4:06)
PRESENTER: The first thing to do in this capstone project is to find a carbon emissions scenario history that keeps the global temperature down below three degrees. So this model comes loaded with this carbon emissions history here, which is the red line here. And you can see that if you look at the plot here the temperature actually rises too high in the center area, 4.5 degrees. So you go in and you change this. Let's lower this emissions history. We'll do something like this. Doesn't matter how, we're just fiddling around here.
OK, and then you run the model like that and see what happens. And so it looks like here we've kept the temperature-- we're getting a little bit closer here so 3.22. Still too high in the emissions. So you have to adjust the emissions history until you get the global temperature down below three degrees warming. And then once you've done that, you want to make sure that this emissions history has left us with enough fossil fuels that we could continue this level of emissions for a specified period of time.
So all you have to do there is to take the total amount of fossil fuels left over, and that would be this pink curve here. It's the second time I ran the model. We were left with 2,400 gigatons of carbon, which is quite a lot. And if we were to look at the final emissions right here at about two, so with this rate of burning, two gigatons of carbon per year, we've got 2,400, we've got about 1,200 years of time. So we definitely have left ourselves plenty of fossil fuels, so we can rely on them to a limited extent for a very, very long time indeed. So this is an OK and acceptable scenario from that standpoint.
So this is step one of this process. Once you've done this, you go on to step two and there will be another video that will explain how to do that.
Step 1 Deliverables
NOTE: Skip these deliverables until you've cycled through Steps 1-6 and found your ideal scenario. Then produce the following:
A copy (screen shot) of the graph showing the carbon emissions and the global temperature change (page 1 of the graph pad). This will get pasted into your summary poster.
A brief statement demonstrating that this emissions history leaves us with enough fossil fuels left to last another 100 years. This too will be included in your summary poster, positioned next to the graph described above.
How do you do this?
Take the ending amount of carbon in the Fossil Fuel reservoir (page 11) and divide it by the ending emissions rate (this will be in Gt C per year) — the result will be in years and is the time past 2200 when we would run out of fossil fuels.
Step 2
Step 2
Instructions
Next, choose the mix of fossil fuels you will use by adjusting the fossil fuel fractions in the pie diagram to the right (move the small white circles around to change the percentages). Recall that each of these three forms of fossil fuel emit different amounts of carbon per unit of energy produced. Coal emits the most carbon per unit of energy, while gas emits the least, which means that if you have allowed yourself a certain amount of carbon emissions, you'd get more energy if you burned natural gas rather than coal. These percentages then determine something called the FF energy intensity (EJ/GT C, shown in the box next to the pie diagram), which is used to calculate the energy we would get from your carbon emissions history. FF energy intensity could be as high as 59 for 100% natural gas or as low as 35 for 100% coal — whatever percentages you use, you should be prepared to explain why you chose them.
These different fossil fuels also have different costs, and so choosing the percentages determines what is called the fossil fuel unit cost (in $Billions/EJ of energy).
Once you make your choice, you have to run the model once to see the calculated FF energy intensity value and the fossil fuel unit cost.
The video below, Capstone Project Step 2 Instructions, will show you how to do this using the controls of the model.
Video: Capstone Project Step 2 Instructions (3:24)
PRESENTER: In Step 2 of the Capstone Project here, we have to make some decisions about the mix of different fossil fuels that we're going to use as our carbon-based energy. And so, the model comes with this little pie diagram, it's showing the present-day distribution of coal, natural gas, and oil. So those are the percentages, or fractions really. And so, you can change this. You can keep this the way it is, or you can reduce it. But if we reduce it, we can maybe get this fossil fuel energy intensity number little bit higher. So, this is the number of exajoules of energy you create per gigaton of carbon emissions. Remember, we've already sort of set, we've determined, in this graphical converter what the carbon emissions are going to be.
And so, the question is, well, how much energy can we get from that, that amount of carbon emissions? That, this is in gigatons of carbon. So, this fossil fuel energy intensity value, the bigger this is, the more energy you get from that. And depending on, because they cost different amounts per unit of energy, we're going to end up with a different fossil fuel unit cost. So, you can see presently it's 18 dollars and 5 cents, not dollars and five cents but it's in, its billions of dollars per exajoule of energy, let’s say. We're going to make some changes here. We’re going to make these changes by sliding these little yellow, or these white circles around, like that. We can, so we can make natural gas a bigger part of this.
Now I'm going to do something radical here and say, I'm gonna just kinda cut coal out entirely. There, I've cut coal to zero. Natural gas I’ve got that at 73. I'm going to bump that up to closer to 80. That's close enough. Now, if I run the model, you will see the unit cost and the fossil fuel energy intensity change. So, we’ll just run the model. You see those values change. So sure enough, I got this up higher, close to the, theoretically this could be as high as 59.
So, I'm quite close here. I've kept some oil here in the mix and it's just because the products of oil, so, gasoline, diesel, kerosene, jet fuel, things like that. Those are, those are pretty useful. They're very portable forms of energy. So, we might want to still have some use of oil, but for most of the other carbon energy, we're going to rely on natural gas, which is cleaner. And sure enough, that brings the cost down quite a bit to $12.91.
We make that change and then that's going to affect how much energy we produce with this amount of carbon emissions. And then we'll look at that a little bit later. But as a product, as a deliverable from this step, you're going to want to take a little screenshot of this pie diagram after you've run the model. You’ve got the new fossil fuel energy intensity and the unit cost here. You can go back to the start here by hitting this little undo button, return button. And there we go, back to the original.
Step 2 Deliverable
NOTE: Skip this deliverable until you've cycled through Steps 1-6 and found your ideal scenario. Then produce the following:
A brief statement saying what value you used for FF energy intensity, and how you chose that value — what does it represent in terms of a mix of coal, gas, and oil? Take a screen shot of the pie diagram and the associated numerical displays of fossil fuel unit cost and FF energy intensity. This statement and picture will be included in your summary report, along with a screen shot of page 2 of your graphs, which shows the total energy demand and how much of that energy comes from fossil fuels and how much comes from renewables. Note that the amount of renewable energy is just the total energy demand minus the energy obtained from fossil fuels.
Step 3
Step 3
Instructions
Next, get the model to calculate how much energy we would need in total. This is easy — all you have to do is choose the global population limit and the history of per capita energy demand and the model combines these. You may choose whatever population limit you like. You may also change the per capita energy demand from the default, but it will cost you money, and you’ll have to keep track of that money (the model will keep track of it for you). The model does this by first calculating the total energy demand without any conservation (called the reference global energy demand in the model), using the default graph of per capita energy demand and the population — then we subtract from that the reduced energy demand (you need to lower the per capita energy demand curve) to give the amount of energy conserved (see page 12 of the graph pad). Next, the model takes this energy conserved and multiplies it by the unit cost of conserved energy, which is 0.5e9$/EJ (McKinsey, 2010) to get the conservation costs. Compare this unit cost of conservation to the unit costs of making energy from different sources by clicking on the Energy Costs button in the upper right of the model window, and you’ll see that conservation is a great deal. There is an upper limit here of 40% reduction from the reference curve, according to estimates from McKinsey (2010), so you can't push this too far. In fact, if you try to conserve an unrealistic amount, the model will override you and keep the actual per capita energy to within the 40% limit. Once you’ve got the total energy demand, the model subtracts the energy production from fossil fuels to get the energy that has to be supplied by renewables (non-fossil fuel sources).
The video below, Capstone Project Step 3 Instructions, will take you through the steps involved in this part of the project.
Video: Capstone Project Step 3 Instructions (4:24)
PRESENTER: In this next step in this project, we're going to calculate the total energy demand. And we're going to do that simply by combining the population part of the model with the per capita energy curve here. So this shows the per capita energy in terms of exajoules of energy per billion people over the history of this model. Runs over about 200 years. And this is a graphical function of time that can be changed, and we'll change that here in just a second.
So if we run this model now, let's go back here to the beginning and run this model in time and see what happens. OK, here's our carbon emissions curve here, here's our global temperatures, so we are getting close to keeping it below three. Now if we go backwards here, here's our graph showing the global energy demand. Also the reference global energy demand. They're one in the same here because I haven't made a change to this curve here.
Also shown on here is zero right now is the energy conserved. So if I go ahead and change this curve here and lower the energy demand, that represents conservation of energy. So let's go ahead and do that. Make a little bit of a change here. Let's say we lower the energy demands through time like this. And on this graph, this line over here at the edge represents the year 2200. This line over here represents the year 2010. Every little increment here represents an additional 48 years, I think. OK, so we can adjust this history.
So I've have made some big steps energy conservation. Let's see what happens and we'll run the model. And sure enough the global energy demand is less than this reference value here. And the difference represents energy conserved. Now this energy conserved isn't free. It comes with a cost. And so later in this model you'll see the costs that are attributed to this conservation of energy.
And you can look at that if you just go back here to page five and you can see this pink line here, conservation costs. It's very, very low here. It looks like a flat line not changing. It's actually changing a little bit, but it still just stays a very, very low. So that's a very modest cost.
The other thing you can do, of course, in adjusting this model is to lower the population limit. So let's lower the population limit from something like 12 to something down near 9. We run the model and you see that everything gets shifted downwards. The reference curve gets shifted downwards, the actual global energy demand gets shifted down, and the energy conserved shifts down as well. So these two controls, population limit and per capita energy, are how you determine what the global energy demand is.
Step 3 Deliverables
NOTE: Skip these deliverables until you've cycled through Steps 1-6 and found your ideal scenario. Then produce the following:
A graph showing the reference global energy demand and actual global energy demand and the energy conserved (page 12 of graph pad), along with the conservation costs.
A graph showing the global energy demand, the carbon-based energy, and the renewable energy (page 2 of graph pad). Both of these graphs should appear in your summary poster.
A brief statement of what you chose for a population limit, and what kinds of challenges (if any) you think might be involved in achieving this population limit. This should be positioned next to the graph above.
Step 4
Step 4
Instructions
Make adjustments to the pie diagram that shows the percentages of different renewable energy sources — think of this as your renewable energy portfolio. The model default shows the current percentages, but you should feel free to change this, with a few restrictions, which you can see by clicking on the button to the upper right of this pie diagram.
- f hydro should not exceed 46% — we just don't have that many more good dams to build;
- f geothermal should not exceed 10% — the really good locations are far from where people live, so we cannot rely too much on this
- f solar, f wind, and f nuclear could each theoretically be 1.0, which is 100%
The percentages you choose also determine the initial unit cost of renewable energy — each form of energy has a different unit cost, and the percentages you choose are combined in the model to give you the overall average, which is shown in the blue box to the upper left of the pie diagram. The estimated costs of each type of energy can be seen by clicking on the Energy Costs button, which shows:
| Wind | 3.6 (drops by 15%/yr) |
|---|---|
| Geothermal | 11.9 |
| Hydro | 5.5 |
| Solar PV | 6 (drops by 20%/year) |
| Nuclear | 31 |
| Oil | 24 |
| Coal | 17 |
| Natural Gas | 10 |
The model assumes that the costs of geothermal, nuclear, and hydro are all constant over time, but the costs of wind and solar decrease over time, following an exponential function that is based on the recent history. These costs are the levelized (life-cycle) costs that we covered in Unit 2.
The key thing for us is the difference in cost between the various renewables and the fossil fuels. For example, if we wanted to switch 500 EJ of energy generation from fossil fuels to nuclear, this would cost us 31-18=12 \$billion per EJ, which is \$6 trillion more. Of course, money spent doing this would reduce the money spent on climate damages, so it might be a good thing -- and you can see if it is good thing by running the model several times with varying use of renewables.
If you study the energy costs, you might notice that many of the renewables are actually cheaper than fossil fuels in terms of energy generation — so why haven’t we already switched? The answer is largely related to the challenges in switching our energy infrastructure around — it will take some bold government leadership and our collective support to take the leap here. In addition, there are significant start-up costs — although with government backing, these costs can be spread out over a long time. We’ll assume that there is a cost to the switch that amounts to \$0.02/kWh, which is \$5.5e9/EJ in 2020. This cost related to switching energy sources is automatically added on to the cost of generating the renewable energy.
See the video, Capstone Step Four Instructions for some guidance on how to do this.
Video: Capstone Project Step 4 Instructions (4:22)
PRESENTER: For Step 4 in the Capstone Project, we're going to focus on the renewable energy sector up here. So, we're going to make some changes here. Or not, you can do it either way. But this is where you determine which of the different renewables, how much the total renewable energy portfolio they make up. So, this is what we currently have, so 45% of our renewable energy is hydro, right now, 28 nuclear, wind is 14, geothermal 7, solar 6. So, the idea is to change these and that mix along with the cost of these different energy sources, which you can see here. That determines the initial renewable energy unit cost. So, it's 12.63 billion dollars per exajoule of energy right now.
So, there are some limits here to these renewable fractions. You can find out about these. F hydro shouldn't exceed 46%. That's because there just aren't that many more big, highly productive dams that we can build. We've already dammed up the rivers in the best places, in general. So, it can grow a little bit, but not much. The geothermal shouldn't exceed 10%. It's geographically so limited that it's not going to be a huge player in the future. But solar, wind, and nuclear could each theoretically supply a 100%. But then, you know, whether or not you want to do that sort of depends on the costs.
So, look at the costs. Do you... nuclear is pretty expensive, 31 billion dollars per exajoule. Do you really want to have that much nuclear energy in your portfolio? Well, there might be some reasons have some, but it is expensive. So, how to make those changes? You just move these little white circles around. So, I'm going to reduce my nuclear here, just to show you this, I'm going to reduce that to maybe 6%. And geothermal, I can't have it be more than ten. But I kind of like geothermal, it is pretty inexpensive, so I'm going to keep that at ten. That's a good sort of constant steady supply. I'm going to keep hydro pretty much where it is. And then I'm going to split the remainder in terms of solar and wind. And I get those kind of close to each other. They're roughly about there. And the reason for doing that is that they complement each other, in general, so that during times of the day when you generate a lot of wind power, you don't generate a lot of solar power, and vice versa. So, it makes sense to have those be kind of balanced.
Now you notice I've made those changes. Here's my new renewable portfolio. This initial cost doesn't change until I hit the Run button and we see what happens. So, I've dropped that way down now. So that's 7.17. And so, then when you run the model and you look at things like the energy costs now, those energy costs are going to reflect this initial renewable energy here. If we're going to go way back here, if I go backwards and look at 15, This shows the energy costs changing over time. Fossil fuel energy up here and this is the renewable energy cost. So, it starts off at seven, but it drops to five billion per exajoule over time, just because the model assumes that the cost of wind and solar energy will continue to decrease following an exponential function. So that this is just matching what's happened in recent history in terms of price declines there. So, that's why that price continues to drop in the early stages of this scenario.
So that's, that's what it is. That's sort of the rundown on Step 4.
Step 4 Deliverables
NOTE: Skip these deliverables until you've cycled through Steps 1-6 and found your ideal scenario. Then produce the following:
A brief statement of what you came up with for a unit cost of renewable energy, including what percentages of the different sources you used to come up with this number. Take a screen shot of the pie diagram of renewable percentages to accompany your statement.
Graphs showing your total energy costs, the renewable energy costs, and the carbon energy costs (page 3 of graph pad), and the unit energy costs (page 15 of graph pad). These graphs and the statement above will be included in your summary poster.
Step 5
Step 5
Instructions
The next thing to do is to add up all of the costs related to your plan. The model will calculate the costs due to climate damages using the scheme from the modified DICE model (module 10 summative assessment) to do this. To get the total costs, we assume an economic growth rate (percent growth of gross economic output per year — the global GDP). It begins at $56 trillion per year grows at a constant annual growth rate of 1.5% for this time period.
The model then adds these climate damage costs to the total energy costs (renewables, plus switching costs, plus carbon-based energy) and the conservation costs to get the overall total costs.
For guidance on how to do this step, see the video below — Capstone Step 5 Instructions.
Video: Capstone Project Step 5 Instructions (2:11)
PRESENTER: Step 5 of the Capstone Project, we're going to focus on the total costs of your plan so far. Remember, your plan at this point will have consisted of a modified carbon emissions curve here, a modified per capita energy curve here, possibly a change in the population limit here, a change in the fossil fuel fractions, and a change in the renewable energy fractions.
And so, all of that leads to total costs here in yellow, this is page five of the graph pad, which is really just the sum of all these other curves. Four is the climate damage costs, which are quite high in this scenario, reaching a value of something like almost \$50 trillion by the end of the time, which is significant. If you look at on page nine, the GDP at the end is about \$600 trillion. So, it's you know, a little bit less than 10% of the GDP. It's pretty sizable chunk going to climate damage costs.
So, you take that value and you add to it, the renewable energy cost here - curve two, the carbon energy cost - curve one, and the conservation cost - curve three, which is zero, in this case. Zero because I haven't right now modified the per capita energy demands at all. So, we're not doing anything in terms of conservation. You're going to take a screenshot of this and include this in your, your poster, your presentation of your project and just comment about the relative magnitudes of these different costs, and then we'll consider some of these costs in a different way when we talk about Step 6 as the next thing.
Step 5 Deliverable
NOTE: Skip this deliverable until you've cycled through Steps 1-6 and found your ideal scenario. Then produce the following:
A graph showing the various costs (page 5 of the graph pad) -- the units here are all in trillions of dollars. This graph, along with some commentary will appear in your summary poster. The comments could draw the reader's attention to important things in the graph.
Step 6
Step 6
Instructions
So far, you have gone through the process of designing a pathway or roadmap for the future and calculating the economic consequences of the set of assumptions/decisions that went into the roadmap. Now, the idea is to fiddle around with it to see if you can lower the costs, and remember that the best thing to compare here is the sum of the total costs per capita (in thousands of dollars per person), which is plotted on page 13 of the graph pad. Your best model from an economic standpoint is the one that generates the lowest value for this parameter.
In other words, you return to the earlier steps in this process, make a change, and then compare the costs with your previous version. As you do this, you will learn what kinds of changes lead to lower costs and you will eventually find the best roadmap (and remember that you also have to be able to justify it). One thing that you should do is to see if you can get a better economic result by keeping the global temperature well below the 2°C limit — in other words, go back to Step 1 and alter the carbon emissions curve to give you a lower temperature and then keep all of the other parts of the model the same, then run it again and see if you can get the sum of total costs per capita lower.
For guidance on how to do this step, see the video below — Capstone Step 6 Instructions.
Video: Capstone Project Step 6 Instructions (3:18)
PRESENTER: Now Step 6 of the project is pretty simple. We just turn to page 13 of the graph pad, and we look at the sum of the energy conservation and climate costs per person.
And so, this is going to be in thousands of dollars per person that's added up over time. So, this is a cumulative amount over this 200 year period, roughly. And you can see in our case here we’ve gotten that up to $600,000 dollars per person. And so, you know, you divide that by roughly 200 years and that averages out to like three thousand dollars per person, per year, in all of these costs, so, energy conservation and climate related costs.
So, that's each person's share. And this is the thing that we're trying to minimize, because if we can keep this as low as possible then that leaves more money for the rest of the economy, or the things the economy would do like, you know, health care, education, research, all these things that would contribute to a higher quality of life. So, this is, our goal is to minimize this. And so, you know you're going to include a screenshot of this page in in your project report, your poster, and talk about it a little bit.
But let me just show you what you're going to do. So, you get to this point Step 6, now what you want to do is to make some changes and then compare this first initial curve with something else. So, I'll change the carbon emissions to do something like this, drop off towards zero here shortly. So, if we run it with that and look at this same graph we see, okay we lower it significantly in that case. So, now we're down to 266, so that's better. And then you might, you know you could change the renewable energy portfolio again. You could change the fossil fuel allocations. You could make all these kinds of changes. You could reduce the per capita energy demand, keep that more or less flat, something like that and run it again and you see you get even better.
So, the idea is to is to kind of cycle through effectively Steps 1 through 5 and look at the result here. And so, once you've done this and you get to what is the lowest cost then you're going to make a screenshot of this. You're going to talk about the kinds of assumptions or changes to the model that you implemented to give you the lowest per capita cost at the end of it.
Step 6 Deliverable
After this step, you should have calculated your best roadmap. Include a copy of the graph on page 13 of the graph pad. This should show the plots from several different versions and should highlight the preferred version. There should be a brief statement summarizing what parts of the model you changed to make the different versions.
Step 7
Step 7
Put it all together.
Once you’ve settled on your optimum roadmap, put it all together, into a kind of poster display — a large graphic with explanatory text that lays out your roadmap for the future (you can also submit it as a slide show in Powerpoint). To make this document, you’ll take screen shots of some of the model results, and add arrows and text that illustrate what choices you’ve made and explain your justification for choosing different values and scenarios. An easy way to do this is to use PowerPoint, where you can load, resize, position the screenshots and then add arrows, text, etc. as needed. You can specify the page size and make it very large, fitting everything onto just one slide (it should all be readable when you zoom in) — or you can put the materials onto a series of regular slides. You could do this in other programs too, such as Keynote or Adobe Illustrator, but whichever program you choose, make sure it can save as a PDF file that you will then submit in the Capstone Dropbox on Canvas.