Direct, Indirect and Induced Economic Impacts
Recently, the Tesla Company announced that it would build a giant new factory in the Nevada desert, where it would manufacture batteries on an enormous scale. Because the factory is so large, it’s a good example to use to differentiate between three types of workforce that are commonly used in analyses of economic impacts, like in the Washington Post article or in the other studied referenced earlier in this lesson.
Direct Workforce
Construction workers will be needed to build the Tesla facility, and once it’s built it will need to be staffed with factory workers, administrative assistants, a cleaning crew and so forth. These are all examples of the direct workforce needed to sustain Tesla’s factory.
Indirect Workforce
The contractors hired to build the factory will need, in turn, to contract with land management companies, law firms, and other professionals. These companies will then purchase goods and services from other businesses. When the factory is up and running, the maintenance company hired by Tesla will need to purchase goods and services from other businesses, such as cleaning and plumbing supplies. These are all examples of the indirect workforce that contribute to sustaining Tesla’s factory. A key difference between the direct and indirect workforce is that those in the direct workforce would essentially be working for Tesla full-time. Those in the indirect workforce, such as the owners of hardware or plumbing supply stores, would sell goods and services to those in the direct workforce.
Induced Workforce
When Tesla hires people to work at its factory, those people earn wages that are then spent on other things like entertainment, healthcare and so forth. To the extent that the dollars earned by Tesla workers are re-circulated into the Nevada economy, these dollars help to support other jobs. In cases of a very rapid build-up of industrial activity (as has happened with unconventional natural gas drilling in Pennsylvania, for example), entirely new businesses can sometimes spring up to serve new workers. These are all examples of the induced workforce that might be associated with Tesla’s factory.
Going back to the Washington Post article about the Keystone XL pipeline, it is easy to see how two people talking about “jobs” can mean different things. The Senator in support of the pipeline, who cited a figure of 42,000 jobs, was talking about the workforce inclusive of the direct, indirect and induced workforce. The Senator in opposition to the pipeline who questioned whether a figure of 42,000 jobs was realistic, was most probably talking about just the direct workforce associated with the pipeline.
Measuring the indirect and induced workforce can be tricky as we’ll see, but there is no doubt that these impacts are real. For example, based on a 2011 workforce assessment study conducted by the Marcellus Shale Education and Training Center, bringing a single natural gas well on-line requires approximately 420 people across 150 different types of occupations. Not all of these people are in the field on the well site as full-time employees, in fact only around one of out of every five of these workers are actually at the drill site at some point (and would thus be considered part of the “direct” workforce). To put this in terms of full-time jobs created by a single well over the course of one year equates to approximately 10-13 jobs, with the field construction, drilling and fracturing accounting for about 80% of the jobs. It was estimated that at the height of drilling in the Marcellus shale in Pennsylvania in 2010 that approximately 15,000 direct full-time jobs were generated by the shale industry, with approximately 12,000 of these jobs considered to be new positions created by the industry. The figure below shows in the summary of direct and indirect workforce needs for natural gas wells.
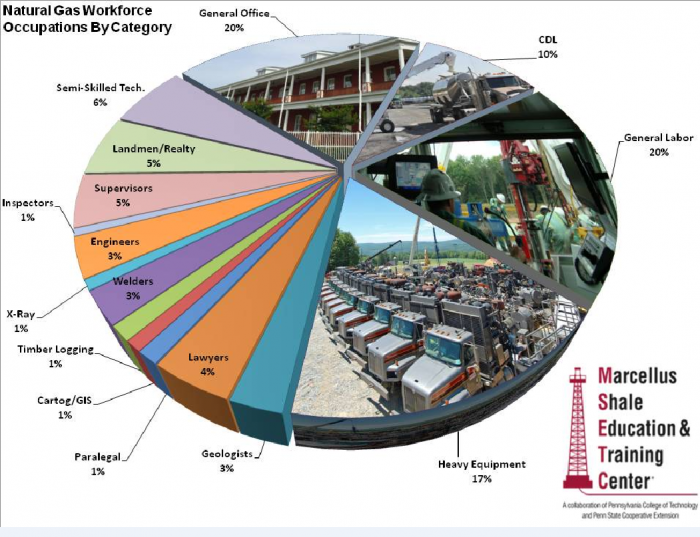
Natural Gas Workforce Occupations by Category
- Heavy Equipment: 17%
- General Labor: 20%
- CDL: 10%
- General Office: 20%
- Semi-Skilled Tech.: 6%
- Landmen/Realty: 5%
- Supervisors: 5%
- Inspectors: 1%
- Engineers: 3%
- X-Ray: 1%
- Welders: 3%
- Timber Logging: 1%
- Cartog/GIS: 1%
- Paralegal: 1%
- Lawyers: 4%
- Geologists: 3%
Some of the induced impacts can be very apparent as well and are often concentrated in service sectors. The figure below shows the growth of tax collections by the hotel industry in three Pennsylvania counties that have been the locus for unconventional gas drilling. The growth in tax collections, at least through the peak in drilling activity through 2013, tracks with growth in the number of wells being drilled and coming on-line in those three counties.
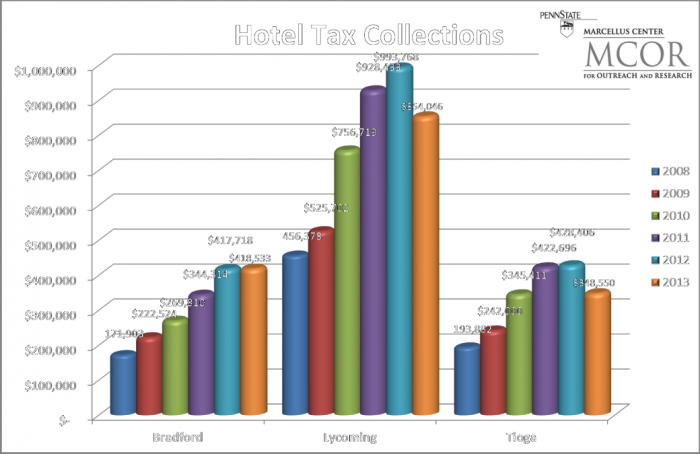
Hotel Tax Collections
Bradford:
- 2008: $171,903
- 2009: $222,524
- 2010: $269,810
- 2011: $344,314
- 2012: $417,718
- 2013: $418,533
Lycoming:
- 2008: $456,378
- 2009: $525,702
- 2010: $756,719
- 2011: $928,433
- 2012: $993,768
- 2013: $854,046
Tioga:
- 2008: $193,882
- 2009: $242,000
- 2010: $345,411
- 2011: $422,696
- 2012: $428,406
- 2013: $348,550
Sometimes the spillover effects from energy project development actually outweigh the size of the direct workforce, meaning that there is a type of multiplier effect to energy development. Economists, in fact, use just this term to describe the size of these spillover effects. The employment multiplier (or just “multiplier” for short) is defined as the ratio of the size of the indirect and induced workforce to the direct workforce. A multiplier equal to one means that the spillover effect is just as large as the size of the direct workforce, and a multiplier greater than one means that the spillover effect is larger than the size of the direct workforce. Multipliers have been calculated for many different studies of the oil and gas industry and tend to range between 1.4 and 1.8 (depending on the location and type of activity). Multipliers above 2.0 are very uncommon.
Dr. Seth Blumsack provides an overview of the direct and indirect economic impacts as well as the multiplier effect associated with shale energy development.
Seth Blumsack: Overall Economic Impacts; Direct vs indirect economics; multiplier effect (3:26)
Seth Blumsack: The growth of unconventional oil and gas, I think it's fair to say, has had a profound effect on the economy as a whole, both for producers and for consumers. So the sector as a whole has added hundreds of millions of dollars in overall wealth to the nation's economy, it has kept energy prices at decade-long lows, which is good for consumers, anybody who drives a car, or has to heat their home, or has to pay for electricity. The process of producing all of this oil and gas from unconventional formations requires a lot of labor -- requires a large workforce -- in order to sustain that level of production. And so the unconventional oil and gas sector has employed thousands of workers to drill, complete, and produce wells, there are additional workers required to construct and operate supporting pipeline and processing infrastructure, and we sometimes call these workforce impacts the direct impact of some economic activity. Then all of those workers who are employed directly by oil and gas companies, they earn money and they go spend it on other things, right? They may have to spend money on lodging when they're at a worksite, they may take some of their money back home and spend it on other goods and services, and so these investment dollars effectively get recirculated through the economy through the purchase of other goods and services. And so when we're looking at the overall economic impact of not just oil and gas production, but of any industrial activity, then we try to count these indirect and induced impacts of these dollars spent by companies that recirculate through the nation's economy.
Dave Yoxtheimer: Can you explain the multiplier effect associated with unconventional energy?
Seth Blumsack: Oftentimes, economists will use a number, called the multiplier, to describe just how much those investment dollars are recirculating. And so the multiplier is usually calculated as the ratio of the direct, indirect, and induced economic impacts, so the direct dollars spent by the company, and then how those dollars recirculate, that as a percentage of just the direct spending by companies. And so for the unconventional oil and gas sector specifically, there have been a number of estimates of these multipliers, but typical numbers will range between about 1.4 and 1.8, and what that means is that every dollar spent directly in investment by oil and gas companies, drilling and unconventional formations, creates a dollar and forty cents of overall economic activity.