How to Establish Causation in Social Science
The “gold standard” for making a causal statement is the experiment. Scientists design a test in which one group is given a treatment of some kind, and another group, called the control group, is given no treatment. After measuring the results for each group, scientists decide whether there is a difference between the two groups.
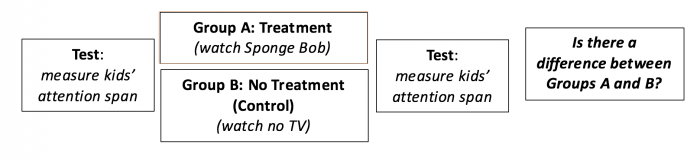
Unfortunately, experiments are difficult to conduct in the social sciences, and may not be possible and/or ethical. For example, if you wanted to investigate whether taking drugs affects school performance in teenagers, an experiment wouldn’t be appropriate. It’s obviously not ethical to give drugs to teenagers for a treatment group.
So how do you establish causality in the social sciences? Let’s go over some common techniques and research design options that help social scientists make causal statements.
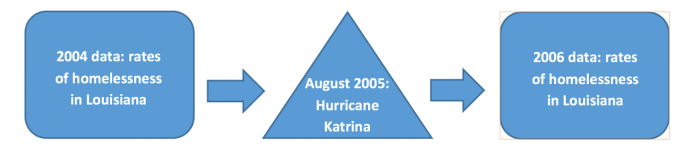
Where possible, compare data from multiple points in time: To understand community impacts, it is best to have data from both before and after the start of Marcellus Shale development. This approach is called longitudinal data analysis and allows researchers to compare community characteristics after Marcellus development to what the community was like before the start of development. For example, researchers studying if crime rates are affected by Marcellus development need to understand the rates of felonies and misdemeanors in the years leading up to the start of development. They then can compare these to the rates after Marcellus development began. The example below uses a longitudinal research design to assess the impact of Hurricane Katrina on rates of homelessness in Louisiana.
Where possible, compare multiple study locations: Some of this early research examined the changes happening in a single place, such as one county. These are called case studies, and they provide great detail about what’s happening in a particular place. They can be helpful to uncover details about how, for example, housing availability is affected by an influx of workers ‘on the ground.’ However, because the number of cases is limited, it is very difficult to control for all the kinds of changes that might be happening simultaneously and say definitively that the cause is energy development.
Ideally, researchers should study places that are experiencing natural gas development AND places without development but that are similar in other respects (such as population size). As a result, the places being studied only differ in one characteristic – one has natural gas development and the other does not. If the places with natural gas development have different outcomes (such as crime rates or mental health problems) it is appropriate to relate those differences to natural gas development. Comparing different places is ideal; however, it can be quite challenging to find matching places such that the only difference is natural gas development. The example below uses a comparative case study research design to assess the impact of a casino on rural communities.
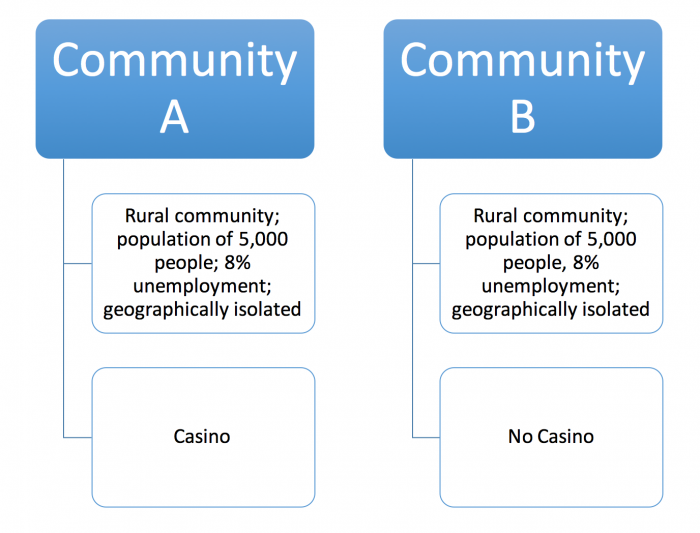
Community A
- Rural community; population of 5,000 people; 8% unemployment; geographically isolated
- Casino
Community B
- Rural community; population of 5,000 people; 8% unemployment; geographically isolated
- No Casino
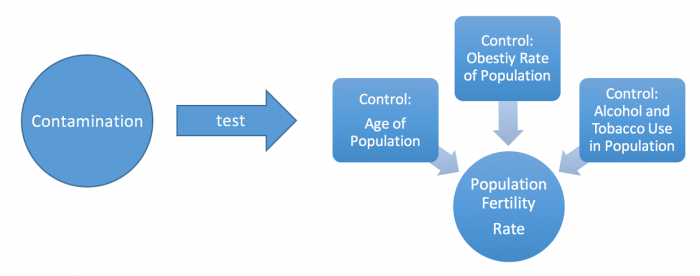
Where possible, control for additional factors: Control for factors that are known to influence the variable you are testing. This ensures that the result that you are measuring hasn’t been affected by additional variables not included in your research design. Researchers can do this using statistical models and programming. The example below uses control variables to isolate the effects of contamination on a populations’ fertility rate.