
SWRO and Energy Costs
Technological advances, coupled with innovative approaches to reduce energy costs (i.e. by using solar, tidal, or ocean thermal energy) have helped to make SWRO a potential solution to water supply or hedge against climate change for large cities like Perth - rather than simply a novelty for wealthy countries. In the 1970s, SWRO costs hovered around $2.50/m3. Currently, costs for the most efficient plants are well below $1/m3, or between ~$1000-2000 per acre-foot (Figures 3 and 4). This is still more expensive than imported surface water or groundwater in most areas (these costs range from $400-1000/acre-foot, depending on location), but in the realm of viability for areas without those sources, or to augment limited supply. The total costs include everything from construction costs for the facility (amortized over its expected lifespan), land access, permitting for discharge and intakes, and operation & maintenance.
Despite its promise, it remains to be seen if SWRO will be a universal or large scale answer to water scarcity. In particular, key challenges include the (still relatively high) costs and associated energy demand; management of the environmental impact associated with intakes and disposal of the brine waste stream; delivery of SWRO water to regions away from the coast; and the up-scaling that would be necessary to meet demand for irrigation or industrial use.
Click to expand to provide more information
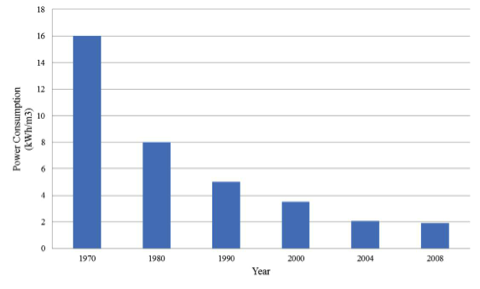
| Year | Power Consumption (kWh/m3) |
|---|---|
| 1970 | 16 |
| 1980 | 8 |
| 1990 | 5 |
| 2000 | ~3 |
| 2004 | 2 |
| 2008 | ~2 |
Click for a text description
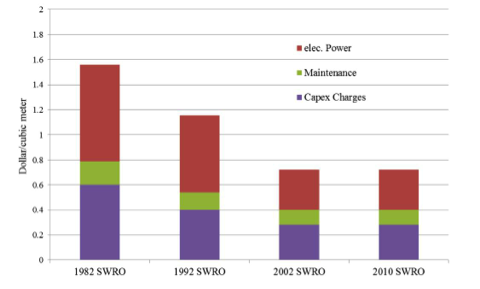
| Year | Electric | Maintenance | Capex Charges | Total |
|---|---|---|---|---|
| 1982 | 0.7 | 0.2 | 0.6 | 1.5 |
| 1992 | 0.6 | 0.15 | 0.4 | 1.15 |
| 2002 | 0.3 | 0.1 | 0.3 | 0.7 |
| 2010 | 0.35 | 0.1 | 0.3 | 0.75 |
Activate Your Learning
Current water rates (cost for the consumer) in Las Vegas are $1.16 per 1000 gallons. From the data shown in Figure 6, calculate the typical cost of SWRO per 1000 gallons for 2010. Do the same for 1982. How much higher are SWRO costs than current water rates in Las Vegas for the two cases (i.e. are they double the cost? Triple? Ten times?). (Hint: You’ll need to convert between m3 and gallons: one m3 is equivalent to 264 gallons.)
1982: $1.55/m3 x 1m3/264 gallons = $0.0059/gallon x 1000 gallons = $5.90/1000gal. This is about 5 times the cost of typical water delivery in Las Vegas.
2010: $0.93/m3 x 1m3/264 gallons = $0.0035/gallon x 1000 gallons = $3.50/1000gal. This is about 3 times the cost of typical water delivery.