The Orographic Effect
To take the concept of relative humidity outdoors, let's consider why it rains in some areas and we have deserts in others. There are two primary reasons for this. Both are related to the transport, rise, and fall of air masses that lead to temperature changes, and ultimately in the amount of water vapor that the air can hold. These are the orographic effect, and atmospheric convection.
In both cases, cooling and warming of air masses occurs because they are forced upward or downward in the atmosphere. The decrease in air temperature with elevation is known as the atmospheric (or adiabatic) lapse rate, as shown below, and is related to decreasing air density and pressure with increasing altitude (as air rises, it expands due to decreased pressure, leading to lower temperature). A typical average lapse rate is around 7° C per km of altitude change. If an air mass begins rising and has not reached the dewpoint temperature, it follows a dry adiabatic lapse rate, with the rate of cooling due nearly entirely to decreasing pressure, as shown in Figure 14. Once the airmass temperature reaches the dewpoint during continued rise, water droplets begin to condense (forming clouds) and the airmass follows a moist adiabatic lapse rate (Figure 14), for which the rate of cooling with elevation decreases because of the addition of some offsetting heat to the airmass from the process of condensation (termed latent heat).

Click to expand for a long description
The orographic effect occurs when air masses are forced to flow over high topography. As air rises over mountains, it cools and water vapor condenses. As a result, it is common for rain to be concentrated on the windward side of mountains, and for rainfall to increase with elevation in the direction of storm tracks. With continued cooling past the dewpoint, the amount of water vapor in the air cannot exceed saturation, so water is lost from the air via condensation and precipitation.
On the leeward side of mountain ranges, the opposite occurs: the air descends and warms. As it does so, it is capable of holding more water vapor (recall the saturation line in the relative humidity plot above). However, there is no source of additional water, so the descending air mass increases in temperature but the amount of water vapor remains constant. Because the air has lost much of its original water content, as it descends and warms its relative humidity decreases. These areas are called rain shadows and are commonly deserts. You’ve probably noticed this same process in action when you heat your house or apartment in the winter – warming the cold air leads to dry conditions – one of the reasons people often put water pots or kettles on their wood stoves.
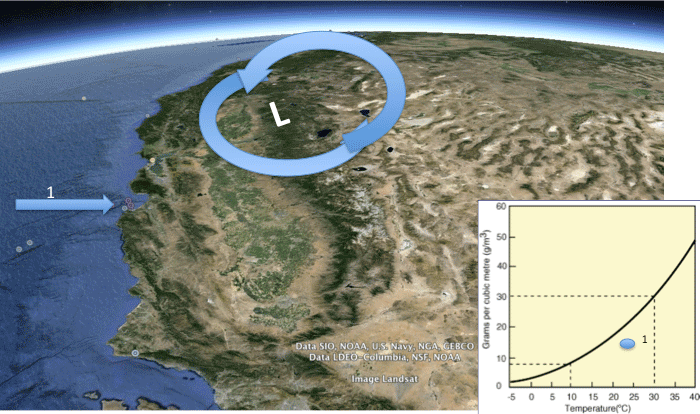
Orographic Effect In Action
The animation below shows an airmass trajectory superimposed on a Google Earth image of western North America. The point of this animation is to provide an explanation of the orographic effect and the changes in temperature and water content of an airmass passing over several mountain ranges. The animation shows the "rain shadow" effect that results in desert regions behind large mountain ranges. An inset graph at bottom right illustrates combinations of temperature (x-axis) and moisture content (y-axis) in grams per cubic meter of the air mass as it passes over various topographic features on the land surface.