Dams and Economic Development
Despite the controversy, in many developing nations, major dam projects remain important engines for economic development and hold substantial potential for renewable energy generation. As of 2012, hydroelectric power constituted as much as 16.5% of global electricity production (and 75% of estimated renewable energy generation) (REN21, 2013). Of this, ~23% is in China, ~12% in Brazil, ~10% in Canada, and ~7.5% in the United States; combined, these four nations generate over half of the world's hydropower!
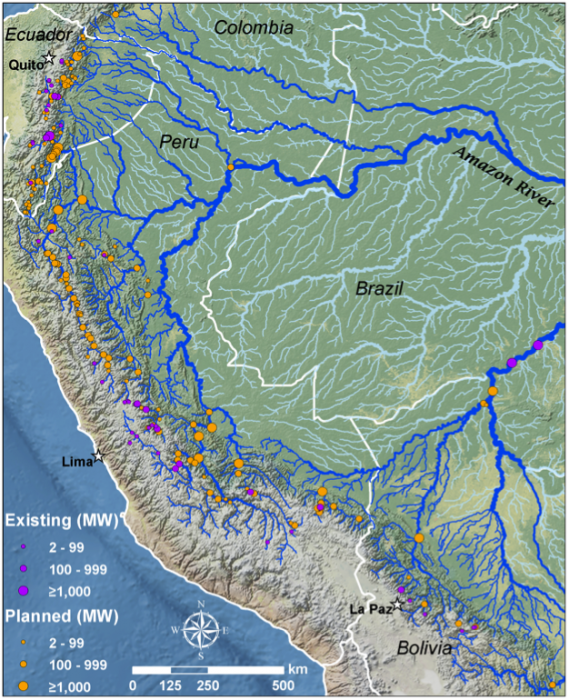
Moreover, globally, estimates suggest that up to two-thirds of economically viable dam sites have yet to be exploited. Undeveloped sites are especially abundant in Latin and South America (79% of renewable water remains unused), Africa (96%), India and China (48% is unused in Asia) (UNEP, 2013). Rapidly growing energy demand in India, China, and the Amazon Basin have driven the construction of hundreds of large dams as of 2002 (Figures 10-11; Table 1). This development may be a harbinger of things to come on the African continent. Africa has the second-highest population (after Asia), and the fastest-growing (See Module 1.3); it also has the lowest per capita energy use (UNEP, 2013). Looking to the future as demand for energy, water, and food in developing nations continue to grow – both per capita and in total as populations swell - it seems inevitable that demand for large dams will persist well into the 21st century.
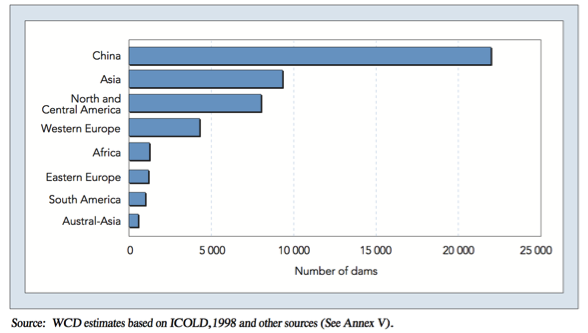
| Region | Number of dams |
|---|---|
| China | 22000 |
| Asia | 9000 |
| North and Central America | 8000 |
| Western Europe | 4000 |
| Africa | 1000 |
| Eastern Europe | 1000 |
| South America | 800 |
| Austral-Asia | 500 |
| Country | Number of Dams | Purpose |
|---|---|---|
| India | 695-960 | Irrigation, multipurpose |
| China | 280 | Flood control, irrigation, power |
| Turkey | 209 | Water supply, hydropower |
| South Korea | 132 | Irrigation, hydropower, flood control |
| Japan | 90 | Flood control |
| Iran | 48 | Irrigation, multipurpose |