Water Use Trends in LA
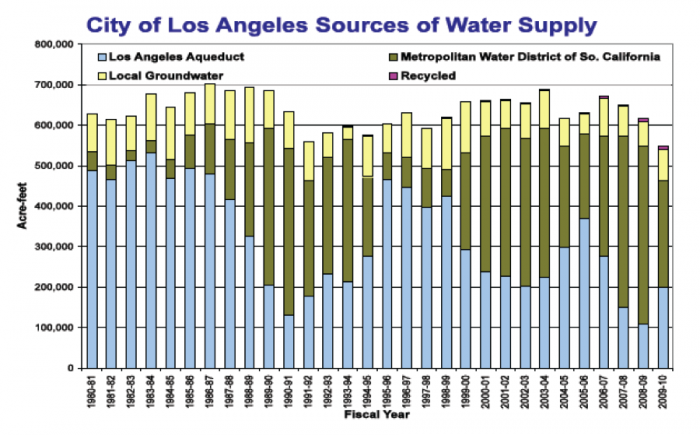
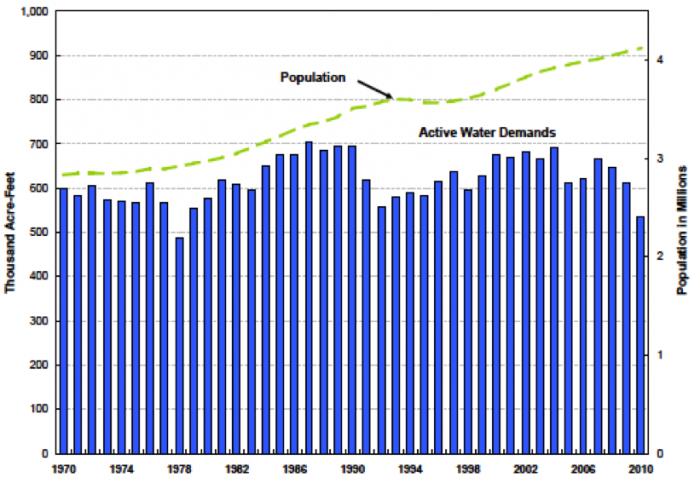
The trend in total water use for the City of Los Angeles (Figs. 3 and 4) is interesting because, although the population has increased significantly since 1970, average demand has remained relatively constant between 600 and 700 million acre-ft per year. This is a testimony to the effects of conservation and reuse because of source limitations (competing uses, drought) and rising costs. Economic downturns may also play a role. Certainly, one way to conserve water in LA is through limiting outdoor water use (car washing, landscaping/lawns). It is estimated that watering landscaping for individual homes is about 38% of total water use. Perhaps, like Las Vegas, LA should further encourage xeriscaping and graywater use for irrigating lawns and golf courses, but more on solutions in Module 8, Part 2 next week.