Now that you have identified the software you want to use to create plots of datasets, I want you to reproduce three plots and submit these to me for review. This activity will be graded based on participation only (either you made three plots or you didn't). I will provide constructive feedback to you about the way your plots look. Even though I will not grade this particular exercise for accuracy, the rest of the lessons in this course (as well many lessons in other courses in the program) will require you to make some plots. Your grades on those activities will in part depend on your ability to produce a clear and satisfactory plot, so consider this exercise free practice.
Reproduce 3 Plots
Directions
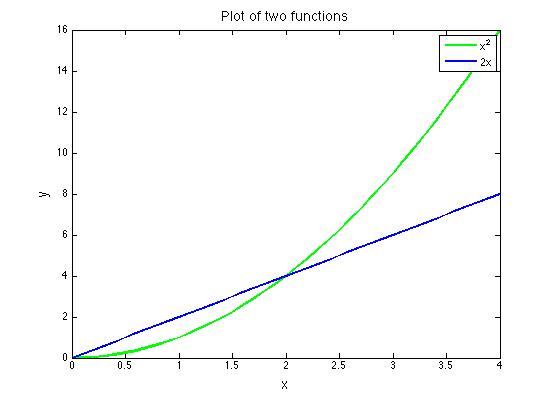
Below is the first plot you have to reproduce. Graph the functions y = x2 and y = 2x on the same set of axes. The satisfactory plot will include: a title, labeled axes, axes tick marks and labels, two different line styles (doesn't have to be color) to differentiate the functions, and a correct legend identifying the two functions. All fonts should be large enough to be legible. You may choose the range of your axes, the aspect ratio of your plot, and the line style of each function.
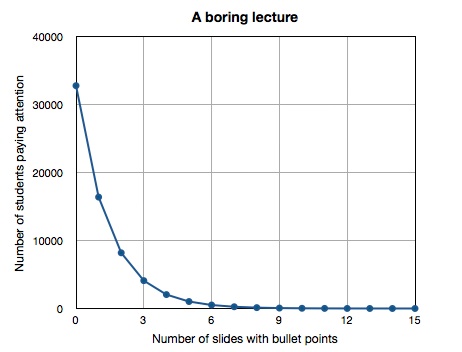
Next shown is the second plot you have to reproduce. When I was in grad school we joked that when a scientist gave a presentation, every equation shown would cause half the audience to stop paying attention. I have noticed this is also true of students attending lectures in which the lecture consists entirely of powerpoint slides with nothing but text bullet points on them. Let's pretend we are at a boring lecture of this type and the person giving the lecture has 15 slides. At the beginning of the lecture, before any slides are shown, everyone in the audience is paying attention. Each time a new slide full of text bullet points is shown, half of the audience tunes out. How many people would have to be in the audience for there to be one person left paying attention at the end? It's easier to figure this out if you work backward in time. I have included a partial table of values below to get you started. You can continue filling the rest of it out until you get to the zeroth slide.
| Number of slides shown | Number of audience members paying attention |
|---|---|
| 15 | 1 |
| 14 | 2 |
| 13 | 4 |
| 12 | 8 |
This plot should be made on linear axes. The satisfactory plot will include a title, labeled axes, axes tick marks, and labels. Since you are plotting discrete data points, please plot them with a symbol. Since it is understood that each data point follows the previous one in time, you can connect the symbols with a line. All fonts should be large enough to be legible. You may choose the aspect ratio of your plot and what kind of symbol and line style to use.
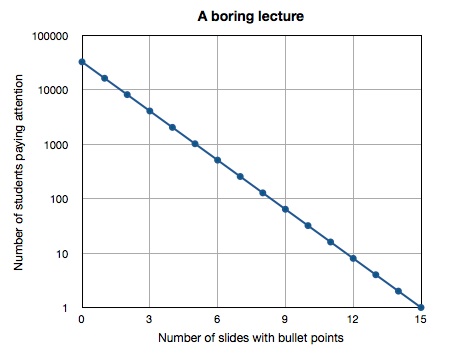
For your third plot, use the table of values you generated when making plot #2 to make the same plot, but using a logarithmic y-axis. The satisfactory plot will include a title, labeled axes, axes tick marks, and labels. Since you are plotting discrete data points, please plot them with a symbol and connect the symbols with a line. All fonts should be large enough to be legible. You may choose the aspect ratio of your plot and what kind of symbol and line style to use. *Alternative: If you have trouble making log axes, you may instead take the log of each y-value in your table and plot the resulting data instead. Your plot should still look like the plot below, but if you choose this option, you must label your y-axis accordingly.
Submitting your work
You may choose to submit these plots one of two ways: you may save them as graphics files (.jpg, .pdf or .tiff) or if you use a Web plotting program that allows you to save your plot as a link, then you may paste the links in when you submit your assignment.
Save your files in the following format:
L1_plot1_AccessAccountID_LastName.doc (or .jpg or .pdf or .tiff).
For example, Cardinals former second baseman and hall of famer Lou Brock would name his file "L1_plot1_lcb20_brock.doc"
Submit your three plots in Canvas. Go to Module One: Preinstructional Activities and find 3 Plots. Click that and once you've done that you will see a "Submit Assignment" button. Press that and get ready to upload your files or paste your link in there.
Grading criteria
As I mentioned at the top of the page, this activity will be graded based on participation only (either you made three plots or you didn't). However, I will provide constructive feedback to you about your plots.