I suggest that this project do something visually interesting with an Earth science data set of some sort. If you are stumped or can't find anything good, let me know and I can help brainstorm.
Below is a video of the example program of an an animation of some foreshocks and aftershocks from the March 2011 Tohoku-Oki earthquake that happened off the coast of Japan. There's a time-elapsed clock up in the corner so you can tell how far along the animation is. I made the circle sizes go as a log scale instead of a linear scale like most people do because this way is actually a more accurate representation of the difference in earthquake magnitudes compared to each other. The fact that they are all represented as circular sources is not accurate, though. One thing you can see that falls naturally with my way of plotting is that you can really see the fact that aftershock locations basically fill up the area swept out by the mainshock. Remember from Earth 520 that one way to tell the areal extent of the rupture of a large earthquake is to see where the aftershocks are.
Watch this video (1:25).
Click here for a transcript of the Tohoku-Oki earthquake video.
Here's my program that makes an animation of aftershocks from the Tohoku earthquake. So up at the top I declare some global variables. Then the set up block is actually pretty big in this program, because I use the setup block for everything that only has to run once so that it's not taking up extra space when I'm trying to run the actual animation. So inside the setup block, I load the font, I read in two different files. One of them has the earthquake data, and the other one has the coastline data. And then here's a line of text that I'm going to just write once, it never changes, and then I actually plot the coastline inside setup too, because that's never going to change during the animation. Then I just use draw to plot all the events. So this piece splits up all the lines of the input file into latitude, longitude, magnitude. And then all of these statements decide what color to make each circle, depending on what the magnitude is. And I have a little fallback statement in case I messed up with my equals and greater than signs up here. Then I just draw each data point with this line. And then this block right here makes a little time elapsed clock up in the corner that runs along and sweeps out a circle so that you can kind of tell when the animation is over. And then I increase this index number by one and run through the line again. So this is what it looks like when it is running. Pay really close attention right at the beginning, because you're going to see a foreshock with its own aftershocks, and then the huge really big event and all of its aftershocks. There's the first-- there's the big event. The size of the circle indicates the magnitude, and the color also indicates the magnitude. Here's this time elapsed clock up in the corner, and when it gets to the end, we'll know the animation's over. It's over now. So that's about a month of data.
Here is the code that was shown in the video:
/**
 * tohokumap
 *
 * Loads a text file that contains three columns (lat, long, mag) of seismic locations
 * from NEIC Feb 10 - Apr 5 of 2011, in a box from 32N - 46N and 14E - 148E (Japan).
 *
 *
 * The magnitude of each event is shown by its radius (exp(mag)/20 = radius in pixels).
 *
 * The "clock" in the corner shows time elapsing as the events happen
 **/

 String[] lines;
 String[] coast;
 int index = 0;
 float magscale = 1.1;

 void setup() {
    size(700, 700); // Each degree of lon/lat is 50 pixels
    background(200);
    smooth();
    //frameRate(30);
    PFont font;
    font = loadFont("AppleSymbols-18.vlw");
    textFont(font);
    lines = loadStrings("tohoku_latlonmag.txt");
    coast = loadStrings("coast30062.txt");
    fill(0);
    text("Animation begins on 10 Feb 2011, ends on 5 Apr 2011", 100, 50);

    // Draw the coastline
    for (int i = 0; i < coast.length; i++) {
       String[] pieces = split(coast[i], ' ');
       float lon = float(pieces[0]);
       float lonMap = map(lon, 134, 148, 0, width);
       float lat = float(pieces[1]);
       float latMap = map(lat, 32, 46, heiht, 0);
       pushMatrix();
       translate(lonMap, latMap);
       stroke(0, 0, 255);
       point(0, 0);
       popMatrix();
    }
 }

 void draw() {
    // Plot the events
    stroke(150);
    if (index < lines.length) {
       String[] pieces = split(lines[index], ' ');
       float y = float(pieces[0]); // latitude
       float yMap = map(y, 32, 46, height, 0);
       float x = float(pieces[1]); // longitude
       float xMap = map(x, 134, 148, 0, width);
       float m = float(pieces[2]); //magnitude

       if (m < 4.0) {
          fill(192, 250, 58);
       }
       else if (m >= 4.0 && m <= 4.9) {
          fill(243, 250, 58);
       }
       else if (m >= 5.0 && m <= 5.9) {
          fill(250, 109, 58);
       }
       else if (m >= 6.0 && m <= 6.9) {
          fill(250, 186, 58);
       }
       else if (m >= 7.0 && m <= 7.9) {
          fill(150, 129, 58);
       }
       else if (m >= 8.0 && m <= 8.9) {
          fill(250, 100, 58);
       }
       else if (m > 8.9) {
          fill(250, 87, 58);
       }
       else {
          println("bummer! I don't know what to do with m = " +m);
       }

       ellipse(xMap, yMap, exp(m) / 20, exp(m) / 20);

       // Make a time elapsed clock up in the corner.
       noFill();
       ellipse(50, 50, 80, 80);

       // Angles start at 3 o'clock
       // Subtract HALF_PI to make the clock start at the top.
       float t = map(index, 0, lines.length, 0, TWO_PI) - HALF_PI;
       line(50, 50, cos(t) * 38 + 50, sin(t) * 38 + 50);

       index = index + 1;
    }
 }
Another point made by this animation is that a magnitude 9 earthquake is really, really, really, mindbogglingly big!
If you are prepared to be watching closely at the beginning, you can see that this earthquake had a big foreshock, too, and that foreshock had a cascade of its own aftershocks before the main event happened.
Here is a video showing just the Tohoku aftershocks animation by itself (0:25). (This video lets you watch the animation without hearing me talk about the details of the program)
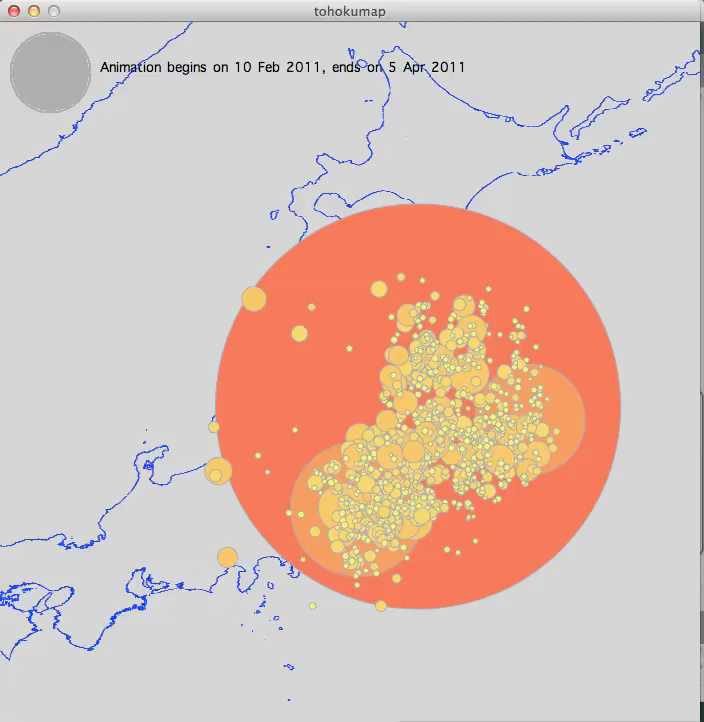
Here's a still shot from the end of the animation:
Turning in your work
Turn in your project to the "small project 2" dropbox. Remember to zip your whole folder and turn the zipped file in if your program requires external files such as fonts, images, or data in order to run.