Electricity is a form of energy transportation and utilization that is central to our way of life today - for most of us, life without electricity would be unimaginable. We all have had the experience of a blackout, and productive life generally comes to a halt when this happens - everything shuts down and we wait for the power to come back on before being able to do almost anything.
Electricity is what we call a "secondary" energy source - it is energy that is released from some other source, and converted by mankind into electricity for transportation and end-use. Aside from lightning and static electricity, there is precious little electricity in nature - no electricity mines or wells - and that which does exist in nature is not very suitable for human use. Instead, some other form of energy is converted to electricity. The most common sources of energy are as follows:
- Chemical energy, released by burning fossil fuels such as coal, oil and natural gas, or biomass such as wood.
- Nuclear energy, which is released by the nuclear decay of radioactive elements such as uranium and plutonium.
- Potential energy, which is released by the forces of gravity pulling something towards earth. The most common form of potential energy that is converted to electricity is that stored in water.
- Kinetic energy, or the energy of some moving particle. The most common form of kinetic energy conversion is the windmill, which converts the energy of moving air into electricity.
- Solar energy, in which energy radiated from the sun is captured and converted to electricity.
It can be generalized that all of these forms of energy come from the sun, some directly and some by very circuitous routes.
Recommended Reading
For more background on the rudiments of electricity, please read the "Electricity Explained" section of the US Energy Information Administration's "Energy Explained" web page. Please be sure to read the whole thing, including all of the subpages, which will give you a thorough overview of most of what we will be talking about in this lesson.
The Electricity Value Chain
There are several steps involved in getting electricity to the end user. It is typically broken up into four steps, as follows:
- Primary energy acquisition,
- Generation,
- Transmission, and
- Distribution.
The first step, primary energy acquisition, refers to obtaining the "primary" naturally-occurring energy that will be converted to electricity. As mentioned above, for the most part in the US, this involves purchasing coal, natural gas, or uranium. These are all large, often global, industries unto themselves, and we certainly do not have time to examine these industries in depth in this lesson. If you are an Energy Business and Finance Major, or if you are enrolled in the Energy & Sustainability Policy degree program, you will learn a lot more about the structure and operation of the primary energy industries. These industries all have their own "value chain", by which I mean steps, stages, or processes that involve some enterprise that adds value to a naturally occurring resource. For example, for gasoline, the value chain looks something like this:
- Exploration: finding oil in the ground;
- Development: drilling wells and building gathering systems;
- Production: operating wells to get the oil out of the ground;
- Field processing: eliminating undesired components, such as water, sulfur, and carbon dioxide, at or near the wellhead;
- Transportation: moving the crude oil from the oilfield to the refinery, usually by tanker or pipeline;
- Refining: converting the crude oil into useful products like gasoline, diesel, heating oil, and jet fuel;
- Distribution: moving the products from the refineries to retail locations; and
- Retailing: selling the product to end-users, who then burn it to obtain energy for heating, transportation, or electricity generation.
Each one of these eight steps involves many more substeps, each of which can provide a person with a lifetime of learning opportunities and employment. Fortunately for us, the electricity value chain is a bit shorter - as listed above, after we have obtained fuel, electricity consists of three things: generation, transmission, and distribution. We will now take a look at the economics of each of these stages, going in reverse order.
First a diagram, illustrating the different parts of the system. This is borrowed from the website of PECO Energy, the utility in Philadelphia, which is part of one of the companies that I used to work for, Exelon.
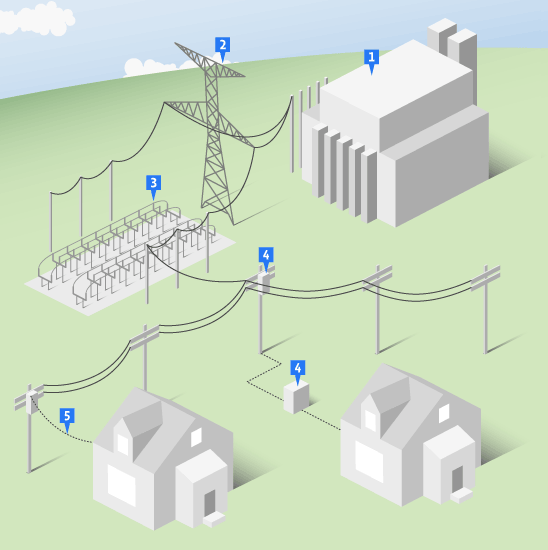
As you can see, there are five numbered parts to Figure 12.1:
- The power plant, where primary energy from fuel is converted to electricity using a generator.
- High-voltage transmission lines, which efficiently move electricity over large distances from power plants to end users. These are necessary because today most power plants are built in remote places far from where people live, since a power plant is seldom a good thing to live beside.
- A substation is the link between the transmission system and the distribution system. It "steps down" the voltage to lower levels suitable for distributing to end users.
- Transformers reduce the voltage further to levels that can be used by appliances and machines operated by end users.
- Local distribution wires move this low-voltage power to end-use locations, otherwise known as homes, schools, and businesses.
Distribution
In the above diagram, parts 3, 4, and 5 represent the distribution system. In economic terms, distribution systems are natural monopolies. If we go back to our discussion of natural monopolies in the section on market power, we know that natural monopolies are usually network systems with very high initial capital costs and a very low marginal cost to serving every extra customer, or in this case, delivering the next watt of electricity. We know that a natural monopoly is an "equilibrium" outcome for this sort of market, and that a single supplier can serve each new customer at a lower cost than if there were competitors. For this reason, distribution systems, such as PECO in Philadelphia, Duquesne in Pittsburgh, ConEd in New York and ComEd in Chicago, are regulated at the state level by public utility commissions. They are allowed to charge prices that will give them an approved rate of return on their assets - typically 8-12%. Thus, there is not really much of a market at work here.
Transmission
Like distribution, transmission is somewhat of a natural monopoly - duplication of service requires large capital expenditures that will be very difficult to recover in a competitive market. Because transmission typically operates over long distances, and frequently over state lines, it is regulated at the federal level by the Federal Energy Regulatory Commission, FERC.
Generation
Unlike transmission or distribution, generation is not a natural monopoly. While the marginal cost curves and, hence, supply curves for transmission and distribution services are generally downward sloping over the applicable range of operation, the same is not true for the consumption of electrical energy. It is instructive to think of generation as the place where energy in the form of electricity is created, and the transmission and distribution systems as networks for delivering. Here, we are talking about the manufacturing and consumption of electrical energy. The supply curve for the manufacturing of electrical energy is not downward sloping, at least not over the applicable range of demand. Instead, the supply curve is very much upward sloping.
In reality, the market for electrical energy, which I will simply refer to as the market for power from here on, is perhaps the closest to a textbook example of a supply and demand diagram as we will see in any market. That is, the supply curves and demand curves are very much observable, and the intersection of the two, which sets the price, is not a result of trial-and-error and bargaining between consumer and seller, but is, in fact, the result of a complicated mathematical operation based upon costs and demand curves that are specified in rather exacting detail by the suppliers and demanders.
In the past, electricity was a "vertically integrated" industry, meaning that one company owned every stage of the production process. Utilities used to own their own generation, transmission, and distribution. However, because generation is actually a competitive market with upward-sloping supply curves, it does not need to be regulated as part of a "rate case," as is the case for distribution and transmission. So, in most of the country, in the 1980s and 1990s, the generation part of the system was sold off or spun off into separate companies. These companies are called "merchant generators" or "unregulated generators," because they are selling at marginal cost into a competitive marketplace, bidding against other firms. They are not natural monopolies that need to be controlled by public utility commissions. This is the case in most of the country, including the Northeast, Midwest, Texas, and California. It is not the case in the Southeast, Rocky Mountain states or Northwest - in those parts of the country, generation is still owned by utilities and still regulated by utility commissions. There is lots of evidence that markets systems for generation deliver lower costs and better service, but many areas are comfortable keeping generation under the control of utility commissions. They are trading off lower costs and potential innovations for stability and less price volatility.
In a competitive market, each generator enters bids for how much of its output power it wants to sell at what price. That is, each generator gives an individual supply curve to the system operator. The system operator is a quasi-governmental non-profit firm that is responsible for collecting all of the bids, arranging them in ascending order of price, and then figuring out which power plants shall be turned on, and when. This is done on a "day-ahead" basis, where generators enter their bids for tomorrow and, after a few hours of computer runs, are told if and when they will be expected to turn on the next day.
When we add together each individual supply curve, we are left with an aggregate supply curve that is called a "generation stack" - literally, all of the generators are "stacked up" in ascending order of marginal cost, and only the lowest cost ones necessary to meet expected demand will be turned on the next day.
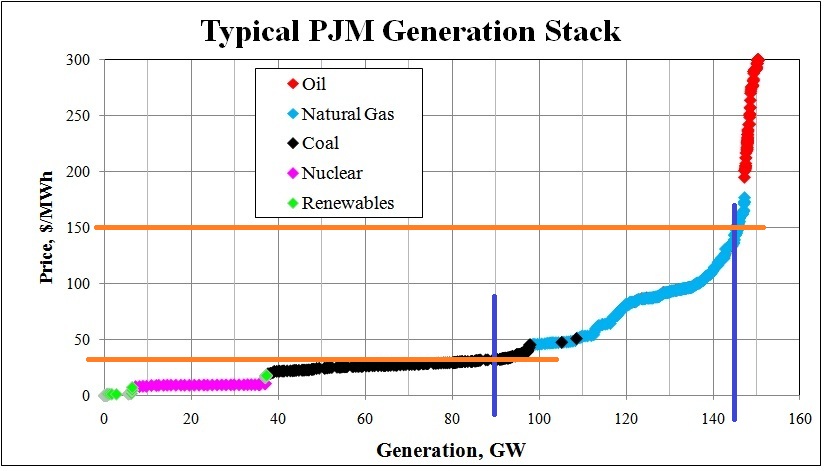
The following diagram is a typical generation stack for the "PJM" electricity market. PJM is the name of the market which started around the Philadelphia area, with the initials "PJM" standing for "Pennsylvania-Jersey-Maryland", parts of which were covered by this market. PJM has since grown to cover a region that spans from New Jersey as far west as Illinois and as far south as North Carolina.
One important thing to note: the above diagram describes what an electricity supply curve looked like in about 2008. Things have changed a lot since then, and we will talk about those changes in the next two sections of this lesson.
In the above figure, each dot represents a power plant, and they are sorted in ascending order of marginal cost. You should be able to see some patterns. In green, we have the renewable generation, which has very low marginal costs. This should make some sense - hydro, solar, and wind power get their "fuel" - rainfall, the sun, and the wind - for free, so the marginal cost of producing a little bit more hydro, solar, or wind power is essentially zero. In purple, we have nuclear power, which has a pretty low marginal cost, because the fuel contains a very large amount of energy for a small mass. The black units are coal-fired. Coal has a variety of components to its marginal cost - most of the cost is fuel, but these plants also have to either buy emissions permits or run emissions-control equipment, which raises costs. In blue, we have natural gas units, which are typically more expensive to run than coal units because natural gas is normally more expensive than coal. At the top of the stack, in red, we have oil-powered units. These are generally very small, so they are not very efficient, and oil costs a lot of money today, so these units can be very expensive - in this case, about 6 to 10 times as expensive as a typical coal unit.
The Demand Curve
In electricity markets, the demand side is called the "load". The load is simply the sum of all demands for electricity in a market at any given time. The demand curve for electricity is considered to be a vertical line, which was previously described as a perfectly inelastic demand curve. Why is this so? When we flip on a TV or computer at home, or when a factory starts a machine, or an office or store opens and turns on the lights, we are assuming that the power will be there, instantly. Because load is changing instantly, we assume that whatever is being asked for RIGHT NOW is a fixed, and not a variable value. Whatever the load is, it must be served, meaning that it does not change according to what the price is. It does change from minute to minute, and hour to hour, and across seasons, but for every interval, it can be assumed constant, and if it is a constant, it will be a vertical line on the supply-demand graph. Thus, the price of electricity varies continuously as the intersection of the supply curve and the continuously-moving demand curve shifts about. In real-life, this calculation is done every five minutes, so in a typical wholesale electricity market like PJM, there will be 12 prices per hour, changing once every five minutes.
Load changes continuously as people turn stuff on and off, as temperature changes, as the natural light comes and goes, and so on. This pattern of changing load is called a "load shape". We can have daily load shapes, weekly ones, and annual ones. The following diagram shows the path of load for three different weeks at three different times of year in 2009.
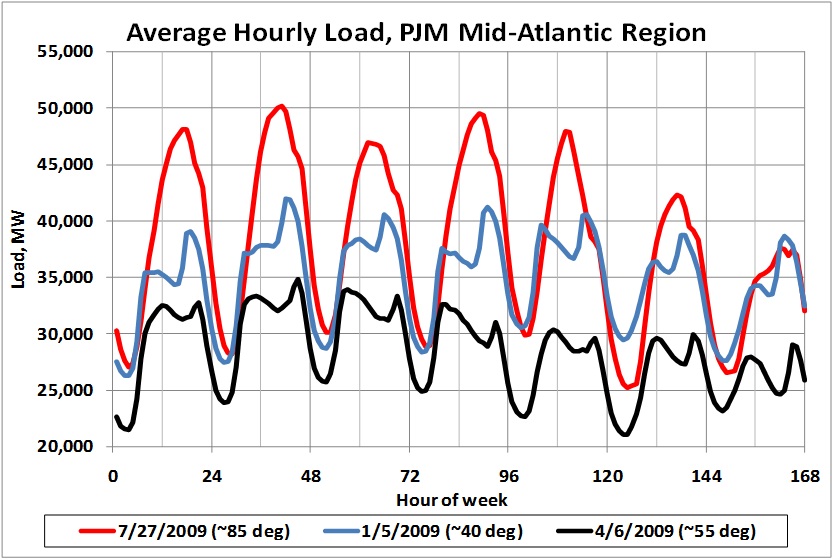
In the above figure, some patterns should be obvious. By the way, this diagram starts at hour 1 of the week, which would be 1 am on Monday morning. Hour 120 corresponds to midnight Friday night. You can see seven distinct peaks and dips, representing high load during daytime and low load at night, between midnight and 6 am. In the winter and spring, we have two peaks each day, representing the morning (breakfast) and evening (dinner) periods. In the summer (the red line), there is a single peak which occurs at about 3-5 pm. This represents the time of day when air-conditioning is most used. In the spring (black line), loads are lower than either summer or winter, as there is less heating and lighting load than winter and less cooling load than summer. Typically, loads are lower on weekends, when offices and schools are mostly closed.
Pricing
Looking at the generation stack, you can see how price is calculated. If load is about 90 GW (Gigawatts), which is the amount of power consumed by about 75 million homes on an annual average basis, we draw a vertical line at 90 GW (in blue, below) and then draw a line across at the intersection with the stack (the orange line). As you can see, the lower orange line intersects the price axis at about \$35 per Megawatt-hour (MWh). Now, if it is a hot summer day and lots of air conditioning is being used, then, for the same system, we might see a load of 145 GW. In this case, draw the blue vertical demand line, and then project the orange line over, and you see we get a price of about \$150 per MWh. This explains why power prices can be so volatile, varying from close to zero at some hours up to, possibly, several thousands of dollars, all within the same day.