
Sometimes, a government wants to help producers by setting a minimum price below which people are not allowed to buy or sell. This is like the price cap in reverse. For example, in Pennsylvania, there are minimum prices on milk, which is designed to help milk producers get a "fair" price for their product. In Maryland, there are minimum prices on gasoline, which are designed to stop "big" sellers from dropping a price so low that competitors would be driven out of the market leaving a monopoly (as you will remember, this is called predatory pricing, and most economists believe that it is basically impossible to make work successfully). In the 1970s and earlier, airlines had minimum price controls, as did brokerages for buying and selling stocks.
Much like price caps, this form of price control often serves to hurt the people it is seeking to help.
Let's look at a supply-demand diagram. In this case, the government sets a minimum price that is ABOVE the free-market equilibrium price.
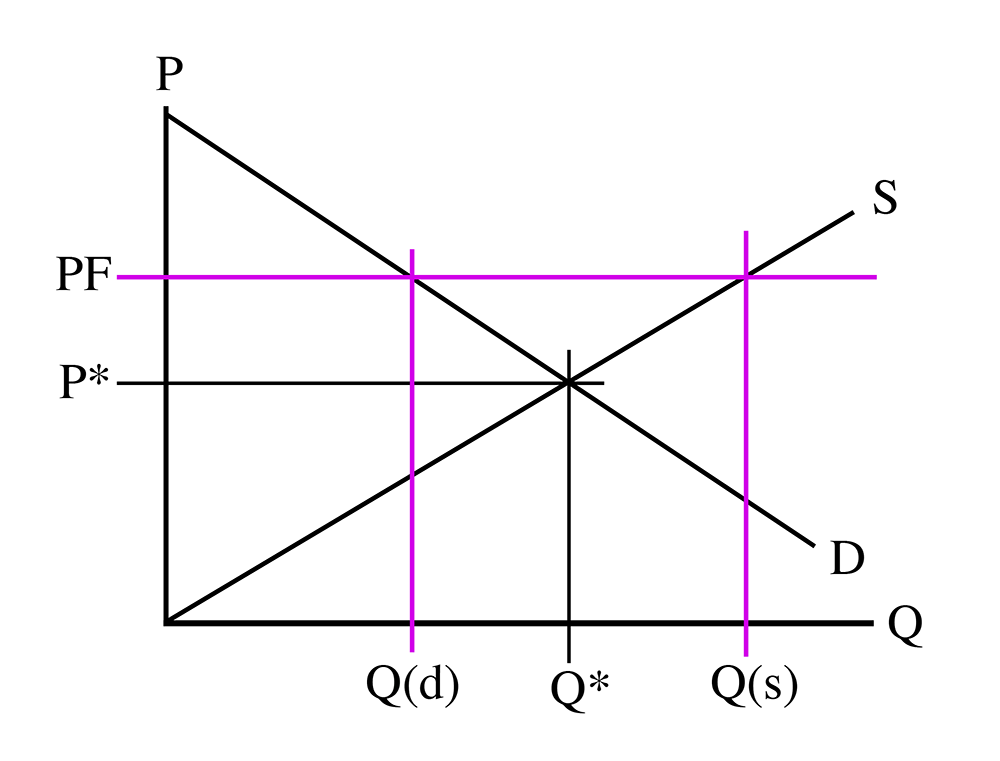
Note: if the price floor is below P*, it will not make any difference to the market. It will be “non-binding.” A price floor must be higher than P* in order for it to have any effect.
Now, in this case, the quantity demanded, Q(d), is lower than the quantity supplied, Q(s). We have more people who want to sell than we do people who want to buy. The new equilibrium is given by (PF, Q(d)). This is the opposite of the price cap: that gave us unsatisfied demand, which we called a shortage. In this case, we have an unsold supply, which is called a "glut."
In this case, instead of consumers competing to buy, the producers will compete to sell. In a competitive market, producers compete with each other for customers by lowering their price. But, in this case, they are forbidden from lowering their cash price below the official floor price. So, instead, they have to find other ways to compete with each other. The most common method is to compete on service. I mentioned the case of airlines being regulated up until the end of the 1970s. After President Carter deregulated the airlines, they were free to compete on price, meaning that they no longer had to try to offer better service than each other. So now we have the common complaint that flying is "no fun" anymore - planes are crowded, seats are crammed together, you get charged extra to check bags, there are no more meals on flights, no more free drinks, no more pillows, and blankets. However, the prices are certainly very much lower. I can fly from New York to Los Angeles for about $300, which is less in nominal dollars than I would have paid in 1978, when a similar flight was about $550. And that was in 1978 dollars, which would probably be worth about $1500 today - and fuel and labor costs were a lot lower in 1978 than they are today. The reason for this dramatic price drop? Competition following deregulation (removal of the price floor).
There are many tactics for competing in non-price ways. This might mean giving better service, as illustrated above; offering free delivery; giving away stuff for free; or selling “under the table” at prices below the “official” price, that is, entering a "black market" situation. Sellers will compete using these non-price tactics until only those sellers to the left of Q(d) will sell. If we fill in the areas on this diagram, it looks a lot like the one for the price cap:
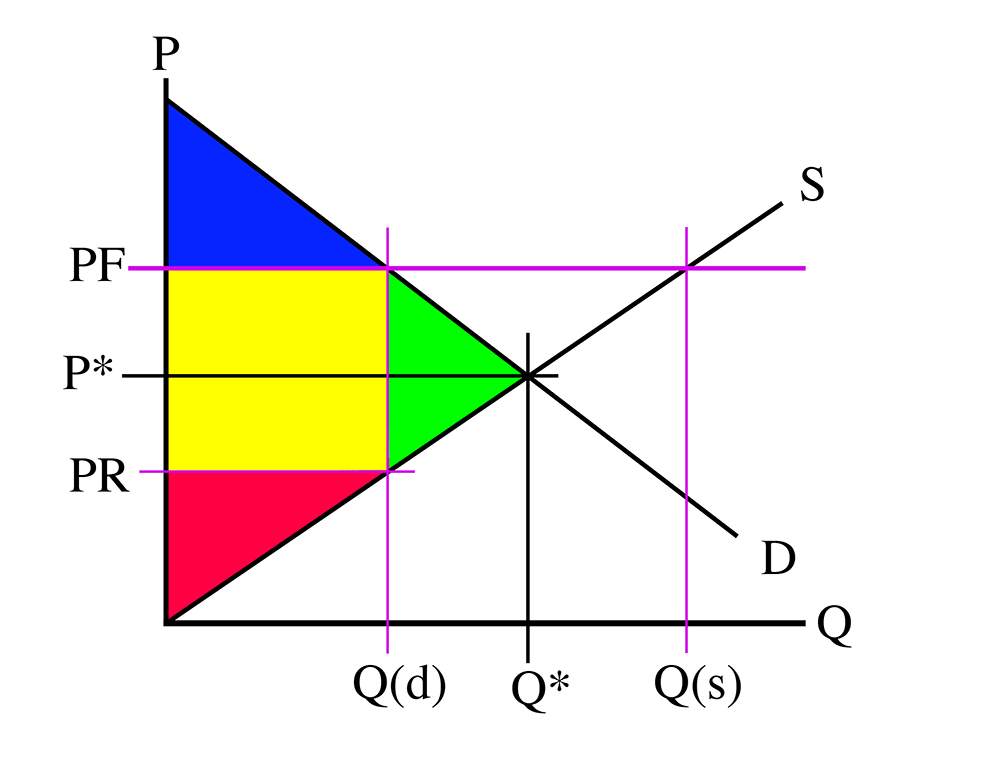
Once again, the yellow area is the “hidden” costs, the difference between the amount of cash the sellers receive, and the wealth they gain after competing. Once again, the real price is actually below the free-market price that the government thought was too low.
Price controls are usually used because of good intentions on the part of the government, but it is clear that they usually end up hurting the people they are designed to help.
Example
Following the previous example, determine the impact of the price floor
We learned that the completive market equilibrium:
If price floor of imposed to the market, then:
can be found by plugging the price floor into the demand curve:
And can be found from supply function by setting the price as :
Price floor causes supply quantity, , to be higher and demand quantity, , to be lower than the competitive market equilibrium. In this case we will have excess supply to the market
In case of price floor policy, Real Price is determined by the supply function and can be found by plugging the into the supply function:
Consumer surplus is the area of the blue triangle:
Producer surplus is the area of trapezoid (red triangle + yellow rectangle):
Deadweight Loss can be found in two ways:
Calculating the area of the green triangle:
Or deducting the TW with price ceiling from the completive market TW:
In case of price floor, consumer surplus decreases and producer surplus increase. But, TW is decreased. Note that we have excess supply in the market. However, price is so high that some consumers can’t buy the product and it creates the Deadweight Loss.
Hidden costs can also be calculated as: