
Reading Assignment
Read pages 72-78 in the textbook, "The Economics of Price Controls" for this section.
When addressing market failure, one common perception of a problem is that the equilibrium price in a non-regulated market is not fair. Now, we have spent a lot of time in this course talking about "positive" and "normative" questions, and the notion of whether something is "fair" or not is manifestly a normative question. We do not have a reasonable and consistent definition of what "fairness" in a market situation is - ask a lot of people and you will get an answer that is something like "well, I know it when I see it." If some member of the political constituency is unhappy with prices, then they will often petition government to do something about these prices. One of the main tools available to a government to change the outcome of a market is a price control.
A price control comes in two flavors: a price ceiling, where the government mandates a maximum allowable price for a good, and a price floor, in which the government sets a minimum price, below which the price is not allowed to fall.
Price controls can be thought of as "binding" or "non-binding." A non-binding price control is not really an economic issue, since it does not affect the equilibrium price. If a price ceiling is set at a level that is higher than the market equilibrium, then it will not affect the price. Think of an example: suppose the borough of State College decides that it wants to make sure that no student is denied toothpaste, and decides that it will set a price ceiling of \$10 per tube on toothpaste. Well, almost all tubes of toothpaste cost a lot less than that - most are about \$3 or \$4 per tube. So setting a maximum price that is above the market equilibrium will not really affect the market equilibrium. The same can be said for price floors that are below the equilibrium price. If the state sets a minimum price of \$1.00 per gallon on gasoline, it is not going to have any effect at current price levels.
OK, so let's not worry too much about non-binding price controls. Let's restrict our thinking to ones that change the price that consumers see in the market. We'll start by talking about price ceilings, which are sometimes called price caps. Price caps are one way to address issues of market power. In situations where it is felt that the price is artificially high because of a lack of competition, one of the actions a government can take is to set a maximum price a monopolist can charge. Let's look at a couple of examples. One of the most frequently cited example is that of price caps on rental accommodations, the most famous case in the US being that of New York City. As the United States entered World War II in 1942, a crash program of ship-building was started in addition to other munitions and arms manufacturing. One of the places where many ships were built was the Brooklyn Navy Yard. The rapid increase in the demand for labor caused a lot of people to move to New York. These migrants needed places to live and soon filled up all of the available apartments in New York. Given that apartment buildings are capital, and cannot be built overnight in response to increased demand, when they filled up, landlords would be in a position of market power and would be able to charge higher and higher prices when every apartment came on the market or when a lease ended. In order to stop this from happening, as a wartime emergency measure, the City of New York instituted rent controls, setting maximum amounts on what a landlord could charge.
It should be noted that World War II ended in 1945. This was 75 years ago, but rent control persists in New York to this day. As an aside, the Federal Income Tax was originally intended to be an "emergency measure" to help pay for the costs of World War I. That war ended a little over a century ago, but the income tax is still with us. Perhaps this is a hint that we should be careful about granting politicians the power to adopt "emergency measures," as they have a habit of sticking around long after the emergency has ended.
You can imagine what these rent caps did. In a market, high prices serve as a signal to producers that demand has increased, and every businessman lives to find an unsatisfied demand. This is where the lure of positive economic profits lies. High prices act as a magnet to bring more supply to a market, and that extra supply competes with the existing supply to help drive prices down to an equilibrium. High rent prices are a signal, telling prospective builders where their product is most needed. This is what Adam Smith was talking about when he coined the metaphor "the invisible hand," guiding the behavior of consumers and producers.
Rent control removes the economic signal that buildings are in demand in New York. For this reason, providers of apartment houses have no incentive to build new apartments. So, we still have lots of workers flocking to the city, all the apartments are full, and nobody has an incentive to build new ones because the prices are controlled. This does nothing to alleviate the shortage of apartments. It just means that instead of apartments being rationed by price, they are rationed by some other method - maybe "first-come, first-served," but more likely some other method. These other methods are what we know as the "underground economy," which is otherwise referred to as a "black market".
In New York, rent control gave rise to a variety of practices, all of which were against the official rules. One was the practice of sub-letting. Say that you are lucky enough to have a rent-controlled (that is, cheap) apartment in Manhattan. You get married and start a family, and you decide you want to move out to the suburbs. Normally, a person in this situation would give up his apartment and buy a house in the burbs. However, it is profitable to officially keep your name on the lease, and instead allow somebody else to live in the apartment. Since apartments are scarce, people are willing to pay more than the market price. So maybe you can keep the lease, charge somebody \$2,000 to let them live in the building, and pay the landlord the rent-controlled rate, which might be \$600 per month. You have a big incentive to keep your name on the lease. Another practice is "key money," in which case landlords take "under-the-table" payments upfront to allow a person to move into a rent-controlled apartment. There are some other side-effects as well: because landlords can raise the price (by a small amount) when somebody vacates the apartment, they have an incentive to have people move in and out as often as possible, and they have no incentive to spend a lot of money on maintenance, as they are not interested in keeping tenants happy - a rather dysfunctional outcome that should never exist in an uncontrolled market.
Another side effect is that we still have a shortage of housing, and whenever there is a shortage, government gets called on to fix the problem. In this case, the City of New York built a lot of apartment buildings, which were commonly known as "housing projects" and quickly developed a reputation as being very unpleasant places to live. So, one government policy designed to alleviate market power led to lots of illegal and inefficient practices, lots of unhappy tenants, and the entry of the government into the housing market in a big way. It is fair to say that this is a case where a government trying to fix a problem has ended up making things a lot worse. Rent control is almost gone in New York, but has proved to be very difficult to phase out.
Anti-gouging rules are another example. In cases like this, sellers are barred from raising prices above some level that is thought to be "reasonable" in unusual circumstances that would normally allow them to raise prices. This topic often arises in the aftermath of natural disasters. Let's say, for example, that bridges to the Outer Banks of North Carolina get wiped out by a hurricane, and it is temporarily impossible to truck supplies to the islands. At the same time, power is out, so water cannot be pumped to homes. In this situation, there would be a large outward movement of the demand curve for water. At the same time, the replacement cost of the water (that is, the marginal cost of the replacement unit) would be very high, moving the supply curve up. Both of these effects should cause the price to increase significantly. When this happens, it is often decried as "greed" in the face of tragedy. In reality, raising the price of bottled water is the signal that tells other firms to do whatever they can to get water to the islands. If the price of a bottle goes up to \$10 or \$20, then some other supplier would hire helicopters or boats to make sure that they could sell water on the island. If the price is capped at, say \$3 per bottle due to anti-gouging rules, then no other company has an incentive to move water to the islands and the shortage persists longer than it otherwise would. Another example: in North Carolina, anti-gouging laws cap the price rises of gasoline when the governor activates the laws. After Hurricane Ike hit the refining belt in Southern Texas in 2008, there was an acute shortage of gasoline in the south. Several gas stations were fined for raising their prices too quickly, from \$2.50 to over \$4. Oddly enough, one station near the Orlando International Airport that always priced its gas at over \$4 per gallon, due to proximity to car rental lots, was not fined, even though their price was as high as the "gouger" stations.
Let’s look at a supply/demand diagram with a price cap.
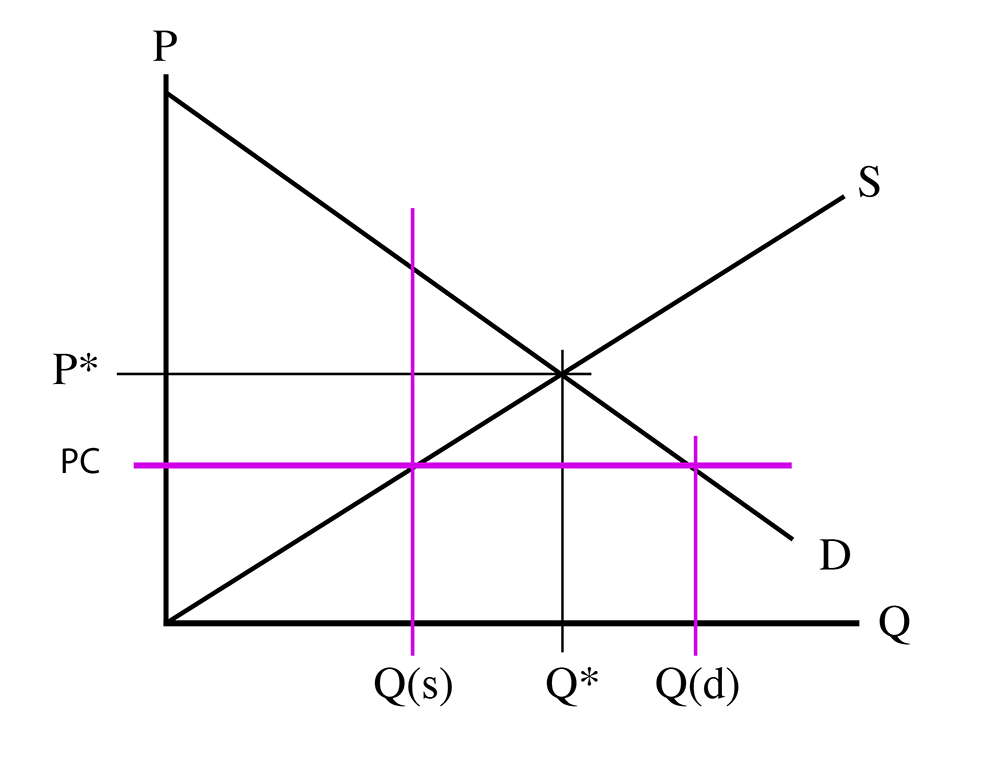
In this diagram, we have a price cap, PC, which is a horizontal line below the equilibrium price, P*. The quantity demanded, Q(d), is the amount at which the price cap and the demand curve intersect. The quantity supplied, Q(s), is where the price cap and the supply curve intersect. From the diagram, you can see that Q(d) is greater than Q(s). That is, we have more people who want to buy than we have people who are willing to sell. This should be obvious – if the price is lowered, more people will want to buy.
So, in this market, the supply is unable to meet the demand. So there is a “Shortage” of the good in question. Only some of the demanders get to buy, but they do get to pay a lower price. We have a new equilibrium, which is defined by (PC, Q(s)), which is at a lower price and quantity than the free-market equilibrium, (P*, Q*)
What about the consumer and producer surpluses?
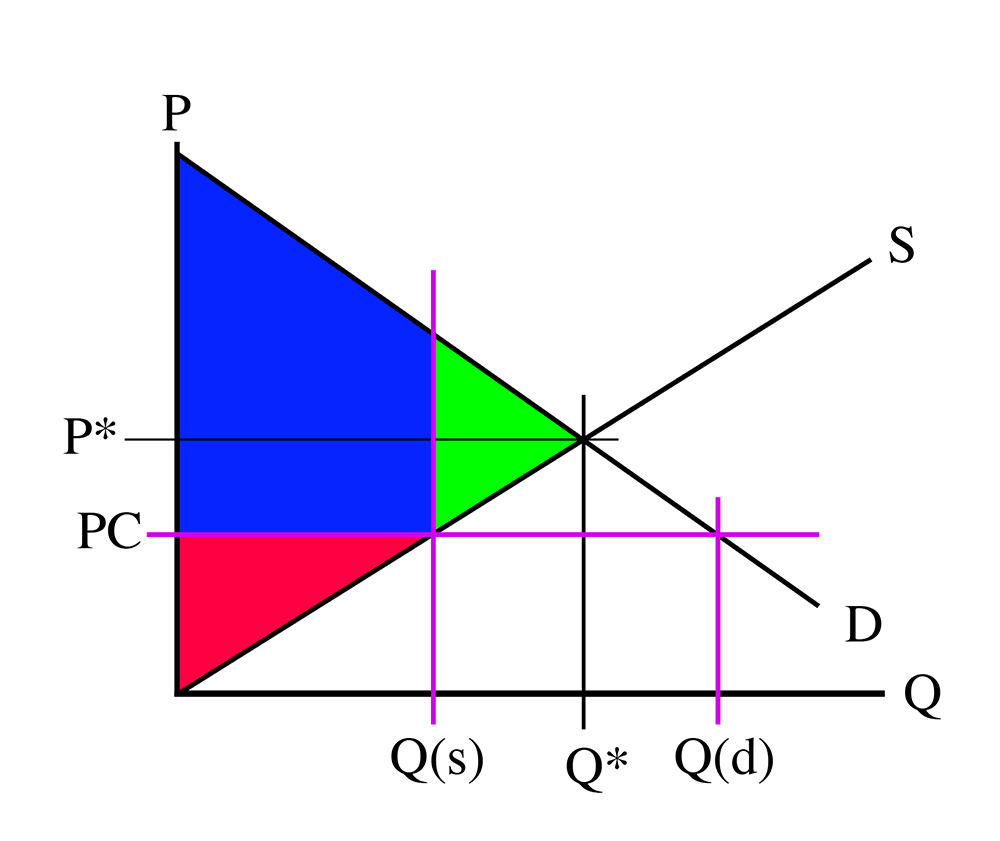
We know that the producer surplus is the area between the equilibrium price and the supply curve. In the above diagram, this is the red area. Obviously, this will be smaller than in the free market. The consumer surplus is the area between the demand curve and the equilibrium price, which is the blue area in the above diagram. We do not know, without numbers, if this is larger than the free-market consumer surplus. But we do see that some wealth has been transferred from the producers to the consumers (or so it seems – more on this later.)
The green area represents the buyers and sellers who would be able to trade in a free market but are unable to in the controlled market. Because they cannot trade, they gain zero wealth from this market instead of some wealth. So, the green area is wealth from trade that is lost to society. This area is called the Deadweight Loss. It is a loss in wealth caused by a price control.
Now, think about the “shortage”. We have more buyers than sellers. Usually, the buyers will compete with each other by offering more money. But they are not allowed to do that here. But they will compete in other ways. They will wait in line longer. They will get out of bed earlier and show up at the shop earlier. They will buy from people on the black market. The people who want the goods the most will compete until they have the goods.
They will use up resources (time, energy, money) in this competition, but those resources will not go to the seller. Instead, they are lost to society. If we look at the following diagram, we will see that the buyers will compete until the price has been driven up to the level called “PR”, the “Real Price.” Only people willing to pay more than PC will end up with the goods. The most they are allowed to pay in cash is PC, but they spend PR. The area between PC and PR is called the “hidden costs” – hidden because they are not observed in the official transaction. They are the costs of competing for the goods and are lost to society.
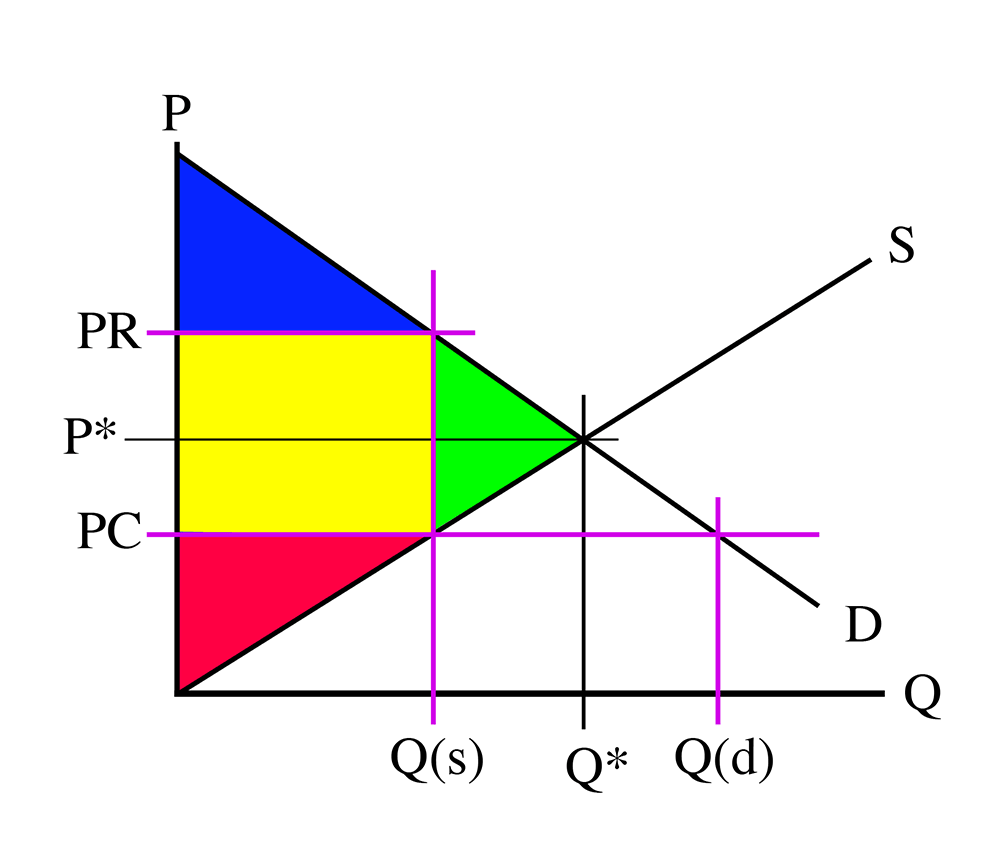
So the “hidden cost” is the yellow part of this diagram. The green is the deadweight loss, and the consumer and producer surpluses are shown in blue and red. As we can see, the “real” wealth, the producer and consumer surpluses, are much smaller than they would be in a free market.
You will also notice that the “Real Price,” PR, is higher than the equilibrium price, P*. The original goal was to lower the price, but we have ended up raising the price. Trying to help consumers by lowering the price has actually raised the price.
Example
Suppose supply and demand functions in a market are given as:
Find the completive market equilibrium price, quantity, consumer surplus, producer surplus, and total wealth.
Determine the impact of the price ceiling
is extracted from supply function by setting the price as :
And can be found from demand function by setting the price as :
As we can see supply quantity, , is less than the competitive market equilibrium, while the demand quantity, is higher.
And Real Price, PR, can be found by plugging the into the demand function:
In order to find the consumer surplus, we need to calculate the area of the blue trapezoid. Please note that is the top right corner of the trapezoid.
Producer surplus will be:
And finally, Deadweight Loss can be found in two ways:
Calculating the area of the green triangle:
Or deducting the TW with price ceiling from the completive market TW:
Hidden costs can also be calculated as: