In contrast to crude oil, natural gas is almost strictly a domestic North American commodity whose price is more influenced by weather and the health of the US economy. Other factors, such as the level of US natural gas inventory, impact prices on a weekly basis. While US economic indicators, such as the stock market, employment figures, housing and, manufacturing indexes, are deemed to be indicative of demand for natural gas, global economies and the US dollar do not have much affect on pricing in this country.
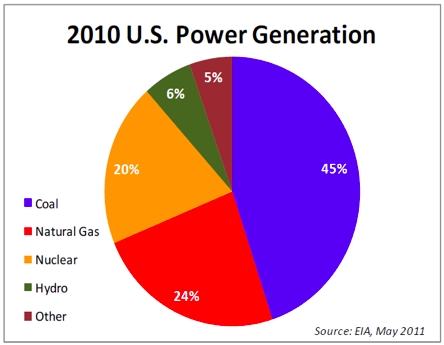
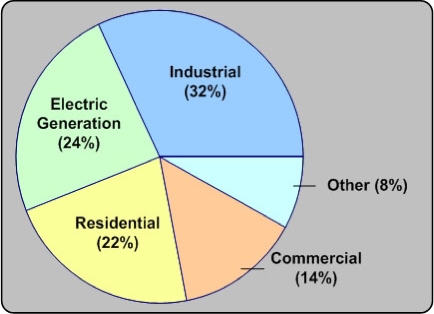
Natural gas is used in more than 50% of US homes for space heating and hot water. In addition, it is the second largest source of energy for electrical generation behind coal (Figure 4) and is widely used in commercial and industrial industries. Figure 5 illustrates the break-down by consuming sector.
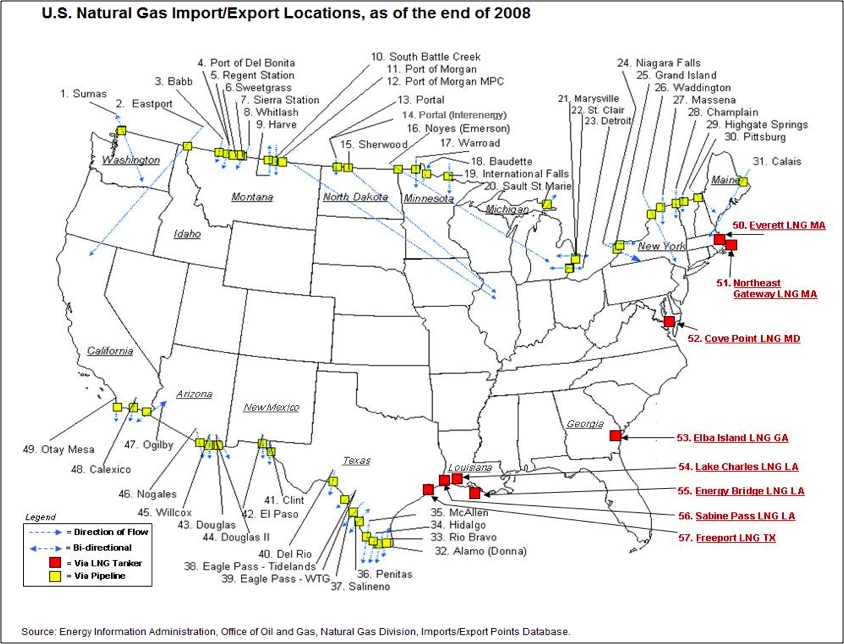
The main sources of natural gas supply in the US are domestic production, imports and, Liquefied Natural Gas (LNG). Canada again represents the largest source of imported natural gas, with Mexico contributing a minor amount. Additionally, there are export points into Canada and Mexico. The map in Figure 6 indicates the major import/export and, LNG import points in the US.
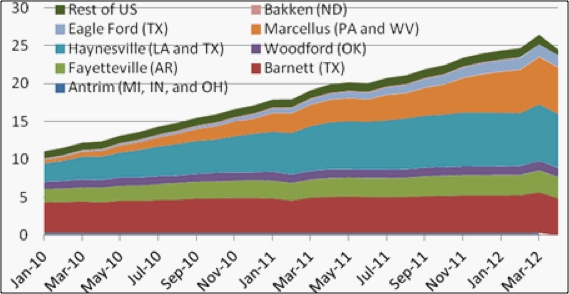
Domestic production in the US has grown dramatically in recent years due to the same advanced technologies that have allowed crude oil production to increase: “3-D” seismology, horizontal drilling and new “fracking” methods. All contribute to successful recoveries from hard formations such as the new “shales.” Figure 7 illustrates the growth in production of the currently active shale basins in the US.
Among the major factors influencing US natural gas prices are:
- Weather – over 50% of American homes are heated by natural gas; hot weather leads to more electrical generation for air-conditioning loads, and natural gas represents about 25% of that market. Hurricanes in the Gulf of Mexico disrupt supply as platforms are evacuated ahead of the storms, and the hurricanes can also damage the rigs.
- US economy - as with crude oil, fluctuations in the economy translate into an increase or, decrease, in energy consumption.
- Production levels vs. demand indicators - statistics showing flowing natural gas are compared with demand indicators to determine if the market is "short" or "long" supply.
- Weekly Natural Gas Inventory Report (Energy Information Agency) - every Thursday morning, the US government releases data on the amount of natural gas that is in the nation's underground storage facilities. Injections and withdrawals from storage are also indicative of supply and demand dynamics.
- Electrical generation “fuel-switching” - a large amount of the country's power plants that are fueled by coal can actually switch to natural gas, but only if prices are competitive.
- Baker Hughes Drilling Report of active rigs - the field services company reports weekly on the number of drilling rigs actively pursuing oil and/or natural gas. The change in number and type impact the perception of supply in the future.
As we explore pricing for crude oil and natural gas in a later lesson, we will consider the major influential factors for each and define their individual impact. We will also have a weekly discussion about the market prices for crude oil and natural gas and the factors we believe affect them.


