Lesson Activity: Technical Chart Analysis & on-going Trading Simulation
Using what you have learned in this lesson, answer the following questions regarding the chart below andsubmit your answers to the course TA.
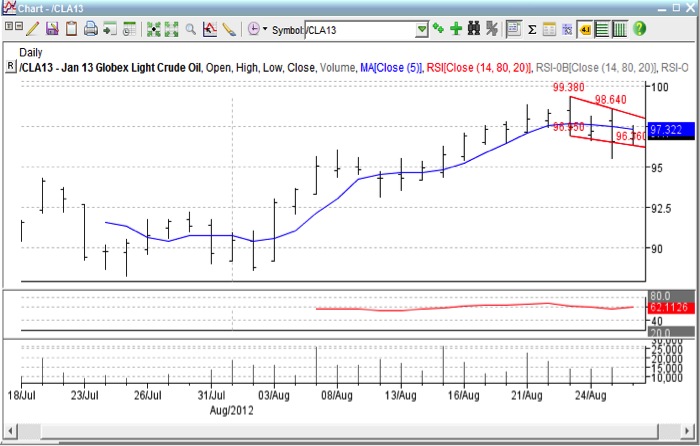
- What type of chart is this?
- What type of price information does it show?
- What is the prevailing trend?
- What does the blue line represent?
- What is the single red line in the second box?
- What is indicated in the bottom box?
- What are the two red lines connecting price points called?
- The point at which the upper red line crosses the right axis is called?
- The point at which the lower red line crosses the right axis is called?
- Is this market “overbought,” “oversold,” “neutral”?
Grading Criteria
You will be graded on the quality of your participation. See the grading rubric for specifics on how this assignment will be graded. Please submit you answers to the TA, Mike McCormick mwm5342@psu.edu.