Exponentially Weighted Volatility
In calculating the volatility, we may prefer to give higher weights to the more recent data. There are many methods of assigning these weights. Exponentially weighted volatility is a common method that uses a decay factor, λ, to apply higher weights to the recent returns and lower weight to the older returns:
Where w is the weight, t is the time and λ is the decay factor. t=0 for today, t=1 for yesterday, and so on. λ is a constant that is defined by the analysts and usually takes a value between 0.99 and 0.94.
For example: Assuming
Today's weight:
Yesterday's weight:
The day before yesterday's weight:
As you can see, older data will have a lower weight (importance).
The average and standard deviation for exponentially weighted values can be calculated as:
Relative Volatility Index
There are many other volatility measures that each give some signals and information about the price movement. Some of these measures might be a bit complicated to calculate. Some of these volatility indicators are provided in the NYMEX chart data, such as the Relative Volatility Index (RVI). Relative Volatility Index gives us an indicator of the direction and magnitude of the volatility.
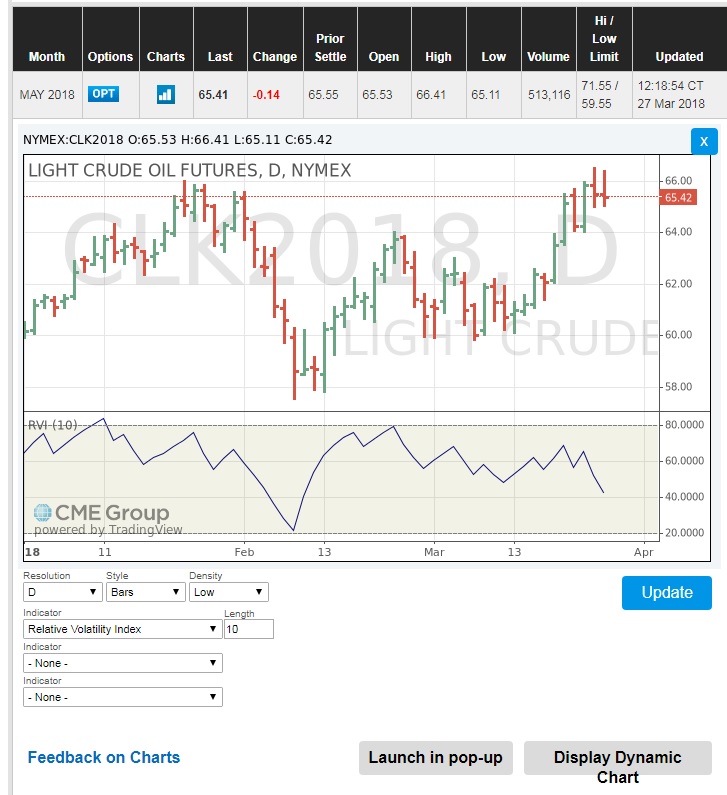
For example, to see the Relative Volatility Index for the WTI crude oil NYMEX futures contracts:
- Go to the NYMEX Crude Oil Futures Quotes.
- Click on the Chart icon on the left side of the “Last” price.
- Make sure the chart is in the Static mode. If not, click on the “Display Static Chart”.
- From the “Indicator” list, choose the “Relative Volatility Index” and click “Update”.
The lower section of the following graph shows the Relative Volatility Index for May 2018 WTI crude oil NYMEX futures contracts. We will learn more about the RVI in lesson 9.