Hidden Content for EBF 301
Meet the Instructor - Jim Falvey
Welcome to EBF 301: Global Finance for the Earth, Energy, and Materials Industries
Hello. My name is Jim Falvey and I will be your Instructor for this course. I am an attorney and an MBA. I have worked in the financial services industry since 1995. A large part of my work in this industry has been in the energy trading arena. Specifically, I was the first General Counsel at the IntercontinentalExchange ("ICE"). ICE is one of two major energy exchanges in the United States. The other is the New York Mercantile Exchange ("NYMEX"), which is a part of the Chicago Mercantile Exchange Group ("CME Group"). I have also worked at the CME Group. Because of my work with ICE and CME Group, I've learned a great deal about the underlying energy industry.
Additionally, through my work at ICE and CME Group, I've had the opportunity to work closely with regulators and legislators on many energy trading policy issues. For example, I've given presentations about the ICE compliance system that monitors for, among other things, "wash trading," to the Commodity Futures Trading Commission ("CFTC"), the Federal Energy Regulatory Commission ("FERC"), as well as the Financial Services Authority ("FSA") in the United Kingdom. I've also participated in Senate "Roundtable" discussions about issues related to regulation of the energy markets.
I currently consult and provide legal advice on a variety of regulatory and compliance issues. Among other clients, I'm working with a start-up hedge fund that is focusing on energy markets. I'm also consulting with a couple of exchanges, as well as an asset manager. Because of the new regulatory world in which we find ourselves thanks to the Dodd-Frank legislation, there is a lot of uncertainty in all derivative markets (over-the-counter and "on-exchange"). Market participants are trying to ensure that they are in compliance with the new regulations (and, in many cases, the regulations are still being drafted by the CFTC and others). Thus, this environment presents lots of opportunities for entrepreneurs, as well as attorneys and consultants.
I graduated from the University of Notre Dame with a degree in Political Science. I then worked for a Member of Congress and attended Georgetown University Law Center, where I received my JD. Lastly, I went to Kellogg School of Management (Northwestern) where I received an MBA.
I have lectured and provided presentations at numerous industry events and forums. From these experiences, I decided that I wanted to teach (preferably at a college or graduate level). So, I'm very excited about the opportunity to work with all of you. I think you'll find this class very interesting. Perhaps you'll even find a career path.
On a personal note, I enjoy sports and music. I've run 8 marathons (but none recently because of some annoying injuries). I hope to be up and running again soon. I've played the trumpet for many years. I marched with the Notre Dame band. The football team was not very good when I was at Notre Dame. Penn State beat Notre Dame regularly - and easily - when I was in school. More recently, I've played in an oldies rock-n-roll band. Aside from singing (mostly background vocals), I've played keyboards and the electric bass.
Please make sure that you let me know a little bit about you. Even though this course is being conducted over the Internet, I want to make this experience as personal as possible for you. Don't hesitate to contact me via email or phone with any questions. I hope you enjoy this class. I look forward to getting to know you.
Meet the Instructor - Jim Jenkins
Welcome to EBF 301: Global Finance for the Earth, Energy, and Materials Industries
My name is Jim Jenkins, and I will be your Instructor for this course. I am currently an Adjunct Professor of Finance at Fairfield University’s Dolan School of Business in Connecticut. You can check my profile at LinkedIn for further professional details.
I spent 30 years in the cash commodities business, primarily trading tropical commodities. At one point or another in my career, I traded cash physicals, futures, options and OTC derivatives, as well as running a futures brokerage, so I have a deep background in all aspects of regulated and unregulated trading.
I was CEO of a bulk liquid storage company, as well as of the country’s largest producer of liquid animal feed supplements, so I’ve seen the commodity markets from logistics and end-user perspectives as well as trading.
In addition, I served on the Board of Directors of my employer, as well as their Risk and Compliance Committees. I held various supervisory and committee positions at futures exchanges as well as commodity industry groups.
I have a BA degree in English from Amherst College, in Massachusetts. This is my first experience teaching on-line, but Penn State offers thorough training to instructors as well as excellent technical support, so I’m confident we’ll all get through the course successfully.
Although I am not an energy industry veteran, one thing we’ll see as we progress is that the risk management techniques, financial concerns, and business principles that apply to one commodity market tend to apply similarly to others. So the skills you pick up in this class will help prepare you for a career in any of a variety of commodity or financially-oriented businesses.
The energy industry is undergoing a period of rapid change and evolution. Unconventional means of production, alternative energy supplies, and shifting demand patterns, all complicated by the influence of financial speculators, combine to make the markets more interesting, and perhaps more difficult, than at any time in the recent past. Understanding these issues will be both interesting and challenging, and I’m convinced will make this course tremendously rewarding for you.
I’m a native New Yorker, and live in the New York City suburbs with my wife, two college age children and three dogs.
Good luck in this course. Don’t hesitate to e-mail me if you have a problem. But, please post all questions in the Course Blog for all to see.
Thanks,
Jim
Meet the Instructor - Tom Seng
Welcome to EBF 301: Global Finance for the Earth, Energy, and Materials Industries
Hi. I am Tom Seng (“sang”) and I will be your Instructor for this course. I am currently an Assistant Professor of Energy Business at The University of Tulsa's Collins College of Business, School of Energy Economics, Policy & Commerce. I was in the natural gas and natural gas liquids industry for over (30) years. I have a background in physical and financial energy commodity trading, midstream and pipeline operations, transportation and storage marketing, risk control, hedging, and regulatory affairs.
In addition, I have been an Adjunct Instructor in Energy Management over the past several years at The University of Oklahoma, The University of Tulsa, Texas Christian University (Fort Worth, TX) and, authored EBF 301.
I have a Bachelor of Science degree in Political Science & History from The State University of New York at Oneonta, NY and, an MBA in Oil & Gas Management from Robert Gordon University in Aberdeen, Scotland. That curriculum was delivered totally online as well so, I have some insight as to the pros and cons of online studies and can definitely understand your situation.
I never saw myself in the energy business but “stumbled in” back in 1980 and it provided a means to support my wife and three children. Since then, I have varied my job experiences to become more diversified and knowledgeable, especially, since becoming an instructor. I have developed a passion for the business and have survived the ups-and-downs and volatility of the past couple of decades. I have learned a great deal and hope to successfully impart that to all of you. I observe the energy markets daily and constantly monitor changes in the business that I see as relevant to my job, my students and, my employers.
I was actually born in Philly, raised in South Jersey but moved to Long Island my Junior year in high school. So, despite living in Tulsa, OK, I am very familiar with the Northeast and will probably recognize most of the towns you are all from.
I am an avid runner and like to play golf in my spare time. And, I enjoy taking short road trips on my motorcycle when I can. In the past, I had a long career as a soccer official and coach.
I wish you good luck in this course and don’t hesitate to email me if you have a problem. But, please post all questions in the Course Blog under the appropriate category for all to see.
Thanks,
Tom
Lesson 1: The Energy Industry – Overall Perspective - Hidden
Did you complete the Course Orientation?

Before you begin this course, make sure you have completed the Course Orientation
(see the Course Orientation [4] menu at left).
Overview
As the saying goes, “the only constant is change.” This statement can be used to describe the energy industry over the past few decades. “Booms” and “Busts” have occurred numerous times as prices rose and then fell back again. Companies have come and gone. Enron shook the very foundation of energy trading. Investigations of supply and price manipulation have occurred, resulting in fines and imprisonment. The new exploration, drilling, and completion techniques (so called “fracking”) have not only led to a substantial increase in the production of crude oil and natural gas, but have also led to great controversy and new regulation over the methods themselves. The “how” and “why” these occurred will be presented throughout the course, and you will come to understand the ever-changing landscape that is the energy industry in the United States.
This course will be focused largely on the five fossil fuels that are traded both physically and financially in energy markets. These are natural gas, crude oil, unleaded gasoline, heating oil, and natural gas liquids (NGLs). These fuels, along with coal, comprise the “non-renewable” energy sources. They are so named since their supply is seen as finite over the long-term.
Each of these products has a profound affect on the United States and global economies. Billions and billions of dollars of infrastructure and hundreds of thousands of jobs are involved in the exploration, production, transportation and distribution of these forms of energy. And, price volatility for these commodities has increased dramatically over the past several years going back to the historic run to $147 per barrel (Bbl) for oil in 2008. Since that time, crude oil has been recognized as a truly global commodity with a host of new factors influencing price.
However, before we proceed into the details of these fossil fuels, we need to understand how these fit into the overall profile of energy production and consumption in the United States. In order to do this, we must also include the various other forms of energy produced and consumed in the United States known as “alternative” and “renewable” energy.
Learning Outcomes
At the successful completion of this lesson, students should be able to:
- Describe the major sources of energy in the United States
- Understand the macro energy production/consumption environment
- Understand what is meant by “renewable” vs. “non-renewable” energy
- Be familiar with the top 5 renewable energy sources
- List the main fossil fuels
- Critically assess the pros and cons for each type
What is due for Lesson 1?
This lesson will take us one week to complete. There are a number of required activities in this module. The chart below provides an overview of the activities for Lesson 1. For assignment details, refer to the location noted.
All assignments will be due Sunday, 11:59 p.m. Eastern Time.
REQUIREMENT | LOCATION | SUBMITTING YOUR WORK |
|---|---|---|
| Mini-lecture: Alternate and Renewables | Mini-Lecture: Alternate and Renewables page | No submission |
| Lesson 1 Activity | Lesson 1 Activity page | Submitted through the course blog |
| Discussion forum participation | Course Blog | Submitted through the course blog |
Questions?
If you have any questions, please post them to our Questions? discussion forum (not e-mail), located under the Communicate tab in ANGEL. The TA and I will check that discussion forum daily to respond. While you are there, feel free to post your own responses if you, too, are able to help out a classmate.
Major Sources of Energy in the United States - Hidden
“Non-renewable” energy sources, as well as “renewable” energy and “alternative fuels” help to satisfy the nation’s energy needs. Coal, a non-renewable fossil fuel, plays a large role in the generation of electricity as well as in industrial processes such as the manufacturing of steel. Nuclear, hydro, solar, wind, biomass, and geothermal are all considered “renewable” forms of energy and comprise varying levels of supply in this country. They are classified as renewables since their source is seen as being virtually unlimited. Of these, solar, wind, biomass, biodiesel, and geothermal are all considered “alternative” energy sources since they are not the “traditional” kind (fossil fuels, nuclear and, hydro).
Figure 1 below shows the break-out of fuel sources used in the generation of electricity. As you can see, the single largest fuel is coal, although this is changing as historically low natural gas prices are causing some “fuel switching.” This is followed by natural gas, nuclear, hydro, and “other.” This final category is comprised of energy sources such as fuel oil (a crude distillate), wind, solar, biomass, and geothermal. Note the very small percentage currently represented by all of these combined. It will literally take decades for alternative fuels to make a substantial contribution to the energy portfolio in the United States. Thus, there is a need to continue to use fossil fuels and nuclear power to “bridge” the gap. How the former are delivered to market and how they are priced is the main focus of this course.

Now that we have clarified the difference between renewable and non-renewable sources of energy, let’s have a look at the production and consumption of energy in the United States on a macro level.
Production and Consumption in the United States - Hidden
The United States is the world’s largest consumer of energy in general and of oil and refined products in particular. However, our current, and forecasted, energy production and consumption balance is improving towards a position of declining imports and more efficient use of all energy sources. The vast new supplies of oil and natural gas coming from domestic shale are radically altering our outlook for eventual self-sustainability. And, the continuing development of “renewable” and “alternate” energy sources will decrease our reliance on traditional “fossil” fuels. We will now take a look at the current state of energy production and consumption in the US followed by a brief examination of the renewable and alternative energy sources.
Figure 2 illustrates the history of actual energy consumption in the United States beginning in 1775 and with an estimated projection moving forward to 2035. Note the forecasted decline in the use of both petroleum and coal, while natural gas and nuclear consumption are expected to increase. The increase in natural gas consumption has much to do with the following: the current historically low prices resulting from the huge amount of new shale gas being produced, and new tighter emissions standards being imposed on coal-fired power plants. The rise in nuclear-generated electricity is a result of the increased number of permits issued for new plants for the first time in decades.

Figure 3 indicates current and projected United States energy consumption overall by source. Notice the increase in renewables and liquid bio-fuels. These alternative energy sources will continue to grow as long as economically feasible, and especially if government subsidies are available to support their production (e.g. – ethanol). However, realize that the EIA (Energy Information Administration) is projecting only a modest increase of 4% by 2035. There is a general misconception that this category, which includes wind and solar power, will eventually contribute a substantial portion of our energy needs. Clearly, such is not the case.

Nuclear production is shown as being stable, however, we know that new plants are being permitted, and with the negligible emissions they produce, look for an increase in power output from this source.
As far as natural gas goes, a steady consumption pattern is indicated. This too, has to be questioned as the residential use of heating oil and propane is steadily declining as conversions to natural gas steadily continue. (50% of US homes use natural gas for space heating and hot water.) Add to that the retirement of coal plants, or the outright switching from coal to natural gas, and growth in the consumption of natural gas will occur.
The future consumption of oil and “other liquids” will be interesting to observe as well. With automobile efficiency improving and electric cars gaining in popularity, this segment should decline. Also, there are decades-old power plants, mostly in the Northeastern US, that use fuel oil. These, too, will become obsolete or convert to natural gas. (The Northeast US is also the world’s largest consumer of heating oil.)
There should also be a more dramatic decline in the use of coal than is shown above as emissions restrictions and lower natural gas prices make coal less economic to use.
The fuels we will study in-depth, natural gas and “oil and other liquids,” comprise 57% of the projected total US energy consumption profile, thus making it crucial to understand the logistics and “value chain” of these fuel sources.

In Figure 4, we see the energy sources matched-up with their respective categories of consumption. Both petroleum and natural gas are used in each sector of consumption, while coal is utilized in only industrial, residential, and power generation. Nuclear energy is strictly used for electric power generation, and renewables can be consumed in all categories but contribute very little to each on a percentage basis.
The sources and uses of energy are important for the overall understanding of the impact of supply, demand and pricing on the macro-economic environment. Everything depends on energy, and understanding these interrelationships can help us manage our supply needs and price exposure.
Mini-Lecture: Alternate and Renewables - Hidden
So, what are the “renewables and alternate” sources of energy? As previously mentioned, “renewable” energy sources are those which can be replenished over and over again, such as nuclear, solar, hydro, wind, biomass, biofuels, and geothermal. “Alternate” energy sources are those which are not the traditional fossil fuels or nuclear power. These include the renewables hydro, wind, solar, biomass, biofuels, and geothermal.
As stated previously, renewable and alternate energy sources will take a long time to make a significant dent in the US’ reliance on fossil fuels. In the interim, the fuels we will study, primarily natural gas and crude oil, will continue to be produced and consumed in substantial quantities. Natural gas, as the cleanest burning of the fossil fuels, represents the “bridge” fuel until renewable and alternate energy can be produced in sufficient quantities to wean us of our dependence on fossil fuels.
The following "mini-Lecture" will cover Alternate and Renewable energy sources in more detail. Mini-Lectures such as this will be provided in most Lessons and will supplement the textual lesson or, be the lesson itself.
Lesson 1 Discussion and Research Rubric
| Criteria | Possible Points |
|---|---|
| Research and answers to 5 questions | 15.0 |
| Complete citations for research | 5.0 |
Summary and Final Tasks - Hidden
Key Learning Points: Lesson 1
Energy consumption in the United States takes many forms. The traditional “fossil fuels,” such as coal, oil, natural gas, gasoline and other refined products and, natural gas liquids, do not have a limitless supply.
Renewables, however, such as nuclear power, hydro, wind, solar, biomass, biodiesel and geothermal, are self-replenishing.
Alternative fuels comprise the group outside of “traditional” energy sources such as nuclear and fossil fuels. They represent the smallest amount of energy consumed in the US and are not expected to expand greatly over the next (20-25) years. And, for many alternative fuels, government subsidies are essential for them to be produced economically.
In the interim, fossil fuels such as natural gas and crude oil will continue to grow in usage and importance. Their supply, demand, and pricing, will have a great impact on the US economy for decades to come.
Now that we have examined production and consumption in the United States as well as the energy “mix,” we will focus on the fuel sources that comprise over 57% of the energy used in this country. Crude oil, with refined products, and natural gas and related natural gas liquids (NGLs), make-up this large sector. The factors that influence their supply and demand are varied and ever-changing. Besides the obvious impact of weather, the economy, US dollar and the global geo-political conditions can all influence energy commodities and affect their prices.
Reminder - Complete all of the Lesson 1 tasks!
You have reached the end of Lesson 1. Double-check the list of requirements on the first page of this lesson to make sure you have completed all of the activities listed there before beginning the next lesson. (To access the next lesson, use the link in the "Course Outline" menu at left.)
Lesson 2: Supply/Demand Fundamentals for Natural Gas & Crude Oil - Hidden
Overview
In mid-2008, crude oil shocked energy markets as it reached an all-time High of $147/barrel (Bbl.) on the New York Mercantile Exchange. (See Figure 1 below.) Within four months, prices had sunk to $50 per barrel. How could this happen and what were the factors causing this level of price volatility? We will be exploring these questions in Lesson 2.

Learning Outcomes
At the successful completion of this lesson, students should be able to:
- Recognize the various factors impacting supply & demand for natural gas & crude oil
- Research major supply/demand influences
- Global economy
- Domestic economy
- Weather
- Currencies
- Energy commodity relationships
- Inventory and storage reports
- Assess the potential impact on market pricing for each factor researched
What is due for Lesson 2?
This lesson will take us one week to complete. There are a number of required activities in this module. The chart below provides an overview of the activities for Lesson 2. For assignment details, refer to the location noted.
All assignments will be due Sunday, 11:59 p.m. Eastern Time.
REQUIREMENT | LOCATION | SUBMITTING YOUR WORK |
|---|---|---|
Reading Assignment: Oil & Gas Basics Video Viewing Assignment: Understanding the Drilling Process Reading Assignment: Fracturing Operations | Lesson 2 Reading Assignment page | No submission |
| Lesson 2 Activity: "Fundamental" Factors exercise | Lesson 2 Activity page | Submitted through the course blog |
| Lesson 2 Quiz | Summary and Final tasks page | Submitted through ANGEL. |
| Discussion forum participation | Course Blog | Submitted through the course blog |
Questions?
If you have any questions, please post them to our Questions? discussion forum (not e-mail), located under the Communicate tab in ANGEL. The TA and I will check that discussion forum daily to respond. While you are there, feel free to post your own responses if you, too, are able to help out a classmate.
Reading Assignment: Lesson 2 - Hidden
Before we begin our discussion of the logistics and value chain for natural gas and crude oil, we need to have at least a cursory understanding of the “upstream” processes for the exploration, drilling, fracturing, and production of these fossil fuels. The following readings and video support this learning.
Reading Assignment: Oil and Gas Basics
- Go to the PetroStrategies web site [6] and read the following sections:
- Products from Oil and Gas Make Our Lives Better
- What are Crude Oil and Natural Gas?
Video Viewing Assignment: Understanding the Drilling Process
The focus of this course involves the sectors of the oil and gas industry known as “midstream” and “downstream.” These occur after the exploration and production, or “upstream” processes. In this video, you will view this aspect of the energy industry and see how the drilling, completion and production of an oil and/or gas well is accomplished from start to finish. This will give you a cursory understanding of how oil and gas is developed. The midstream and downstream activities start once the oil and gas has risen to the top of the well and is ready to be produced.
Click on YouTube link to see video with closed captioning.
Reading Assignment: Fracturing Operations
- Go to the PetroStrategies web site [7] and read the following sections:
- Hydraulic Fracturing
- Fracturing Fluid
- Proppant
- Environmental Concerns
- Marcellus Shale Regulations
Crude Oil - Hidden
In 2008, most economists in the world recognized that we were truly a global society and all of our economies were intrinsically tied-together. Growth or recession in one region of the world could now have a ripple effect on other regions. China and India were emerging as large-scale industrial countries with vast exports of manufactured goods. Both were consuming new, higher levels of energy, and most specifically, crude oil. News of increasing crude imports by both countries sparked buying of the financial commodity contracts.
The so-called “speculators” were blamed for a lot of the price increase that year, but there was a whole new set of players who greatly influenced the market. Investment funds and private investors, both domestic and international, saw the crude market as a “safe harbor” from the ups-and-downs of the stock market and the US dollar. When the stock market fell, they bought crude oil contracts. And when it rose, they sold those same contracts. The dollar is a little more complicated. When the value of the US dollar falls relative to foreign currency, overseas investors have more “buying power,” that is, they can buy more crude with their currency than those holding US dollars. So to some extent, it is true that “traders” had a major influence on oil prices that year. But the definition of “trader” had changed from the stereotypical “day trader,” who wreaks havoc on markets, to sophisticated investors and real demand from emerging nations.
Today, the economic health of various countries still impacts the volatility in oil prices, and the US dollar and crude prices have a very high but inverse correlation. Concerns over the stability of Portugal, Ireland, Spain, and Greece (not so politely known as the “PIGS”) impact the perception of world demand for oil on a daily basis as the collapse of even one of them could create a “domino effect” across other economies. Various economic reports on growth, manufacturing, etc. are monitored continuously.
The US currently produces about 6.2 million Bbl. per day of crude oil, representing only about 51% of consumption, with the remainder coming in the form of imports. Domestic production is expected to represent 57% of demand by the end of 2012, reducing imports to 43%. The rise in domestic oil production is mostly attributed to the new, “unconventional”, sources found in shale formations. Advances in seismology (“3-D”), directional drilling (“horizontal”) and, fracturing methods (“fracking”), have made this once inaccessible resource common place today. Contrary to some beliefs, the number one source of imported crude oil in the US is not the Middle East but, Canada. Oil from tar sands in their Western Provinces is shipped via pipeline into the US.
Figure 2 illustrates the current mix of domestic/import crude and liquids while Chart 3 shows the mix of import sources. (Based upon the latest completed study by the Energy Information Agency of the US Department of Energy.)


Among the major factors influencing US crude oil prices are:
- US weather – mostly winter, as the demand for heating oil impacts crude oil prices. The Northeastern part of the US is the world's single largest consumer of heating oil.
- US dollar vs. foreign currencies - as mentioned previously, a de-valued US dollar gives foreign investors more money to buy crude oil contracts.
- US economy - strength or weakness directly impacts the perception of energy consumption. Several economic indicators are released weekly.
- World economy - as stated in the introduction, we are now in a truly global economy and what happens in one country can affect all others.
- Production & imports vs. demand - reports on domestic oil production & imports vs. consumption can cause prices to vary greatly.
- Baker Hughes Drilling Report of active rigs - this oilfield service company keeps track of the total number of rigs actively drilling for oil and gas, and they report the statistics weekly. A rise in rigs means more potential supply coming-on down-the-road. A drop in the rig count could mean less supply down-the-road.
- West Texas Intermediate (WTI) crude vs. Brent North Sea crude - Brent crude prices reflect demand in continental Europe which can influence the price of imported crude here in the US.
- Weekly Crude Oil & Distillates Inventory Report (Energy Information Agency) - The Department of Energy releases a report every week that gives the current amount of crude oil and distillates in the nation's storage facilities. (Distillates include heating oil, diesel, gasoline, jet fuel, etc.) Increases in the inventory are viewed as an increase in supply, while decreases are seen as an indicator of increased demand.
Natural Gas - Hidden
In contrast to crude oil, natural gas is almost strictly a domestic North American commodity whose price is more influenced by weather and the health of the US economy. Other factors, such as the level of US natural gas inventory, impact prices on a weekly basis. While US economic indicators, such as the stock market, employment figures, housing and, manufacturing indexes, are deemed to be indicative of demand for natural gas, global economies and the US dollar do not have much affect on pricing in this country.
Natural gas is used in more than 50% of US homes for space heating and hot water. In addition, it is the second largest source of energy for electrical generation behind coal (Figure 4) and is widely used in commercial and industrial industries. Figure 5 illustrates the break-down by consuming sector.


The main sources of natural gas supply in the US are domestic production, imports and, Liquefied Natural Gas (LNG). Canada again represents the largest source of imported natural gas, with Mexico contributing a minor amount. Additionally, there are export points into Canada and Mexico. The map in Figure 6 [9] indicates the major import/export and, LNG import points in the US.
")
Domestic production in the US has grown dramatically in recent years due to the same advanced technologies that have allowed crude oil production to increase: “3-D” seismology, horizontal drilling and new “fracking” methods. All contribute to successful recoveries from hard formations such as the new “shales.” Figure 7 illustrates the growth in production of the currently active shale basins in the US.

Among the major factors influencing US natural gas prices are:
- Weather – over 50% of American homes are heated by natural gas; hot weather leads to more electrical generation for air-conditioning loads, and natural gas represents about 25% of that market. Hurricanes in the Gulf of Mexico disrupt supply as platforms are evacuated ahead of the storms, and the hurricanes can also damage the rigs.
- US economy - as with crude oil, fluctuations in the economy translate into an increase or, decrease, in energy consumption.
- Production levels vs. demand indicators - statistics showing flowing natural gas are compared with demand indicators to determine if the market is "short" or "long" supply.
- Weekly Natural Gas Inventory Report (Energy Information Agency) - every Thursday morning, the US government releases data on the amount of natural gas that is in the nation's underground storage facilities. Injections and withdrawals from storage are also indicative of supply and demand dynamics.
- Electrical generation “fuel-switching” - a large amount of the country's power plants that are fueled by coal can actually switch to natural gas, but only if prices are competitive.
- Baker Hughes Drilling Report of active rigs - the field services company reports weekly on the number of drilling rigs actively pursuing oil and/or natural gas. The change in number and type impact the perception of supply in the future.
As we explore pricing for crude oil and natural gas in a later lesson, we will consider the major influential factors for each and define their individual impact. We will also have a weekly discussion about the market prices for crude oil and natural gas and the factors we believe affect them.
Lesson 2 Activity - Hidden
Lesson Activity
Note: You may wish to print this page to circle each corresponding decision (bearish, bullish, neutral) as you work through the scenarios.
Read each of the factor examples and scenarios given below for crude oil and then for natural gas. For each scenario, determine whether it could have a “bearish” (lower prices), “bullish” (raise prices), or neutral impact on the commodity price. When you are finished with the scenarios, tally the totals to arrive at your decision to buy or sell overall for each commodity.
Crude Oil Factor Examples
Read through these factor examples to help you with the scenarios that follow.
- Weather – Heating oil, a crude distillate, is still used in several homes in the Northeastern US for space heating and hot water. This part of the country is the world’s largest consumer of heating oil. (And, many old industrial factories and power plants still use heating oil.)
- Domestic Economy – The strength of the economy is a good barometer for energy usage overall. Indicators such as the stock market, manufacturing indexes, retail sales figures and unemployment numbers influence the perception of demand.
- Global Economy - In addition, crude oil has truly become a global commodity, so world economic factors impact oil prices. (The health of the Eurozone, China’s manufacturing, etc.)
- Currency – The strength/weakness of the US Dollar vs. other currencies directly impacts crude oil prices. Foreign investors trade crude oil contracts, which are priced in US dollars and cents. Thus, if the dollar is weak, foreign investors can buy more crude contracts with their currency. On the other hand, when the US dollar strengthens, foreign investment lessens and crude prices tend to fall. There is a very high correlation between these two.
- Geo-Political Situations – Unrest in any oil-producing region gives uncertainty to supply, and therefore, to prices. The current situations in Egypt, Iran, Syria, and the pirating of oil tankers by the Somalis, all give rise to concerns about crude oil interruptions. In Nigeria, the rebel group MEND has disrupted the shipment of crude oil by attacking facilities owned by Royal Dutch Shell.
- Cross-Commodity Markets – The price of crude can be impacted by the change in the price of the products derived from oil, such as gasoline and heating oil.
- Changes in Inventory – The US government reports the change in the amount of crude oil that is in the nation’s storage facilities. Increases in this are deemed to be “bearish” (supplies have increased) while decreases are seen as “bullish” (there was demand for the inventory).
Crude Oil Scenarios
Determine whether each scenario could have a “bearish” (lower prices), “bullish” (raise prices), or neutral impact on the commodity price.
- Weather – US forecast calls for high temperatures across the “southern tier” states with seasonal temperatures to the North and in the Northeast. (Bearish, Bullish, Neutral)
- Domestic Economy – The Institute for Supply Management’s August manufacturing index was 52.5, down from July’s 53.1. (Bearish, Bullish, Neutral)
- Global Economy – Europe continues to wrestle with the financial woes of Greece and Spain. China sees large increase in exported goods. (Bearish, Bullish, Neutral)
- Currency – The US Dollar traded lower against the British Pound and Japanese Yen today. (Bearish, Bullish, Neutral)
- Geo-Political Situations – The US Navy has successfully thwarted a Somali pirate takeover of a million-barrel crude oil tanker in the Gulf of Aden. OPEC decides to maintain current voluntary quotas. (Bearish, Bullish, Neutral)
- Cross-Commodity Markets – the "peak" summer driving period is over but Americans drove 10% more miles than last summer. (Bearish, Bullish, Neutral)
- Changes in Inventory – The Energy Information Agency’s Weekly Crude & Distillates Report showed that 1.5 million barrels of oil were added to the nation’s storage facilities last week. (Bearish, Bullish, Neutral)
Natural Gas Factor Examples
Read through these factor examples to help you with the scenarios that follow.
- Weather – Natural gas is definitely a domestic North American commodity. It is no longer influenced by world events or even the price of crude. So, the biggest factor affecting price is weather. About half of US homes use natural gas for space heating and hot water. In addition, about 25% of all electricity is generated with natural gas. This amount is actually increasing as the cheaper gas prices of the past several months have led to switching from coal to natural gas.
- Economy – The same factors that impact crude oil prices have an affect on natural gas prices.
- Changes in Inventory – The US government also reports the weekly change in the nation’s natural gas storage. Similar dynamics to crude inventories apply.
- Power Generation – The mix of nuclear, coal, hydro, and wind power impact natural gas prices, but weather still dominates the demand for power, and as a result, the demand for natural gas usage.
Natural Gas Scenarios
Determine whether each scenario could have a “bearish” (lower prices), “bullish” (raise prices), or neutral impact on the commodity price.
- Weather – US forecast calls for high temperatures across the “southern tier” states with seasonal temperatures to the North and in the Northeast. (Bearish, Bullish, Neutral)
- Economy – The Dow Jones Index rose +100 points today. Unemployment increased, but the Consumer Price Index fell due to lower energy prices. (Bearish, Bullish, Neutral)
- Changes in Inventory – The Energy Information Agency’s Weekly Natural Gas Storage Report showed an increase of +65 billion cubic feet. While this was less than forecasted, total gas in the ground still exceeds last year’s levels by +32%. (Bearish, Bullish, Neutral)
- Power Generation – Eight of the nation’s nuclear power plants are offline for maintenance and refueling ahead of the anticipated winter peak load. The NW has an abundance of hydro power, while coal plants continue to burn cheaper natural gas. (Bearish, Bullish, Neutral)
For the next several weeks, you are to find information related to each of the "factors" listed above for crude oil and natural gas. Beside each one, state whether it would lead to higher or, lower, prices. Post your findings on the course blog.
Directions for submitting your work
Part I: Create your Blog Entry. Begin a new entry to the EBF 301 course blog.
The blog entry should consist of two paragraphs: one for your trading decision to buy or sell crude oil, and one for your trading decision to buy or sell natural gas. You will need to post your findings in how you arrived at your decision to buy or sell for each commodity.
Part II: Read and comment on other students' blog entries. After Part I has been completed, blog entries from all students will be available. Read through entries by about 5 other students. Pick two of these students and write comments on their entries. Pick students whose entries do not already have a comment on them. If all of the entries already have comments, then pick students whose entries only have one comment on them. Also, pick students whose entries are interesting to you for any reason.
The comment should be 4-6 sentences long, not counting the link to your entry.
How to comment:
On a blog entry, click the Comments link to go to the comments area for that entry. The Comments link is beneath the title of the entry after the name of the author, the entry date and time, and Permalink. Fill in the fields as indicated above for Comments and other fields such as e-mail as needed, and then click the Submit button.
Grading Criteria
You will be graded on the quality of your participation. See the Blog Discussion Rubric [10] for specifics on how this assignment will be graded.
Summary and Final Tasks - Hidden
Key Learning Points: Lesson 2
- In 2008, the record run-up in oil prices actually represented a dynamic shift in composition of market participants.
- Crude oil is a globally-traded commodity in a world where the economies of most countries are tightly intertwined.
- The US is gradually increasing its domestic oil production, thus reducing its crude imports.
- Natural gas is strictly a domestically traded commodity.
- Vast new reserves of natural gas have been found in “shale” plays due to new technological advances in exploration, drilling, completion and production.
- The US is both an importer and exporter of natural gas.
- Several factors influence the prices of crude oil and natural gas.
Now that we have examined production and consumption in the United States as well as the energy “mix,” we will focus on the fuel sources that comprise over 57% of the energy used in this country. Crude oil, with refined products, and natural gas and related natural gas liquids (NGLs) make-up this large sector.
Quiz
Log onto ANGEL and complete the Lesson 2 Quiz (located in the Quizzes, Surveys, Midterm, and Final Exam folder).
Reminder - Complete all of the Lesson 2 tasks!
You have reached the end of Lesson 2. Double-check the list of requirements on the first page of this lesson to make sure you have completed all of the activities listed there before beginning the next lesson. (To access the next lesson, use the link in the "Course Outline" menu at left.)
Lesson 3: Energy Commodity Logistics - Crude Oil - Hidden
Overview
The term “logistics” has become more and more popular to define the process whereby goods move from the point of manufacturing and production to the point of sale and consumption. UPS® and FedEx® are no longer just in the package shipping business. They now provide a full range of services, from receiving parcels to transporting them via truck, rail and plane, to storing them in warehouses and ultimately, distributing them to their final destinations. All the while, they are tracking packages throughout the entire process, which can also be done by their customers.
The delivery system for energy commodities is no different, as products—either from the wellhead, plant, or refinery—are transported using various methods, stored, and ultimately distributed to places of final consumption. As we explore the ways and methods in which energy commodities are delivered to market, you will see this same basic theme consistently applied.
Additionally, we will learn the “value chain” for energy commodities. That is, what are the costs and revenues along this delivery path?

Figure 1: Overall Energy Commodity Logistics Chart - Crude Oil
Source: Dutton e-Education Institute [11]
This graphic illustrates the various steps in the "wellhead-to-burnertip" logistical path for oil and natural gas: aggregation (gathering), the "cleaning" of the raw stream and production of valuable natural gas liquids (NGLs) and, the steps for getting crude oil and natural gas from the wells all the way to market. As you can see, there is processing of natural gas or refining of crude, the transportation and storage and, finally, the distribution and retail delivery to the various end-users. As you will see, each step along this "path" will have some costs associated with it and most will represent an opportunity for generating revenue. These will add to the total profit that can be derived from the initial wellhead production.
Learning Outcomes
At the successful completion of this lesson, students should be able to:
- Define the steps in the movement of crude oil from the wellhead to the end-user (“pump-to-pump” path).
- Recognize the “value chain” along the path.
- Understand the general methods of transporting crude oil from well to refinery.
- Trucks
- Pipeline
- Rail
- Barge
- Tanker
What is due for Lesson 3?
This lesson will take us one week to complete. There are a number of required activities in this module. The chart below provides an overview of the activities for Lesson 3. For assignment details, refer to the location noted.
All assignments will be due Sunday, 11:59 p.m. Eastern Time.
REQUIREMENT | LOCATION | SUBMITTING YOUR WORK |
|---|---|---|
| Reading Assignment: Crude Oil Refining Process | Lesson 3 Reading Assignment page | No submission |
| Mini-lecture: Crude Oil | Mini-Lecture: Crude Oil page | No submission |
| Mini-lecture: Crude Oil Refining | Mini-Lecture: Crude Oil Refining page | No submission |
| Lesson 3 Activity | Lesson 3 Activity page | Submitted through the course blog |
| Lesson 3 Quiz | Summary and Final tasks page | Submitted through ANGEL |
| Discussion forum participation | Course Blog | Submitted through the course blog |
Questions?
If you have any questions, please post them to our Questions? discussion forum (not e-mail), located under the Communicate tab in ANGEL. The TA and I will check that discussion forum daily to respond. While you are there, feel free to post your own responses if you, too, are able to help out a classmate.
Reading Assignment: Lesson 3 - Hidden
The refining of crude oil is a complex process. In preparation for this topic, please complete the reading assignment below. My lecture will closely follow the steps in refining as outlined here.
Reading Assignment: Crude Oil Refining Process
- Go to the [6]http://science.howstuffworks.com/environmental/energy/oil-refining3.htm [12] and read pages 1 through 6 in preparation for the mini-lecture on Crude Oil Refining. As you read the sections, keep these questions in mind:
- What is meant by “crude” oil?
- What are the two main refining processes?
- What are the various products derived from raw crude oil?
- How does “distillation” work?
- What is “cracking”?
- What is “reforming”?
- What is “alkylation”?
Mini-Lecture: Crude Oil Logistics - Hidden
The following mini-lecture traces the flow of crude oil from the wellhead to the refinery using various forms of transportation. We also discuss the two global standards for crude oil, West Texas Intermediate, and Brent North Sea. The major supply/demand districts in the US are presented, as well as supply and demand statistics.
Key Learning Points for the Mini-Lecture: Crude Oil Logistics
While watching the Mini-Lecture, keep in mind the following key points and questions:
- Wellhead to retail pump infrastructure
- What are the costs and revenue opportunities on the “value chain”?
- “West Texas Intermediate” crude oil vs. “Brent North Sea” oil
- What are “PADDs”?
- Supply & Demand overview
- OPEC member nations
Mini-Lecture: Crude Oil Refining - Hidden
The following mini-lecture presents each phase of the crude oil refining process and the various products that are extracted from each barrel of oil.
Key Learning Points for the Mini-Lecture: Crude Oil Refining
While watching the Mini-Lecture, keep in mind the following key points and questions:
- Products made from a barrel of crude oil
- Refining process
- Distillation
- Conversion = “Cracking,” Reforming, Alkylation, “coking”
- Uses for refined products
Lesson 3 Activity - Hidden
Lesson Activity 1:
1) Think about the various products derived from crude oil that you encounter on a daily basis. Other than gasoline and lubricating oil, what other distillates impact your existence?
2) We know that the amount of crude oil the US imports continues to decline due to increased domestic production, but, do you see demand increasing or, decreasing, over the next decade? What are your reasons for this stance?
Post your answers on the course Blog. Also be sure to read and comment on other students' blog entries.
Grading Criteria
You will be graded on the quality of your participation. See the grading rubric for specifics on how this assignment will be graded.
Lesson Activity 2:
Part of the overall objective of this course is to have you understand how the market functions in terms of determining price and how it trades in general. To truly appreciation this, you have to begin to think like an energy commodities Trader. To do so, you must consider the market factors that they research before making any Buy/Sell decisions.
In Lesson 2, you were presented with a number of “fundamental” factors that can influence the price of crude oil and/or natural gas.
Beginning with Lesson 3 of this semester and, continuing until further notice, you will submit examples of these factors on the Course Blog each week by 11:59 p.m., Eastern US Time, on Sundays.
You are to submit fundamental factors for both crude and natural gas and give your opinion on how each could impact prices, i.e., will prices increase or decrease as a result of what you have reported?
Grading Criteria
- 30 points for the overall submission itself.
- 0-5 points for each of the (14) factors presented in Lesson 2. A missing factor will receive -0- and a factor that is relevant and justifies your rationale for price increase/decrease will receive 5 points. Thus, the total factors presented, which coherently demonstrate an understanding of their influence on price, will receive 100%
An example of a complete answer would be:
Natural Gas
- The Energy Information Agency’s Weekly Natural Gas Storage Report showed an injection of +50 Bcf. This was below the expectation of +60 Bcf, therefore, it was seen as “bullish” since less supply was put into storage implying that demand was higher than expected. Prices would increase under this scenario.
Summary and Final Tasks - Hidden
Key Learning Points: Lesson 3
- There are various methods used to transport crude oil from the wellhead to the refinery.
- Truck/rail/pipeline/barge/tanker
- WTI is the “global standard” for crude oil while Brent Crude is the European standard.
- PADDs are regional districts for supply and distribution of crude oil.
- The US still relies heavily on imported crude but domestic supplies are increasing.
- “OPEC” and the “Gulf States” are not the same.
- The refining process consists of distillation and conversion and produces several products used in transportation and as petrochemical feedstocks.
Quiz
Log onto ANGEL and complete the Lesson 3 Quiz (located in the Quizzes, Surveys, Midterm, and Final Exam folder).Reminder - Complete all of the Lesson 3 tasks!
You have reached the end of Lesson 3. Double-check the list of requirements on the first page of this lesson to make sure you have completed all of the activities listed there before beginning the next lesson. (To access the next lesson, use the link in the "Course Outline" menu at left.
Lesson 4: Energy Commodity Logistics - Natural Gas - Hidden
Overview
This graphic illustrates the various steps in the process of getting crude oil and natural gas from the wells all the way to market. As you can see, there is wellhead aggregation (gathering), the "cleaning" of the raw stream, and production of valuable natural gas liquids (processing or refining), the transportation and storage, and finally, the distribution and retail delivery to the various end-users. As you will see, each step along this "path" will have some costs associated with it and most will represent an opportunity for generating revenue. These will add to the total profit that can be derived from the initial wellhead product.
Learning Outcomes
At the successful completion of this lesson, students should be able to:
- Define the steps in the movement of natural gas from the wellhead to the end-user (“wellhead-to-burnertip” path).
- Recognize the “value chain” along the path.
- Understand the general methods of transporting natural gas from well to end-user.
- Gathering
- Processing & Natural Gas Liquids (NGLs)
- Pipeline
- Storage
- Distribution/End-Use
What is due for Lesson 4?
This lesson will take us one week to complete. There are a number of required activities in this module. The chart below provides an overview of the activities for Lesson 4. For assignment details, refer to the location noted.
All assignments will be due Sunday, 11:59 p.m. Eastern Time.
REQUIREMENT | LOCATION | SUBMITTING YOUR WORK |
|---|---|---|
| Reading Assignment: Natural Gas - From Wellhead to Burner Tip | Reading Assignment page | No submission. |
| Mini-lecture: Production and Gathering | Mini-lecture: Production and Gathering page | No submission. |
| Mini-lecture: Processing and Natural Gas Liquids | Mini-lecture: Processing and Natural Gas Liquids page | No submission. |
| Mini-lecture: Transmission Pipelines | Mini-lecture: Transmission Pipelines page | No submission. |
| Mini-lecture: Storage | Mini-lecture: Storage page | No submission. |
| Mini-lecture: End-Users | Mini-lecture: End-Users page | No submission. |
| Lesson 4 Activity | Lesson 4 Activity page | Submitted through the course blog |
| Lesson 4 Quiz | Summary and Final tasks page | Submitted through ANGEL. |
| Discussion forum participation | Course Blog | Submitted through the course blog |
Questions?
If you have any questions, please post them to our Questions? discussion forum (not e-mail), located under the Communicate tab in ANGEL. The TA and I will check that discussion forum daily to respond. While you are there, feel free to post your own responses if you, too, are able to help out a classmate.
Reading Assignment: Lesson 4 - Hidden
While reading each of these short descriptions, try to visualize the movement of the natural gas through each stage and what exactly is occuring. We will go into more detail for each of these steps in the mini-lectures.
Go to www.naturalgas.org [13] and read over each section in “Natural Gas – From Wellhead to Burnertip." Sections to read are:
- Exploration
- Extraction
- Production
- Transport
- Storage
- Distribution
- Marketing
Please also download and review the American Association of Petroleum Landmen Form 610 - 1989 [14] before proceeding.
Mini-Lecture: Production and Gathering - Hidden

The first step in the movement of natural gas from the “wellhead-to-burnertip” is to determine the "deliverability," or sales volume of the well and then get it connected to a pipeline. This is normally done by midstream companies who gather wells together and deliver the gas to processing plants or directly into transmission pipelines.
The following mini-lecture explains these concepts in detail.
Key Learning Points for the Mini-Lecture: Production and Gathering
While watching the Mini-Lecture, keep in mind the following key points and questions:
- Why is the "deliverability" of a well important?
- What functions are performed by the Gatherer?
- Who are Producers and Operators?
- What are Compressors and how/why are they used?
Mini-Lecture: Processing and Natural Gas Liquids (NGLs) - Hidden

Having made the necessary gathering connections, raw natural gas needs to be purified of all contaminants and inert gases and have heavy hydrocarbons removed to make it safe for commercial use. This takes place at a processing plant where the resultant residue gas is almost 98% pure methane and is what is known as “marketable” natural gas. In addition, processing plants remove the more volatile hydrocarbons, or “natural gas liquids,” (NGLs) which can then be sold separately. This is also a safety issue; end-users of natural gas cannot have more than methane in their supply because explosions could occur.
The following mini-lecture walks through each step of this process and explains the nature of natural gas liquids (NGLs) in detail.
Key Learning Points for the Mini-Lecture: Processing and Natural Gas Liquids (NGLs)
While watching the Mini-Lecture, keep in mind the following key points and questions:
- Natural gas coming out of the ground is in a very "raw" state.
- Processing plants remove heavy hydrocarbons and purify the gas stream for end-use consumption.
- Processed natural gas is known as "commercial grade," or "marketable," gas.
- There are several natural gas liquids (NGLs) that can be extracted from natural gas.
- NGLs vary in molecular structure and have varied uses.
Mini-lecture: Transmission Pipelines - Hidden

Once the raw natural gas stream has been processed, it is now “commercial grade,” or “pipeline quality,” natural gas. The outlet, or residue, side of the processing plant delivers the gas to the transmission pipelines. The primary function of transmission pipelines is to move the gas from the producing basins to the market areas.
The following mini-lecture will illustrate the function and operation of the transmission pipeline systems.
Key Learning Points for the Mini-Lecture: Transmission Pipelines
While watching the Mini-Lecture, keep in mind the following key points and questions:
- Natural gas transmission pipelines connect supply areas throughout the country with major market areas.
- These are large-diameter steel pipes.
- As opposed to gathering lines, these run at very high pressures.
- The US has a huge pipeline "grid" running from coast-to-coast with several pipelnes connected to one another.
- Various sources of supply and consumption connect to these pipelines.
- Large compressors are used to move the gas along the pipelines.
Mini-lecture: Storage - Hidden

Natural gas storage facilities provide the industry with flexibility. During times of “peak” demand such as harsh winters or extremely hot summers, utilities can rely on supplies stored beneath the ground. Likewise, during times of low demand, excess supplies can be stored for when they are needed. For savvy marketers, storage capacity can be used to take advantage of the price fluctuations in the market. There are three main types of storage facilities: depleted oil & gas reservoirs, salt caverns, and aquifers.
The following lecture covers the types of natural gas storage, traditional and current uses, and the industry players who use storage capacity and why.
Key Learning Points for the Mini-Lecture: Storage
While watching the Mini-Lecture, keep in mind the following key points and questions:
- Storage facilities provide "peaking" supply in times of increased need.
- Storage facilities can be used to store excess supply in periods of low demand.
- Storage facilities are largely depleted oil & gas reservoirs but can also be salt caverns and aquifers.
- LDCs have long used storage facilities for supply during extreme cold.
- Electric utilities rely on storage facilities for extra supply during peak air-conditioning loads.
- Marketers use them to provide a variety of value-added services and to take advantage of price swings.
Mini-lecture: Distribution - Hidden

The final step in the logistics chain for natural gas is delivery to the burner-tip. This can be accomplished by Local Distribution Companies (“gas companies”), or pipelines can deliver gas directly to connected end-users. We generally classify the end-users as utility, residential, commercial, and industrial.
The following lecture explains the function of Local Distribution Companies (LDCs) and presents various other natural gas end-user groups.
Key Learning Points for the Mini-Lecture: End-Users
While watching the Mini-Lecture, keep in mind the following key points and questions:
- Local Distribution Companies (LDCs) are gas utilities.
- LDCs lower the pressure of the gas coming from the transmission pipelines and distribute it to end-users.
- Electricy is produced by both public (utilities) and private companies.
- Generation can be simple-cycle, combined cycle, or co-generation.
- Natural gas is used in various commercial, residential, and industrial applications.
- The use of Natural Gas Vehicles (NGVs) is growing.
Lesson 4 Activity - Hidden
Lesson Activity
1) Using the Energy Commodities Logistics diagram, identify areas of cost and/or revenue along the value chain for natural gas. (E.G. – production is a cost but also represents revenue when it is sold.)
2) Using the Energy Commodities Logistics diagram, identify areas of cost and/or revenue along the value chain for crude oil.
Post your answers on the course Blog. Also be sure to read and comment on other students' blog entries.
Grading Criteria
You will be graded on the quality of your participation. See the grading rubric for specifics on how this assignment will be graded.
Summary and Final Tasks - Hidden
Key Learning Points: Lesson 4
- Natural gas travels through several stages from “wellhead-to-burnertip.”
- Wells must be connected to pipelines and/or processing plants.
- The raw wellhead natural gas must be purified and heavy hydrocarbons must be removed.
- Processing plants produce needed natural gas liquids (NGLs) such as: ethane, propane, butane, iso-butane, and natural gasolines.
- Transmission pipelines are large-diameter pipes that carry gas from the producing areas to the market areas.
- Storage facilities provide extra supply in times of high demand and a place to store excess gas in times of low demand.
- End-users can vary from utilities to houses to commercial and industrial facilities.
All pipelines are regulated by the Federal Energy Regulatory Commission, which has rules for how they conduct business. The services that pipelines provide and the rates they charge must be posted on their websites. These requirements came about after years of heavy regulation, which eventually led to de-regulation of the industry and a more competitive environment. Lesson 5 will trace the history of this development.
Quiz
Log onto ANGEL and complete the Lesson 4 Quiz (located in the Quizzes, Surveys, Midterm, and Final Exam folder).Reminder - Complete all of the Lesson 4 tasks!
You have reached the end of Lesson 4. Double-check the list of requirements on the first page of this lesson to make sure you have completed all of the activities listed there before beginning the next lesson. (To access the next lesson, use the link in the "Course Outline" menu at left.
Lesson 5: Transmission Pipeline Rules, Regulations & Rates - Hidden
Overview
Over the years, many industries have been regulated by the federal government. But one by one, they became "de-regulated" over time. The banking and airline industries were once heavily regulated, as was the telephone business. In exchange for federally-approved rates of service and a set return on investment, companies were given exclusive franchises, or service territories. Today, the de-regulation of formerly regulated businesses has spurred-on competition and stimulated new products and services. The natural gas and crude oil businesses followed behind but eventually became de-regulated as well. The chain of events leading up to that, and the current regulatory status of these industries, is presented in Lesson 5.
Learning Outcomes
At the successful completion of this lesson, students should be able to:
- Understand the regulatory environment for the delivery of natural gas and crude oil, including the respective governing bodies.
- Utility status & franchises
- Evolution of the “spot” market
- “Non-discriminatory access”
- “Eminent domain”
- Key regulations
- Understand the regulatory requirements for posting “public” information
- Visit a pipeline company website and research the tariff. Recognize the various services provided by pipeline companies and key “tariff” provisions: firm transportation and storage, “park & loan,” etc.
- Calculate transport costs to deliver natural gas or crude to market
- Demand/reservation Fees
- Commodity Fees
- Fuel retention
- Be familiar with the pipeline “scheduling” process
- Deadlines
- Web-based nomination systems
What is due for Lesson 5?
This lesson will take us one week to complete. There are a number of required activities in this module. The chart below provides an overview of the activities for Lesson 5. For assignment details, refer to the location noted.
All assignments will be due Sunday, 11:59 p.m. Eastern Time.
REQUIREMENT | LOCATION | SUBMITTING YOUR WORK |
|---|---|---|
| Reading Assignment: | Reading Assignment Page | No submission |
| Mini-lecture: Pipeline Regulations & Rates - Crude Oil | Part I | No submission |
| Mini-lecture: Pipeline Regulations & Rates - Natural Gas | Part II | No submission |
| Lesson 5 Activity | Lesson 5 Activity Page | Submitted to TA via email. |
| Lesson 5 Quiz | Summary and Final tasks page | Submitted through ANGEL |
| Discussion forum participation | Course Blog | Submitted through the course blog |
Questions?
If you have any questions, please post them to our Questions? discussion forum (not e-mail), located under the Communicate tab in ANGEL. The TA and I will check that discussion forum daily to respond. While you are there, feel free to post your own responses if you, too, are able to help out a classmate.
Reading Assignment: Lesson 5 - Hidden
Reading assignment:
Go to www.naturalgas.org [13] and read the section on "The History of Regulation." Also, see http://www.downsizinggovernment.org/energy/regulations [15] and read "Overview" and "Oil Market Policies."
Points of Emphasis
- "franchises"
- Monopolies
- Price controls
- "Open Access"
- "Bundled" services
- De-regulation
- "Spot" market
- "Just and reasonable rates"
- Utility status
Part I: Mini-Lecture: Crude Oil Regulation - Hidden
The history of regulation for crude oil and liquids pipelines goes back to the first regulation of the railroads back in the 1800s. A fear of a monopoly by the few railroads in existence prompted the US government to form the Interstate Commerce Commission. The body was later given jurisdiction over interstate crude oil pipelines based upon the same monopoly fears.
Under federal regulations, pipelines must file “just and reasonable” rates and provide access to any shipper requesting space, if available.
The following mini-lecture provides a brief summary of the history of regulation in the crude oil and natural gas industries.
Key Learning Points for the Mini-Lecture: Crude Oil Regulation
- All crude, natural gas, and liquids pipelines in the US are regulated by the federal government.
- The Federal Energy Regulatory Commission (FERC) replaced the Interstate Commerce Commission as the regulatory body for crude oil pipelines.
- “Common carrier” status
- Non-utility vs. natural gas pipeline utility status
- Rate schedules – “tariffs”
- Safety issues – all pipelines are regulated by the Department of Transportation
- Pipelines must post all tariff information on a website.
- "Open access"
- Monopoly vs. competition
Part II: Mini-Lecture: Natural Gas - Hidden
Key Learning Points for the Mini-Lecture: Natural Gas
While watching the Mini-Lecture, keep in mind the following key points and questions:
- All interstate natural gas pipelines are regulated by the Federal Energy Regulatory Commission.
- Prior to 1985, pipelines and gas companies were the sole providers of gas supply. They bought the gas, transported it, and sold it.
- Deregulation later “unbundled” pipeline services, leading to the “spot” market and marketing companies emerged to take-on this role.
- Interstate pipeline companies provide different levels of service including firm and interruptible transportation and storage.
- Interstate pipeline companies must file a “tariff” of rates and services with FERC and the rates must be “just and reasonable.”
- Safety issues – all pipelines are regulated by the Department of Transportation
- Pipelines must post all tariff information on a website.
Lesson 5 Activity - Hidden
Lesson Activity
- Go to http://pipeline.kindermorgan.com/StaticContentManager.aspx?control=ngpl [16] and click on "Informational Postings," then "Tariff." Under "Currently Effective Rates," click on "Rate Schedule FTS Peak." Look at the "Reservation" and "Commodity" Rates for moving gas from the Midcontinent Region to the Market Region. Calculate the daily rate per MMBtu using the method demonstrated in the presentation on rate calculations.
- Next, under "General Terms and Conditions," go to Section 26 (Page 483) and review the quality standards set forth by the pipeline. Tie this into the information presented earlier regarding the reasons why raw natural gas is processed.
Grading Criteria
You will be graded on the quality of your participation. See the grading rubric for specifics on how this assignment will be graded.Submit your answers via email to the TA: Mike McCormick "mwm5342@psu.edu [17]"
Summary and Final Tasks - Hidden
Key Learning Points: Lesson 5
- All pipelines, crude and natural gas, are regulated by the federal government and regulations have evolved over time.
- Pipelines provide various levels of service.
- The rates they charge must be “just and reasonable,” and must be posted on their websites.
- Once a heavily-regulated industry, natural gas pipelines became deregulated in 1985, and the “spot” market emerged.
- Marketing companies developed to provide the once “bundled” services provided by the pipelines and gas companies.
- The costs incurred in transporting crude and natural gas must be considered in the “value chain” from wellhead to end-use.
The services and rates that pipelines charge represent a component of the value chain for crude and natural gas, but how the actual wellhead and delivered prices are determined will be examined in Lesson 6.
Quiz
Log onto ANGEL and complete the Lesson 5 Quiz.Reminder - Complete all of the Lesson 5 tasks!
You have reached the end of Lesson 5. Double-check the list of requirements on the first page of this lesson to make sure you have completed all of the activities listed there before beginning the next lesson.
Lesson 6: Pricing Methodologies - Hidden
Overview
Energy is being consumed at every hour of the day everywhere on earth. Thus, energy commodities are being bought and sold constantly to fill this demand. When we are talking about prices for the actual physical production and consumption of natural gas and crude oil, we are talking about the "cash" market. In this lesson, we will explore the ways in which cash prices are established in the physical marketplace, the fundamental factors that impact them, historical pricing, the main publications that report these prices, and the methodologies they use to collect the data.
Learning Outcomes
At the successful completion of this lesson, students should be able to:
- Gain a sense of historical natural gas “cash” market pricing
- Understand the methodology for cash price determination
- Become familiar with key industry pricing publications and their uses
- Inside FERC
- Gas Daily
- OPIS Price Reports
- Review historical price trends
- Discover online price data resources
What is due for Lesson 6?
This lesson will take us one week to complete. There are a number of required activities in this module. The chart below provides an overview of the activities for Lesson 6. For assignment details, refer to the location noted.
All assignments will be due Sunday, 11:59 p.m. Eastern Time.
REQUIREMENT | LOCATION | SUBMITTING YOUR WORK |
|---|---|---|
| Reading Assignment: Chapter 9 | Errera & Brown | No submission |
| Mini-lecture: Pricing - Physical Natural Gas & Crude Oil | Mini-lecture: Pricing - Physical Natural Gas & Crude Oil page | No submission |
| Lesson 6 Activity | Lesson 6 Activity page | No submission |
| Discussion forum participation | Course Blog | Submitted through the course blog |
Questions?
If you have any questions, please post them to our Questions? discussion forum (not e-mail), located under the Communicate tab in ANGEL. The TA and I will check that discussion forum daily to respond. While you are there, feel free to post your own responses if you, too, are able to help out a classmate.
Reading Assignment: Lesson 6 - Hidden
Reading Assignment:
Read Chapter 9 of Errera & Brown in preparation for next week's Lesson 7. Only pages 143-149 (up to "Current Status of Energy Futures Contracts") and, page 166, starting with "Delivery Methods" through page 168.
Mini-Lecture: Natural Gas & Crude Oil - Physical Pricing - Hidden
Even though the prices of energy "futures" influence the physical markets, prices are negotiated outside the infamous and chaotic trade floors of the exchanges. Buyers and Sellers, looking at their supply and demand situations, make pricing decisions daily and actually buy and sell the physical commodities. The results of these trades are reported in industry publications and become market indicators for the physical "cash" market.
In Lesson 7, we will learn about the financial energy commodity markets.
Key Learning Points for the Mini-Lecture: Physical Natural Gas & Crude Oil Pricing
While watching the Mini-Lecture, keep in mind the following key points and questions:
- Historically, prices were set for long-term contracts at fixed numbers.
- De-regulation created the need for shorter-term pricing.
- The physical commodity market has its own pricing scheme.
- Cash market prices are reported by industry publications using survey methodology and are known as “indexes” or “postings.”
- Inside FERC and Gas Daily are the main postings for natural gas.
- OPIS (Oil Producers Information Service) and ARGUS are the primary reports showing postings for crude oil & natural gas liquids (NGLs).
Lesson 6 Activity - Hidden
Familiarize yourself with one of the industry publications that reports physical, cash prices for natural gas. Inside FERC, Gas Daily and, OPIS do not allow their pubications to be copied unless you have a subscription and receive prior permission. However, you can access the latest prices from the Natural Gas Intelligence website, http://intelligencepress.com/features/intcx/gas/ [18]. These come directly from the electronic trading platform The Intercontinental Exchange (ICE). They are actual transactions for physical natural gas trades at the specified locations. ICE is based in Atlanta, GA. and they also own the International Petroleum Exchange (IPE) in London.
Key Observations for the Natural Gas Intelligence website:
1) Notice the column titles:
- "High" - the highest price traded on the day.
- "Low" - the lowest price traded on the day.
- "Wtd Average Index" - this is the average price when calculated using the volumes traded at each price. This is more accurate than a straight average price.
- "Change" - the difference between this day's price and the prior day's price. It indicates the market change.
- "Volume (mmbtu)" - the total amount of gas traded at that location that day (in MMBtus).
- "Number Trades" - the total number of transactions at that location.
- "Number Counterparties" - the total number of different companies that traded at that point.
2) Notice the prices at some of the key areas around the country:
- EAST - "Transco Z6 (NY)" - this is the price of gas delivered to NYC.
- GULF/TEXAS - "Henry" - this is the physical delivery point for financial natural gas futures contracts (Lesson 7)
- GULF/TEXAS - "Houston Ship Channel" - this is the price of gas delivered to the huge petrochemical refining corridor east of Houston (Lesson 3).
- MIDCONTINENT - "NGPL Midcont" - this is the price for gas in Western OK and the Texas Panhandle. It is also the area we used in Lesson 5 as an example for transportation costs.
- WEST - "SoCal Border" - this is the price of gas delivered to the border of California for Southern California Gas Company ("SOCAL"), the country's largest LDC.
- WEST - "Waha" - this is a major pipeline "hub" in West TX (recall the national pipeline grid which shows pipes intersecting one another), which reflects Texas demand as well as demand in NM, AZ and CA.
- WEST - "Kingsgate" - this is an import point for Canadian gas.
Summary and Final Tasks - Hidden
Key Learning Points: Lesson 6
- Cash prices reflect physical commodity trading.
- “Posted” prices or “Indexes” represent the market price.
- Publications poll market participants and calculate “weighted” average prices.
- Indexes are posted daily, weekly, monthly.
- Three main price publications exist for natural gas.
- One main price publication exists for crude oil & natural gas liquids.
- Market price publications are subscription only.
- www.eia.gov [8] has extensive current and historical market pricing for natural gas, crude oil and natural gas liquids.
In this lesson, we addressed the physical cash marketplace that, for the most part, deals with the "here and now." In the next lesson, we will delve into the financial "futures" markets, where commodity prices can be obtained for future months and years.
You have reached the end of Lesson 6. Double-check the list of requirements on the first page of this lesson to make sure you have completed all of the activities listed there before beginning the next lesson. (To access the next lesson, use the link in the "Course Outline" menu at left.
Course Communications
Meaningful interactions among students and instructors are the hallmark of a successful online class. The two web-based learning environments used in the Penn State courses that use this text—Canvas and Drupal—support several kinds of communication, as described below.
Communications in Canvas
The Canvas course management system supports several modes of communication, including discussion forums, course e-mail, and announcements.
- Discussions are a kind of public e-mail known as "threaded discussion." Everyone enrolled in the class can post messages of their own and can read and respond to everyone else's messages. A series of messages that make up a conversation is called a "thread." Discussions are used throughout the course for both required and optional communications.
- In general, questions and comments about assignments and topics in the course should be shared with the entire class via the discussion forums. That way, everyone can benefit from discussions.
- For more information, see the guide on Discussions [19].
- Conversations is private e-mail—only the recipients you designate can read your messages. A button to "Compose a new message" is provided under the Inbox tab.
- Please use Conversations only for private messages to me (your instructor), the teaching assistant (TA) or fellow students. I prefer to keep course mail within the course management system, except for emergencies.
- Announcements are weekly (or more) messages from the instructor that will appear via e-mail. Announcements highlight assignment due dates (also published in the course Calendar) and include benchmarks by which you can tell if you are on track in the course as well as wrapping up lessons and/or asking timely questions related to course content.
- For more information, see What is Conversations? [20]
- Subject Lines. Whenever you post a message in a forum or send course mail, use a descriptive subject line. Subject lines that include the gist of a question or comment increase the chances that recipients can retrieve the messages we're looking for. Poor subject lines, such as "Question" or "Lesson 1," are useless as search keywords.
Have questions? Need help?
There are many ways to get the help you need. See the "Help!" link in the Resources menu (left) to learn more about the people and resources available to you.
Lesson 7: The New York Mercantile Exchange (NYMEX) - Hidden
Overview
In 2008, the price of crude oil on the New York Mercantile Exchange (NYMEX) hit an all-time high of $147 per barrel. While many factors led to this historic rally, the nature of futures trading and the Exchange itself made this possible. The New York Mercantile Exchange has been around since the late 1800s here in the US, and it is still the most influential financial energy commodities exchange in the world. In this lesson, we will explore the history of the Exchange, how it functions, the participants, and the commodities traded.
Learning Outcomes
At the successful completion of this lesson, students should be able to:
- Understand the history and development of the Exchange
- Know the commodities traded
- Identify the components of a standard NYMEX contract
- Know the difference between “pit” and electronic trading
- Recognize various exchange “floor” personnel and players
- Understand the specific contract provisions for:
- Natural Gas
- Crude Oil
- Heating Oil
- Unleaded Gasoline
- Understand the importance of the “price discovery” function provided by the Exchange for energy commodities
What is due for Lesson 7?
This lesson will take us one week to complete. There are a number of required activities in this module. The chart below provides an overview of the activities for Lesson 7. For assignment details, refer to the location noted.
All assignments will be due Sunday, 11:59 p.m. Eastern Time.
REQUIREMENT | LOCATION | SUBMITTING YOUR WORK |
|---|---|---|
| Reading Assignment: Chapter 1&2 -Errera & Brown; Bloomberg article. | Errera & Brown, ANGEL | No submission |
| Mini-Lecture: NYMEX Contracts | Mini-Lecture: NYMEX Contracts page | No submission |
Mini-Lecture: Cushing-NYMEX Crude Oil Hub | Mini-Lecture: Cushing-NYMEX Crude Oil Hub page | No submission |
| Lesson 7 Activity | Lesson 7 Activity page | Blog |
| Lesson 7 Quizzes 1 & 2 | Summary and Final tasks page | Submitted through ANGEL |
Questions?
If you have any questions, please post them to our Questions? discussion forum (not e-mail), located under the Communicate tab in ANGEL. The TA and I will check that discussion forum daily to respond. While you are there, feel free to post your own responses if you, too, are able to help out a classmate.
Reading Assignment: Lesson 7 - Hidden
Reading Assignment:
Read Chapter 1&2 Errera & Brown in preparation for this week's quizzes; Bloomberg article under "Lessons" tab, "Lesson Resources" folder in ANGEL.
Mini-Lecture: NYMEX Contracts - Hidden
The following lecture will take you through the history of the NYMEX, the type of trading that occurs ("pit" vs. electronic), the major players, the commodities traded, and futures contract specifications.
Key Learning Points for the Mini-Lecture: NYMEX Contracts
While watching the Mini-Lecture, keep in mind the following key points and questions:
- NYMEX contracts are legally binding obligations to buy or sell commodities.
- Contracts are standardized.
- Each commodity contract has volume, price, location and date.
- The NYMEX trades (5) energy commodities along with (2) precious metals.
- Trading occurs both in the “pits” of the Exchange, as well as electronically.
- Margin requirements discourage many from trading.
- The Exchange has a unique set of symbols to identify the commodity/month/year.
- All prices are quoted in US dollars and cents.
- Each commodity has a specific delivery point.
- West Texas Intermediate Crude (WTI) is the global standard traded on the NYMEX.
- Futures contracts provide “price discovery.”
- Market participants include “commercial” or those interested in the physical commodity, and “non-commercial,” or “speculators.”
Mini-Lecture: Cushing - NYMEX Crude Oil Hub - Hidden
The delivery point for the NYMEX Crude Oil contract is the Cushing Hub in Cushing, OK, USA. It is the world's largest crude oil storage facility and represents 16% of the US capacity. It has been in the news over the last few months as Transcanada seeks approval for its Keystone XL pipeline and, as the excess supply at Cushing looks for new outlets to the Gulf of Mexico refineries.
Key Learning Points for the Mini-Lecture: Cushing - NYMEX Crude Oil Hub
While watching the following mini-lecture, please keep in mind the following key points:
- Cushing, OK is the delivery "hub" for the NYMEX contract for crude oil.
- It has both pipelines and storage capacity.
- It is currently over-supplied.
- Take-away capacity is constrained.
- Gulf Coast refiners are having to pay higher prices as a result.
- Two major pipeline projects could solve the supply problems.
Lesson 7 Activity - Hidden
Lesson Activity
The NYMEX is actually owned by the Chicago Mercantile Exchange (CME Group). Links to their energy commodity prices (Henry Hub Natural Gas Futures) can be found in the "Resources" box. Using those links, look-up the prices for both crude oil and natural gas futures for January, 2013. State the date for which these prices were effective. Determine the "Last," "Change," and "Prior" prices, and the volumes for each and email your findings to TA Mike McCormick at mwm5342@psu.edu [17].
Summary and Final Tasks - Hidden
Key Learning Points: Lesson 7
- The New York Mercantile Exchange is a market for crude oil, natural gas, heating oil, unleaded gasoline blend-stock, propane, platinum, and palladium.
- Futures are legally binding obligations that require delivering or receiving the commodity.
- Each contract lists commodity/price/date/location.
- The most important function of the Exchange is “price discovery” and transparency.
- Each commodity has its own delivery hub.
- WTI is the global standard for crude oil.
- Only licensed Brokers can trade on the Exchange.
- Trades have to be conducted with Clearing Brokers.
- There are two classes of market participants, “commercial,” or those interested in the physical commodity, and “non-commercial,” or “speculators.”
- Most trading is purely for financial gain, as only a small number of contractual obligations are fulfilled in the physical (cash) markets.
Now that we are familiar with the workings of the Exchange and futures contracts, we will walk through the precise steps in placing a buy or sell trade on the Exchange. The words used and timing of the process are very important to successful completion and settlement of the trades.
Quiz
Log onto ANGEL and complete the Lesson 7 Quizzes.Reminder - Complete all of the Lesson 7 tasks!
You have reached the end of Lesson 7. Double-check the list of requirements on the first page of this lesson to make sure you have completed all of the activities listed there before beginning the next lesson.
Lesson 8: The New York Mercantile Exchange (NYMEX) - Order Flow and Terminology - Hidden
Overview
All orders placed on the NYMEX to buy or sell contracts are done in a very precise manner where each party involved is fully aware of the details of the transaction. There are specific nuances in the flow of the orders themselves. As legally-binding agreements, non-performance under a futures contract can have severe financial, and legal, consequences. Therefore, most phone conversations are recorded to ensure the accuracy of the orders placed as well as the results of the execution of those orders. Standardized Order Forms are used on the floor of the NYMEX during order execution. Daily "check-outs" occur between Brokers and their clients for verification of all trades conducted that day. In this lesson, we will follow a natural gas futures contract trade from the beginning to end for a producer and end-user wishing to lock-in a fixed-price for a 12-month period ("strip").
Learning Outcomes
At the successful completion of this lesson, students should be able to:
- Understand the order flow from the physical customer through the Exchange.
- Recognize that very few contracts ever actually get delivered physically.
- Understand the concept of the “zero-sum” game in financial contracts.
- Know some primary terminology tied to financial commodity trading.
- Gain a cursory knowledge of the concept of technical analysis
What is due for Lesson 8?
This lesson will take us one week to complete. There are a number of required activities in this module. The chart below provides an overview of the activities for Lesson 7. For assignment details, refer to the location noted.
All assignments will be due Sunday, 11:59 p.m. Eastern Time.
REQUIREMENT | LOCATION | SUBMITTING YOUR WORK |
|---|---|---|
| Reading Assignment: Chapter 3 | Errera & Brown | No submission |
| Mini-lecture: NYMEX Order Flow | Mini-lecture: NYMEX Order Flow page | No submission |
| Lesson Activity: OTIS Trading Simulation; "Trading Places" video | Lesson Activity page/ANGEL | Submitted through OTIS |
| Lesson 8 Quiz | Summary and Final tasks page | Submitted through ANGEL |
Questions?
If you have any questions, please post them to our Questions? discussion forum (not e-mail), located under the Communicate tab in ANGEL. The TA and I will check that discussion forum daily to respond. While you are there, feel free to post your own responses if you, too, are able to help out a classmate.
Reading Assignment: Lesson 8 - Hidden
Reading Assignment:
Read Chapter 3 - Errera & Brown
Key Points of Emphasis for Reading Assignment
- Futures markets are very efficient due to a highly competitive environment.
- Financial commodity prices approximate the true value of the underlying commodity.
- Parallelism recognizes the fact that both financial and physical markets are influenced by similar things.
- Convergence is the tendency for the financial contract to approach the value of the physical commodity as it approaches settlement.
- Speculative Traders use both fundamental and technical analysis in making buy/sell decisions.
- Arbitrage is the act of taking advantage of price differences.
- Basis represents the difference in price between financial and physical markets. Locational Basis is the value between the financial commodity contract delivery point and other cash points.
Mini-Lecture: NYMEX Order Flow - Hidden
All orders placed on the NYMEX to buy or sell contracts are done in a very precise manner with each party involved fully aware of the details of the transaction. As legally-binding agreements, non-performance under a futures contract can have severe financial, and legal, consequences. Therefore, most phone conversations are taped to ensure the accuracy of the orders placed as well as the results of the execution of those orders. Standardized Order Forms are used during order execution and daily "check-outs" occur between Brokers and their clients for verification of all trades conducted that day. In this lesson, we will follow a natural gas futures contract trade from the beginning to end for a producer and end-user wishing to lock-in a fixed-price for a 12-month period.
Key Learning Points for the Mini-Lecture: NYMEX Order Flow
While watching the Mini-Lecture, keep in mind the following key points and questions:
- All orders must be placed with a “clearing” broker who guarantees the trades.
- Contracts can be used for pure trading or “hedging” physical and price risks.
- Physical trading companies provide risk services to their customers.
- Orders flow from customer’s representative through the financial trading process.
- “Fixed-price” desks place orders with NYMEX brokers who fill those with counterparties in the “pits.”
- Less than 2% of all contracts traded ever become physical transactions.
- Trading is a “zero sum” game. For every winner, there is a loser (there are two sides to every trade.)
Lesson Activity: Commence OTIS Trading Simulation - Hidden
Lesson Activity: Commence OTIS Trading Simulation: "Trading Places" video clip.
Follow the instructions for your OTIS Trading Simulation posted in the Lesson Resources folder on ANGEL. Also, read the introduction to the "Trading Places" video clip and then view it on ANGEL.
Answer the following questions about the movie clip. Post your answers on the course blog.
1) What position did the "Dukes" take and why?
2) How did they go about this?
3) What position did Dan Akroyd and Eddie Murphy take and why?
4) How did they go about this?
5) What was the financial downfall of the Dukes?
6) What fundamental information was important to the Traders?
Summary and Final Tasks - Hidden
Key Learning Points: Lesson 8
- Only licensed Brokers can trade on the Exchange.
- Trades have to be conducted with Clearing Brokers.
- Marketing and Trading companies provide hedging services for clients.
- There are two classes of market participants, “commercial,” or those interested in the physical commodity, and “non-commercial,” or “speculators.”
- Most trading is purely for financial gain as only a small amount of contracts are fulfilled in the physical (cash) markets.
- “Day Traders” and speculators rely on Technical Charts to predict market price changes.
Now that we have studied the NYMEX, financial derivative contracts, and the order execution, we will learn how these are used by producers and end-users to reduce their price and supply risk, otherwise known as "hedging."
Quiz
Log onto ANGEL and complete the Lesson 8 Quiz (located in the Quizzes, Surveys, Midterm, and Final Exam folder).Reminder - Complete all of the Lesson 8 tasks!
You have reached the end of Lesson 8. Double-check the list of requirements on the first page of this lesson to make sure you have completed all of the activities listed there before beginning the next lesson. (To access the next lesson, use the link in the "Course Outline" menu at left.)
Lesson 9: Basic Energy Risk “Hedging” using Financial Derivatives - Hidden
Overview
In the previous lesson, we learned that NYMEX energy contracts represent the actual right to buy or sell energy commodities. So, for the commercial market participants, these provide both a market for production and a source of supply. For instance, producers of natural gas, crude oil, or refined products such as heating oil and gasoline, can sell financial contracts, thus guaranteeing that they will have a firm market in the future at a fixed price. Conversely, consumers of these same products can buy contracts to ensure that they will have a firm supply source in the future at a set price. Utilizing financial contracts to reduce price and/or commodity risk is known as "hedging." In this lesson, we will discover the ways in which commercial players in energy use the financial markets for hedging their risks.
Key Learning Points – Energy Risk Hedging
- Producers and Consumers of energy can reduce both their physical (market or supply) and price risk using financial derivatives such as futures and forwards.
- Futures are exchange-traded contracts such as the NYMEX energy commodities.
- “Over-the-counter,” or “OTC” contracts, are known as “forwards.” These are non-exchange traded and can either involve an electronic trading platform or “voice” Broker.
- Hedgers are not speculators.
- Commercial participants in financial markets take the opposite position from what they have in the physical markets.
- Financial positions must be settled monthly.
- Storage capacity can be hedged through buying one month and selling a future month.
Learning Outcomes
At the successful completion of this lesson, students should be able to:
- Understand how price risk reduction can occur through the use of basic financial derivatives
- NYMEX contracts
- “Basis Swaps”
- Understand how commodity risk can be reduced
- Demonstrate a simple “hedge” structure for:
- Energy commodity Producers
- Energy commodity Consumers
- Storage
What is due for Lesson 9?
This lesson will take us one week to complete. There are a number of required activities in this module. The chart below provides an overview of the activities for Lesson 9. For assignment details, refer to the location noted.
All assignments will be due Sunday, 11:59 p.m. Eastern Time.
REQUIREMENT | LOCATION | SUBMITTING YOUR WORK |
|---|---|---|
| Reading Assignment: Chapter 5 Errera & Brown | Errera & Brown | No submission |
| Hedge Examples | Steps in a Financial Energy Hedge page | No submission |
| Lesson Activity: On-going Trading Simulation & Financial/Physical Price comparisons | Lesson Activity page | Submitted through OTIS; Post blog |
| Lesson 9 Quiz: Hedge Problems | Summary and Final tasks page | Submitted through ANGEL |
Questions?
If you have any questions, please post them to our Questions? discussion forum (not e-mail), located under the Communicate tab in ANGEL. The TA and I will check that discussion forum daily to respond. While you are there, feel free to post your own responses if you, too, are able to help out a classmate.
Reading Assignment: Lesson 9 - Hidden
Reading Assignment:
Read Chapter 5 - Errera & Brown
Key Points of Emphasis for Reading Assignment
- Hedging reduces both physical and financial risk.
- Hedging is performed by commercial entities; it is not "trading."
- Hedgers have two positions, one in financial and one in physical.
- Hedgers must take an opposite position in the financial market to the one they have in the physical market.
- Commodity producers are "long" the physicals and must sell the financials.
- Commodity consumers are "short" the physicals and must buy the financials.
- Multi-month hedges or, "strips," can be obtained.
Reducing Commodity Risk - Hidden
In Lesson 7, we defined an energy futures contract and the function of the NYMEX. We also identified the two (2) main participants in financial energy markets as “commercial” and “non-commercial” players.
Commercial entities have an interest in the commodity itself due to the particular business they are in. For example, an oil refinery not only needs actual crude oil but also has a stake in the future price of oil. This is the basic feedstock for all of the refined products they produce, and therefore, their profitability is impacted by the purchase price of crude.
In addition, refiners sell products such as gasoline, heating oil, and diesel fuel, all of which are traded in the financial markets. So, the refiner’s profit, or “spread,” is dependent on the feedstock price for crude and the market price for what it produces.
On the other hand, exploration and production companies need to know the future market price for the crude oil they will extract from their wells.
The same holds true for natural gas. In some cases, natural gas is a component of manufacturing costs in such industries as fertilizers and food processing. In the power industry, the price of natural gas impacts the cost of generating electricity. And for midstream processors, natural gas is the main component for the extraction of valuable natural gas liquids (NGLs).
E&P companies that produce natural gas can also see the future market prices for their production.
Keeping in mind that futures contracts are legally binding obligations to buy or sell a commodity, they guarantee a market for producers and a source of supply for consumers. They also guarantee a set or “fixed” price, thereby reducing price risk as well.
Simple Hedging - Hidden
When commercial parties enter the financial energy marketplace to reduce their supply and/or price risk, it is known as “hedging.” This is much the same as one who bets on the “favorite” in a horserace but “hedges” that bet by also placing bets on another possible winner. They hope to mitigate their losses should the favored horse not win.
In order to hedge supply and price risk correctly, physical players must take a financial position which is opposite to their physical position. For instance, a producer has a commodity and needs a market. (They are said to be “long” the commodity.) In the futures market, they will sell contracts and thus create a future market for their natural gas, crude, etc. This guarantees that a counterparty will take their production and will do so at a known, fixed price.
Consumers of energy do not have the commodity. (They are said to be “short.”) Therefore, they must buy contracts in the futures markets. For them, this guarantees that a counterparty will provide the commodity and will do so at a known, fixed price.
In Lesson 7, we also said that less than 2% of all futures contracts actually go to delivery, that is, the physical commodity does not usually change hands as a result of the financial transactions. (Think about the non-commercial players. They neither have, nor want, the actual physical commodities. They are just trading price.) So, how does this “hedging” work?
Futures prices, for any commodity, are deemed to represent the “market” as it is known at the moment. (We also addressed, in Lesson 7, the idea of the “price discovery” that futures markets provide.) So for instance, at the time of this writing, December 2012 crude oil on the NYMEX is trading $87.00 per barrel. As far as anyone is concerned, that is the December price until it changes. A producer is considered to have sold “at market” at the time they enter into futures contracts. But we know that prices will change between the time this deal was transacted and the time the commodity changes hands. This fluctuation will impact the perception of the actual cash price until the delivery month arrives and the “real” price is established through physical, cash, trading (as reflected in the cash price "postings" we spoke about in Lesson 6).
Let's look at some simple examples of hedges for Producers and Consumers of natural gas.
Exxon-Mobil, the largest producer of natural gas in the US, wishes to sell some of its production for January, 2013 at the current market levels since those prices help them meet earnings targets. To hedge the price risk that can occur between now and January, they will sell the financial NYMEX contracts. Thus, they are guaranteed a market at Henry Hub at a fixed price when the January production month comes around. And, they can do this for any months up to the 144 months that the Natural Gas contract trades.
My company, Superior Pipeline Company, is a natural gas midstream company engaged in the gathering and processing of natural gas. Our profit depends on the "spread" between the price of natural gas that is our feedstock and the natural gas liquids (NGLs) that we produce. Let's say we are concerned about rising natural gas prices this winter. We can buy January, 2013 contracts and thus, be guaranteed supply at Henry Hub at a fixed price when the January production month comes around.
In each of the above cases, the counterparty to the contracts will be responsible for delvering or taking the natural gas at the Henry Hub. Per the NYMEX contracts, this is legally binding. That is what guarantees both the supply & market as well as the price.
Steps in a Financial Energy Hedge - Hidden
Now, let’s take this line of thinking one step further and examine the steps in an actual financial energy hedge.
A crude oil Producer wishes to hedge its December, 2012 price. The current futures market price is $87.00 based on NYMEX trading. The Producer decides to sell December, 2012 crude oil contracts (the opposite of the physical position). Their price is now set at $87.00 for the sale of December, 2012 West Texas Intermediate Crude Oil at the Cushing, OK Hub.
However, at the end of November, all December future contracts must be financially settled according to the rules of the Exchange. So, the Producer must now buy back the contracts in order to balance their financial position.
So, what happens to the price that the Producer will receive when they actually sell their crude oil in the December cash market? Since the futures pricing represents the “market,” the December prices rose and fell as the contracts traded.
Based on the concept of "convergence" (Errera), the Final Settlement price for the December, 2012 crude oil contract on the NYMEX would represent the cash market price for that month.
That means that both the value of the futures contracts that the Producer sold, as well as the cash price (market), fluctuated throughout the life of the December, 2012 contract trading. When the Producer had to buy-back the futures contracts on Final Settlement day, if the contract price had risen, they took a loss on their financial transaction. But what happened in the cash market? Since futures rose, so did cash, thus providing a gain in the physical market for the Producer.
Conversely, if futures prices had fallen by Final Settlement, the Producer would’ve paid less for buying the contracts back and made a profit on the financial transaction. However, since the futures market declined, so did the cash market, thus lowering the actual price the Producer received when the December crude oil production was sold in the physical market.
In both of these scenarios, the gain or loss in the financial market is offset by a corresponding and opposite gain or loss in the physical, cash market. We refer to this as a “perfect” hedge where there is a 1:1 correlation between the financial and physical markets.
This spreadsheet illustrates how this is calculated in a rising and falling financial market.
(Spreadsheet can be found in the Resources Folder in ANGEL. "EBF-301 Lesson 9 simple hedge.xls")
This process can be performed many times over by Producer and Consumer as desired. Thus, suppliers and end-users can establish a fixed-price and insure themselves a market or supply for energy commodities that are financially traded. And theoretically, they can do so for as many future months as the particular contact allows (this is dependent on the number of market participants willing to trade that far out).
Keep in mind that, for the purposes of this lesson, the energy commodities are being physically delivered at their respective contract points. We will address how to figure pricing for locations other than the financial “hubs” in a later lesson.
If one wishes to enter into a contract for underground storage capacity, this transaction can be hedged as well.
Let’s look at an example. The April 2013 NYMEX natural gas contract is trading $3.75 at the time of this writing. We can buy these contracts and that will represent the supply that we would inject into storage in April. Now, we need a market for when we wish to withdraw these same volumes. January, 2014 is trading at $4.35, so we would sell the January, 2014 futures contracts in the same amount as we bought in April, 2013. This creates a “spread” of $0.60. After the respective monthly storage fees and fuel are taken-out, we are left with the “net” spread on our storage transaction. This is also known as a “time spread” since it involves a purchase and sale of the same commodity in differing months.
(Spreadsheet can be found in the Resources Folder in ANGEL. "EBF-301 Lesson 9 simple hedge.xls")
These simple, “fixed-price” hedges are the basic building block for more complex financial derivative hedges.
Lesson Activity: On-going Trading Simulation - Hidden
Lesson Activity:
1) On-going Trading Simulation
2) Physical (cash) prices vs. Financial Settlements for natural gas.
In Lesson 6, you looked-up some cash prices at various hubs in the US using the link for Natural Gas Intelligence,
"http://intelligencepress.com/features/intcx/gas/ [18]". Using those same cash hubs, compare the most recent prices to the NYMEX Settlement price for natural gas for December, 2012. Use the CME website to find the most recent Settlement price.
Calculate the difference as follows: Cash price minus NYMEX. Post your answers on the course blog. These results represent what is known as the "actual Basis" relationship between the NYMEX Henry Hub contract and other physical delivery points in the US.
Summary and Final Tasks - Hidden
Key Learning Points: Lesson 9
- The financial derivative contracts for energy commodities provide actual supply and market for commercial players.
- Fixed prices for the commodities can be established as well.
- Utilizing financial derivatives to reduce one’s price and supply/market risk is known as “hedging.”
- Commercial entities must take a financial position that is the opposite of their physical position in order for the hedge transaction to be successful.
- Producers of the commodity are said to be “long” the physical product and therefore, must be Sellers in the financial market (sell contracts).
- Consumers for the commodity are said to be “short” the physical product and therefore, must be Buyers in the financial market (buy the contracts).
- Companies that lease storage capacity can hedge their price, supply, and market risk through buying contracts in one month and selling contracts in a subsequent month. This is known as a “time” or “storage” spread.
- By taking these opposite positions, price changes in one market are offset by price changes in the other market. When these occur on a 1:1 basis, it is referred to as a “perfect” hedge.
- These are known as “simple, fixed-price” hedges and represent the “first layer” of any more complex hedge transaction.
In Lesson 10, we will explore other, more advanced, financial derivatives that can also be used for hedging. Among these are Swaps, Spreads and Options. They are mostly traded in the "over-the-counter" markets, that is, non-exchange traded. "OTC" encompasses electronic trading platforms as well as "voice" Brokers where transactions occur over the phone.
Quiz
Log onto ANGEL and complete the Lesson 9 Quiz (located in the Quizzes, Surveys, Midterm, and Final Exam folder).Reminder - Complete all of the Lesson 9 tasks!
You have reached the end of Lesson 9. Double-check the list of requirements on the first page of this lesson to make sure you have completed all of the activities listed there before beginning the next lesson. (To access the next lesson, use the link in the "Course Outline" menu at left.
Lesson 10: Advanced Financial Derivatives - Swaps, Spreads, and Options - Hidden
Overview
In Lesson 9, we focused on the “futures” markets and how simple hedges can be accomplished using exchange-traded contracts. Here, we will address the “over-the-counter,” non-exchange traded markets, or “forward” contracts. Keep in mind that NYMEX Exchange contracts are referred to as “futures.” We will also cover financial “spreads” whereby traders take advantage of price differences based on location, time, or inter-commodity relationships. Finally, we will deal with financial Options which are a simpler and less costly form of hedging vs. the financial derivative contracts themselves.
Key Learning Points – Energy Risk Hedging Using Swaps and Spreads
- Exchange-traded energy contracts are known as “futures,” whereas non-exchange traded contracts are known as “forwards."
- These are traded on electronic trading platforms or over the phone with licensed Brokers.
- “Swaps” are exchanges of payments between two parties. They are strictly financial. No physical exchange of the commodity takes place.
- One party to the transaction agrees to pay a current market price (“fixed”) while the other agrees to pay a price in the future (“floating”).
- They are a simpler and less expensive way to hedge price risk.
- One very important Swap is a “Basis Swap,” which is a market-determined value that represents the difference between the NYMEX Henry Hub contract delivery point and other natural gas trading points in North America.
- Spreads are merely price differences between commodities that are interrelated somehow, have differing locations, or represent different months of the same commodity.
- They are traded for hedge purposes (reduce price risk) or outright trading (speculate on price spread movement).
- Energy Options are yet another, more simple way to hedge price risk. They are less expensive than the outright purchase or sale of the underlying contracts. We will cover the types and their uses:
- Call Options
- Put Options
- Hedging with Options
Learning Outcomes
At the successful completion of this lesson, students should be able to:
- Understand the following financial derivatives and their uses:
- Swaps
- Spreads
- Options
- Apply advanced financial derivatives to energy commodity hedging
- List the components of an Options contract
- Be familiar with the Black-Scholes Model for Options valuation
- Know the inputs to run the B-M model spreadsheet
What is due for Lesson 10?
This lesson will take us one week to complete. There are a number of required activities in this module. The chart below provides an overview of the activities for Lesson 10. For assignment details, refer to the location noted.
All assignments will be due Sunday, 11:59 p.m. Eastern Time.
REQUIREMENT |
LOCATION |
SUBMITTING YOUR WORK |
|---|---|---|
| Reading Assignment: Chapters 4 & 6 - Errera & Brown | Errera & Brown | No submission |
| Mini-lecture: Financial Energy Swaps | Mini-lecture: Financial Energy Swaps page | No submission |
| Mini-lecture: Financial Energy Spread Trading | Mini-lecture: Financial Energy Spread Trading page | No submission |
| Mini-lecture: Financial Energy Options Contracts | Mini-lecture: Financial Energy Contracts page | No submission |
| Lesson Activity: Black-Sholes Model Exercise and on-going Trading Simulation | Lesson Activity page |
Submitted through ANGEL |
| Lesson 10 Quiz | Summary and Final tasks page | Submitted through ANGEL |
Questions?
If you have any questions, please post them to our Questions? discussion forum (not e-mail), located under the Communicate tab in ANGEL. The TA and I will check that discussion forum daily to respond. While you are there, feel free to post your own responses if you, too, are able to help out a classmate.
Reading Assignment: Lesson 10 - Hidden
Reading Assignment:
Read Chapters 4 & 6, Errera & Brown
Key Points of Emphasis for Reading Assignment:
- Non-exchanged traded financial derivatives are known as "over-the-counter" (OTC).
- Swaps and Spreads trade OTC while Options are exchange and OTC traded.
- Swaps are exchanges of payments between two Buyers. They are financially settled.
- Swaps are normally "fixed-for-floating" whereby one price is the current market price ("fxed") and the other price is the future settlement price ("floating").
- Spreads are trades which occur between commodity locations and times, as well as intra-market and inter-market.
- Options give the Holder of the Option the right but not the obligation to buy or sell a commodity at a particular price for a specific date and location in the future.
- Options are price risk insurance and a premium is paid for Options contracts.
- Premiums paid are substantially less than the outright commodity contracts.
- Option premiums are determined using mathematical models. The most well-known is the Black-Sholes.
- "Put" Options give the Buyer a "floor" price, whereas "Call" Options establish a "ceiling" price for the Buyer.
- Options Buyers are only exposed to the cost of the premiums.
- The Seller (Writer) of an Option assumes all the risk.
Mini-Lecture: Financial Energy Swaps - Hidden
Swaps represent exchanges of payments between two parties. They are financially settled and no physical commodity is delivered or received by either party. They represent a substitute for the futures contracts but rely on NYMEX pricing to establish the financial arrangement for the swap contract. Similar to a NYMEX contract, the elements of a Swap contract include the commodity, location, date, and price.
We use the phrase “fixed-for-floating” Swap to signify the prices agreed to by both parties in the contract. The “fixed” price is always the current market price. It is the price known at the time the deal is struck. The exchange of payments will occur when the NYMEX settlement price is known. We refer to this settlement price as the “floating” one since it is not known until the contract’s last trading day and “floats” with each day’s trading until then. The difference between the two represents the amount of payment due one party or the other.
For example, as of this writing, the December, 2012 crude oil contract is trading $87.00. If I bought a Swap, I would be buying contracts at $87.00. On November 16, 2012, this contract will settle, and the difference between my $87.00 and the Final Settlement price will be the amount exchanged between me and my counterparty. If the contract settles at $87.50, since I bought the Swap, I would be selling it back at that price and my counterparty would pay me $0.50 per contract (1,000 Bbl), or $500. On the other hand, if the contract settled at $86.50, I would be selling the contracts back at a loss of ($0.50) and would pay my counterparty $0.50 per contract, or $500. The calculations are the same as those shown in Lesson 9's hedging spreadsheet.
The advantage of using Swaps for hedging is that you can achieve the same price protection without actually having to buy or sell NYMEX contracts. And, you can work with Brokers either by phone ("Voice" Brokers) or through an electronic trading platform such as The Intercontinental Exchange (ICE).
Key Learning Points for the Mini-Lecture: Financial Energy Swaps
- “Swaps” are exchanges of payments between two parties. They are strictly financial. No physical exchange of the commodity takes place.
- One party to the transaction agrees to pay a current market price (“fixed”) while the other agrees to pay a price in the future (“floating”).
- They are a simpler and less expensive way to hedge price risk.
- One very important Swap is a “Basis Swap” which is a market determined value that represents the difference between the NYMEX Henry Hub and other natural gas trading points in North America.
The following Mini-Lecture is a summary of the points presented above.
Mini-Lecture: Financial Energy Spreads - Hidden
“Spread” trading can be used for hedging purposes or purely for trading (“arbitrage”). This involves using price differences in futures or forwards based upon time differences, locational differences and inter-commodity relationships.
In spread trading, futures or forwards can be used to achieve the desired results. A buy/sell is offset by a corresponding sell/buy. Examples of the types of spreads are:
- Time Spread (often called a “storage” spread)
- Buy a natural gas contract in May/sell it in January
- Buy a heating oil contract in April/sell it in December.
- Locational Spread
- Buy NYMEX crude contract/sell Brent crude contract
- Buy NYMEX Henry Hub natural gas/sell a different cash market Hub
- Inter-commodity Spread – Buy/Sell differing but related commodities
- “Crack” Spread
- Buy crude oil/sell heating oil or gasoline (HO/RBOB is “cracked” from CL)
- “Frack” Spread
- Buy natural gas/sell Propane (midstream natural gas companies process natural gas into Propane and other NGLs)
- “Spark” Spread
- Buy natural gas/sell electricity (electric generators can use natural gas to produce power)
- “Crack” Spread
In addition to traders who are merely interested in price movement to make money, commercial entities can use Spreads to hedge their price risk. For example, as mentioned above, a crude oil refiner can buy crude contracts (hedge price of feedstock) and sell heating oil and unleaded gasoline contracts (refined output) to establish a profit margin or “crack” spread. This hedge is illustrated in the spreadsheet, "EBF-301 Lesson 10 refinery hedge.xls" found in the Resources folder in ANGEL.
The following Mini-Lecture summarizes the points presented above.
Key Learning Points for the Mini-Lecture: Financial Energy Spreads
- Spreads are merely price differences between commodities that are interrelated somehow, have differing locations, or represent different months of the same commodity.
- They are traded together for hedge purposes (reduce price risk) or outright trading (speculate on price spread movement).
Mini-Lecture: Options Contracts - Hidden
Car insurance is a good example of a Call Option. A premium is paid and the insured has the right to “call” their insurance agent in the event of an accident. The “price” they will have to pay for the damages is limited to the amount of the deductible (“strike price”). The term is usually one year, and if no claim is made, the “option” expires worthless (i.e. – no payout is made by the insurance company since no claim was made). The insured’s maximum exposure is the deductible, thereby establishing a “ceiling price.” And, the premium is calculated using complicated mathematical models (actuarial tables, statistics & probabilities).
Energy options are very similar in nature. As with most financial derivatives, they can be used for hedging price risk or for outright trading. One key difference is that Options represent the Buyer’s right, but not the obligation, to buy or sell futures/forwards contracts. The Options contracts themselves are not futures or forwards contracts but rather a right to those contracts. They are traded on the Exchange as well as over-the-counter. And, the Buyer is under no obligation to purchase or sell the underlying commodity contracts if the pricing makes no sense.
Key Learning Points for the Mini-Lecture: Options Contracts
While watching the Mini-Lecture, keep in mind the following key points and questions regarding Energy Risk Hedging Using Options Contracts:
- Options give the Buyer the right but not the obligation to buy or sell financial energy contracts at some point in time in the future. They are traded on both the Exchange and over-the-counter markets.
- They are much cheaper than outright contracts or Swaps in that premiums usually represent only a fraction of the face value of the underlying contracts.
- As a result, a substantial amount of contracts can be “controlled” relatively cheaply.
- Options contract components list the commodity, volume, date, price, and premium to be paid.
- A “call” option gives the Buyer the right to buy contracts at a fixed price, which creates a maximum, or “ceiling price.” These are mostly used by consumers of the energy commodity wishing to cap their price risk exposure.
- A “put” option gives the Buyer the right to sell contracts at a fixed price, which creates a minimum or “floor price.” These are mostly used by producers of the energy commodity wishing to limit their downside price risk.
- Options values are calculated using algorithmic models.
- The most popular model is the Black-Scholes Model.
Components and Types of Options Contracts - Hidden
The components of an Options contract are:
- option type (call/put)
- commodity
- date
- strike price (price at which the contracts can be bought or sold by Buyer)
- premium
Option types are:
- “Calls” – these give the Buyer the right but not the obligation to buy the underlying financial energy contracts should the market price exceed the “strike price” of the Option contract. In that case, the Buyer would “call” the Seller of the Option and request the contracts.
- “Puts” – these give the Buyer the right but not the obligation to sell the underlying financial energy contracts should the market price fall below the “strike price” of the Option contract. In that case, the Buyer would “put” the contracts to the Seller of the Option, who must purchase them.
The Buyer of an Option’s exposure is merely the cost of the Option, i.e., the Premium. They will never pay more than that. On the other hand, the Seller, or “Writer,” of an Option bears all the risk and is exposed to any price movement above the strike price of the Call Option, and below the price of the Put Option.
One of the main advantages is that, since only a premium is paid up front, the Buyer of the Options can control a large amount of contracts for a small price. For example, with a Call Option, they are not buying the underlying contracts outright, but are buying the right to purchase them at a set price (“strike price”) if necessary.The Buyer could have the right to buy 100 contracts and only have to pay the premium for the Option and not pay the total cost of 100 contracts.
So, who would use Options contracts for hedging? Let’s take a crude oil Refiner as an example. The company is concerned about rising crude oil prices. But rather than go out and buy hundreds of futures contracts and lock-in the price now, they decide to purchase a Call Option at a strike price that limits their exposure to rising prices. In doing so, they establish a maximum, or “ceiling,” price. So, for December, 2012, they buy a crude oil Call Option at a strike price of $90.00 since the current price is $87.00. If December prices remain below $90.00, the refiner does nothing and is out only the premium. However, should December prices exceed $90.00, the refiner calls the Option Seller and requests the number of crude oil contracts agreed upon at the $90.00 strike price. In this scenario, the refiner will never pay more than $90.00 for their crude supply. And, they capture all the downside of prices should the market fall.
On the flip side, let’s consider the crude oil Producer who is worried about falling prices, so they enter into a Put Option to establish a “floor” price. For December, they choose a $80.00 strike price, thus establishing the lowest price at which they will have to sell their crude oil. Should prices fall below that level, they will contact the Options Seller and request their right to sell the underlying financial contracts at $80.00. Should prices remain above $80.00, the producer would do nothing and be out only the price of the Option (premium). In this way, the producer can reap all the benefits of higher prices regardless of how high they go.
If not exercised, Options expire worthless. And, Options are time-sensitive. The closer to the expiration date, the less value the Option has (less risk exposure with less time remaining).
There are numerous mathematical models that are used to determine Options premium values. The most well-known is the Black-Sholes Model. It is an extensive algorithm that only needs a few inputs to calculate an Option’s value.
- Asset Price (current market price)
- Strike price (Buyer’s desired price)
- Days to Expiration (of the underlying commodity contract)
- Volatility of the underlying contract (available market data)
- Interest Rate (This is the opportunity cost of paying the premiums upfront vs. investing the cash in something else. The Federal Reserve’s Prime Rate is normally used.)
A spreadsheet with the Black-Sholes Model and sample inputs can be found in the Resources folder in ANGEL.
Lesson Activity: Black-Sholes Model Exercise - Hidden
Lesson Activity: Black-Sholes Model Exercise
Log onto ANGEL and complete this exercise for Lesson 10 (located in the Quizzes, Surveys, Midterm, and Final Exam folder).
Summary and Final Tasks - Hidden
Key Learning Points: Lesson 10
- Swaps are exchanges of payments between two parties and are strictly financial in nature.
- They can be used in lieu of futures contracts and are, in fact, “forward” contracts.
- They are non-exchange traded instruments.
- They can be used for hedging or outright trading.
- “Fixed-for-floating” Swaps use current NYMEX market prices and final settlement prices to determine the balance of payments under the agreements.
- Spreads represent the price difference between commodity locations, relationships and timeframes.
- They can also be used for hedging or outright trading (arbitrage).
- The most common types of Spreads are location, time (storage) and, inter-commodity.
- Inter-commodity Spreads can be by oil refiners, midstream natural gas companies and, electricity generators to lock-in margin.
- Options are a simple and less costly way to hedge price risk than the outright purchase or sale of energy financial contracts.
- They give the Buyer the right but not the obligation to buy or sell the underlying energy commodity contracts at the “strike price.”
- The Seller, or “Writer,” of the Option assumes all risk.
- Options can be used for hedging or outright trading.
- Commercial entities concerned about rising energy prices, i.e., refiners, would enter into a “Call” Option, thereby establishing a maximum, or “ceiling,” price for their commodity needs.
- Commercial entities concerned about falling energy prices, i.e., producers, would enter into a “Put” Option, thereby establishing a minimum or “floor” price for their commodity.
- The Black-Sholes Model is the most popular Options Valuation Model.
Over the past few weeks, you have been researching various Fundamental Factors that can be used to aid in making trading decisions. The other type of information, used by "Day Traders," is "Technical Analysis." In the next lesson, we will get an elementary overview of TA which will assist you in decision-making for the final 3 weeks of the OTIS Trading Simulation.
Quiz
Log onto ANGEL and complete the Lesson 10 Quiz (located in the Quizzes, Surveys, Midterm, and Final Exam folder).Reminder - Complete all of the Lesson 10 tasks!
You have reached the end of Lesson 10. Double-check the list of requirements on the first page of this lesson to make sure you have completed all of the activities listed there before beginning the next lesson. (To access the next lesson, use the link in the "Course Outline" menu at left.)
Lesson 11: Technical Analysis - Hidden
Overview
Thus far, we have addressed the fundamental factors that influence energy prices. And we established that there are two main groups that trade in the financial energy commodities markets, commercial and, non-commercial. The latter group represents the “pure” Traders or “speculators." These participants are only interested in price movement. The type of commodity does not matter to them. In order to make trading decisions, they use Technical Analysis as opposed to Fundamental Analysis.
Technical Analysis involves the use of charts to track price movement, establish the current market trend, and to determine the probability of prices moving in one direction or another. Simply put, technical or “day” Traders are interested in market activity as illustrated by the resulting prices.
Since the prices that occur in the market are the result of human decision-making, Technical Analysis really examines the behavior of market participants. As such, patterns emerge that have a high probability of recurring. It is precisely these events that technical Traders are looking for. But, make no mistake; fundamental events cause Traders to react emotionally the results of which are also reflected in the price action.
In Technical Analysis, Traders must first establish what the current price trend is, up or down. Then, they must determine the probability of the trend lasting or changing direction. It is this information that guides their buy/sell decisions.
Learning Outcomes
At the successful completion of this lesson, students should be able to:
- Distinguish the difference between Technical and Fundamental market analysis
- Identify different types of technical charts and their uses
- Recognize Trendlines and market signals
- Analyze “momentum” indicators
What is due for Lesson 11?
This lesson will take us one week to complete. There are a number of required activities in this module. The chart below provides an overview of the activities for Lesson 11. For assignment details, refer to the location noted.
All assignments will be due Sunday, 11:59 p.m. Eastern Time.
REQUIREMENT | LOCATION | SUBMITTING YOUR WORK |
|---|---|---|
| Reading Assignment: Errera & Brown, and Pring | Reading Assignment page | No submission |
| Lesson Activity: Technical Chart Analysis | Lesson Activity page | Submitted via email |
| Lesson 11 Quiz | Summary and Final tasks page | Submitted through ANGEL |
Questions?
If you have any questions, please post them to our Questions? discussion forum (not e-mail), located under the Communicate tab in ANGEL. The TA and I will check that discussion forum daily to respond. While you are there, feel free to post your own responses if you, too, are able to help out a classmate.
Reading Assignment: Lesson 11 - Hidden
Reading Assignment:
Errera & Brown - Chapter 8
Pring - Chapter 1 - 3, Chapter 4 (p. 43-48, 63-67, 76-80, 88-96), Chapter 5 (p. 97-111), Chapter 6.
Key Points of Emphasis for Reading Assignment:
- Technical Analysis relies on the principals of probability and statistics.
- The (3) most popular technical charts are Line or "close only," Bar, and Candlestick.
- Line Charts record only the daily Closing price and are best used for long-term trending.
- Bar Charts indicate the daily High, Low, Open and Closing prices for the trading day.
- Candlestick Charts also show the HLOC but do so in a fashion as to illustrate the market direction, up or down, for that day's trading.
- Identifying the current trend is the first step.
- Determining if the trend is going to change is the next step. This can be ascertained if the preponderance of the evidence indicates it will. Buy/Sell decisions will then be made.
- Trendlines are used to indicate the trends.
- Various price patterns exist for Traders to identify.
- Volume is a good indicator of market activity and can reinforce the day's price movement.
- Resistance is the price level at which Sellers enter the market again. It establishes a "ceiling" price in the current market.
- Support is the price level at which Buyers enter the market again. It establishes a "floor" price in the current market.
- Moving Averages are good studies to utilize if you believe in the statistical premise of "reversion to the mean."
Charting Methods - Hidden
There are several types of charting methods, but three of them are the most popular.
1) “Bar Chart” – a vertical line is shown for each time increment selected. In the chart below, a “daily” chart is used to show the September NYMEX contract for natural gas. Each bar shows the price results for that day’s trading. The mark to the left of the bar represents the first trade of the day, or the “Open.” This is the price of the first trade that occurs right after the bell rings to start trading. The vertical line itself represents the full range of prices for the day, that is, the High and Low prices. And the mark to the right of the bar represents the final closing, or “Settlement” price for the day.This is often referred to as the "OHLC" chart (Open/High/Low/Close).

2) “Close Only” – this type of chart shows only the daily market settlement price. It provides much less information than the Bar Chart and is mainly used for longer-term trend analysis. The chart below shows the same September natural gas contract in this form.

3) “Candlestick” – these charts were developed by the Japanese centuries ago. They provide information similar to the Bar Chart but also indicate “up and down” days. That is, they clearly show the direction the market took on a daily basis. The top end of the “candle” still represents the High for the day, and the lower end represents the “Low,” but the “body” indicates the Open and Closing prices in relation to one another. For example, if the Open is higher than the Close, the Open price is at the top of the “body” of the candle and represents a day where prices fell (solid "body"). Conversely, if the Close is found on the top of the “body,” it represents an “up” day, and on the chart below, appears with a hollow “body.” As you can now see, the up-and-down days are easily visible on the Candlestick Chart. By counting these, we can determine the current uptrend. For Traders, the question is, when will it reverse course?

Trendlines - Hidden
Trendlines can be used to identify both long- and, short-term price trends. They are also used to indicate Support and Resistance prices and Channels (covered later). A trendline only has significance if it touches at least two price points. The chart below shows an obvious long-term downtrend going back one year.

This next chart illustrates two short-term trendlines, one up and one down.

When one trendline connects two or more price points and another trendline connects two or more price points in parallel fashion, they form a “Channel,” as shown below. Channels have significance in that traders look for prices to move above or below the confines of the Channel. This is referred to as a “breakout,” and depending on the number of days that form the Channel, this can occur with good momentum, resulting in a large price move in that direction.

Trend Indicators - Hidden
1) Volume - One of the simplest clues to the strength of price movement is that of the Volume of contracts traded. If a price shows a large range or change in direction on a particular day, looking at the volume of contracts traded indicates how well supported that move was by the market participants. A $0.10 movement up or down in natural gas is not very significant if a low volume of contracts traded. On the other hand, when large volumes trade, that definitely reinforces the price action for the day. It’s as if those trading have agreed on the price outcome. The chart below is a Daily Bar Chart with Volume for natural gas. Notice that on August 9th, prices traded in a $0.25 range and a very large amount of contracts exchanged hands, solidifying the move. Then, on August 10th, prices fell and the second-highest Volume for the contract traded. Both of these Volumes add legitimacy to the price action for those days

2) Moving Averages – For those of you who have had statistics, you should be familiar with the term “reversion to the mean.” For those of you who have not, the concept hinges on the idea that all prices will eventually return to their average despite dramatic movements up or down. I have found this to be especially true for energy commodities, at least in the short-term. Therefore, tracking commodity moving average prices can be a good signal for a change in the direction of a trend. For instance, the chart below shows that the Moving Average for September, 2012, crude oil over a 30-day period was $95.69 while prices had risen to as high as $97.50. This means there is a good probability that they will eventually fall towards $95.69. It may be a gradual decline which also means the average will change, but as long as the MA is lower, prices will gravitate towards it. The exact opposite occurs when prices fall below the MA. The chart below illustrates this principal with the September, 2012, crude oil contract. Note that the timeframe for the MA is set to the particular Trader’s needs. I have set the MA at 5 days, as that represents a full week of trading (regular session, pit trading only occurs on weekdays). See how the prices, while moving above and below the MA, ultimately return to it. This is a key sign for making buy/sell decisions.

3) Relative Strength Index - Relative Strength Index (RSI) is a momentum oscillator that measures the speed and change of price movements. RSI oscillates between zero and 100. Traditionally, RSI is considered overbought when above 70 and oversold when below 30. RSI can also be used to identify the general trend. (http://stockcharts.com/school/doku.php?id=chart_school:technical_indicators [21]) Understanding the exact RSI calculation is not necessary to understand how to use this indicator. The next chart is a Daily Bar Chart with Volume, MA and now, the RSI study. Note that the current RSI is over "70" which is considered “overbought. This could, therefore, be a signal to "Sell."

Price Signals - Hidden
As with trend analysis and market indicators, there are several types of price signals. We will deal with a few of the ones that are more common and easy to use.
1) Support & Resistance: As prices move up-and-down, Traders make decisions as to when to continue to buy in an uptrend and when to sell in a downtrend; that is, they try to determine when the current trend will exhaust itself and change direction. One way to do this is to look at the “Support” and “Resistance” price levels. Support represents a price level at which Buyers will step back into the market after a period of selling. This interest establishes a “floor” price. Traders find value at this level and start to buy-up the contracts again. In some cases, Traders who have been selling contracts during the downtrend may be buying them back to take some profits. Resistance is the price level at which the market is no longer interested in buying contracts. The price is deemed to be too high and Sellers re-enter the market, thus establishing a "ceiling" price.
So, how do we establish these pricing points? As the chart below shows, when we draw upper and lower trendlines, the lines continue through price points on the right, vertical axis. Where the upper trendline crosses the right axis is the Resistance point while the price where the lower trendline crosses the right axis is the Support point. Theoretically, then, these represent both the maximum the market is willing to pay as well as the minimum at which is it willing to sell.

This chart indicates that Resistance is about $97.20 and, Support is about $95.00. Traders will now look to see if prices can trade above, or below, these levels. If they do, there will be a flurry of activity in the direction of the move.
2) “Tops & Bottoms.” Since we are on the subject of Support and Resistance, we can discuss price signals related to those concepts. As we have said, Traders are interested solely in price movement. And Support and Resistance levels represent buying and selling interest. So what happens when the Buyers or Sellers step-in to halt the moves higher or lower? They are testing the points of Support and Resistance. If the Sellers can’t break-through Support, it is a result of Buyers stepping-in. As mentioned above, that sets a “floor” or “bottom” price on that day. Likewise, if Buyers test the Resistance price and Sellers step in to prevent a breach of that level, a “ceiling” or “top” is established.
While a one-day occurrence of these events is not a very strong indicator of a change in direction, the more a “bottom” or “top” is tested and holds, the more significant that price level becomes. Think about it this way. Let’s say crude oil Traders are trying to sell September contracts and push the price down to the $95.00 Support level on the chart above. Buyers step in at that price and the sell-off fails. The next day, Sellers again attempt to push prices down to $95.00, and again, the move fails. The market now begins to see $95.00 as a stronger Support price. We refer to this as a “double-bottom.” While this is still a good indicator of price levels, a third day, or “triple-bottom” is a very strong indicator that prices will rally higher. Traders have no choice but to recognize the buying interest at $95.00 and thus will buy contracts until the Resistance, or “top” is tested. The same holds true for Resistance levels, but in reverse. The more “tops” are established, the stronger the level at which Sellers will step-in and sell contracts.
The September, 2012, natural gas chart below clearly illustrates this point. On August 15th, prices reached a High of $2.84. The next day, this level was tested by Buyers and "held," resulting in a “double-top” at $2.84. After that, the market reversed direction and tested new Lows. But, $2.68 held for 3-consecutive days, forming a "triple-bottom." This caused prices to rally the next day.

3) “Head-and-shoulders” reversal patterns: These are identifiable, 3-day price patterns that signal a change in direction and can be used for long-term or short-term trend analysis. This consists of three consecutive trading days where the middle day’s High, or Low, is higher or lower than that of the other two days. The first day then represents the “left shoulder,” the second day is the “head,” and the third day is the “right shoulder.” Using the chart below without all the trendlines, we can see that on July 31st, the High for the day was higher than the 30th. We are now looking for the completion of the pattern the next day. And on August 1st, the High for the day was lower than the prior day. Now you can see the pattern whereby the 30th is the “left shoulder,” the 31st is the “head,” and the 1st is the “right shoulder.” The right shoulder “leans” in the direction of the price change. In this case, prices reversed from an uptrend to a downtrend. There are also “reverse” head-and-shoulders patterns. These occur in an upside-down fashion and signal a move from a downtrend to an uptrend. Looking at August 6th, we see that the day’s Low was lower than that on the 3rd. Then on the 7th, the pattern was completed as that day’s Low was higher than the 6th. Since the “right shoulder” is leaning upward, the trend is now upwards.

4) “Consolidation” patterns: when upper and lower trendlines are drawn and are parallel to one another and perpendicular to the Y axis, they form a rectangular shape. The upper trendline does represent Resistance, with the lower trendline indicating Support. In this pattern, prices will move up-and-down within the rectangle. This “consolidation” is indicative of market indecision. Traders are not really sure what direction prices should take. It is a battle between Buyers and Sellers. The key here is the number of days this pattern continues to exist. The longer Traders battle, the more momentum builds-up for when prices break-out of this range. Think of it as a spring that winds tighter and tighter for each day prices stay within the consolidation range. That means a very large price movement will occur in the direction of the breakout. A good illustration of this is the September, 2012 natural gas contract, shown below. Starting on June 25th, the contract bounded by a Low of $2.70 for sixteen straight days. The High was $2.91 with the exception of three attempted "break-outs" that failed as prices returned to the Channel. But on July 18th, prices broke-out to the upside with good momentum and hit a 6-month High.

These are but a few of the methods in Technical Analysis used to try to determine when a greater probability exists of prices moving in one direction vs. another. Once determined, Traders enter or exit the market at those price levels.
Lesson Activity: Technical Chart Analysis - Hidden
Lesson Activity: Technical Chart Analysis & on-going Trading Simulation
Using what you have learned in this lesson, answer the following questions regarding the chart below andsubmit your answers to the course TA.
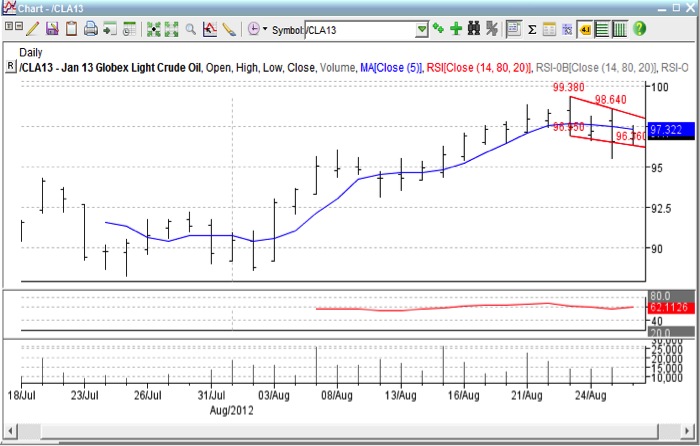 [22]
[22]
- What type of chart is this?
- What type of price information does it show?
- What is the prevailing trend?
- What does the blue line represent?
- What is the single red line in the second box?
- What is indicated in the bottom box?
- What are the two red lines connecting price points called?
- The point at which the upper red line crosses the right axis is called?
- The point at which the lower red line crosses the right axis is called?
- Is this market “overbought,” “oversold,” “neutral”?
Grading Criteria
You will be graded on the quality of your participation. See the grading rubric for specifics on how this assignment will be graded. Please submit you answers to the TA, Mike McCormick mwm5342@psu.edu [17].
Lesson 12: Risk Controls in Energy Commodity Trading - Hidden
Overview
On December 2, 2001, Enron Corp., at the time the world's largest energy trading company, declared bankruptcy, causing a loss of $11 billion dollars for its shareholders and billions more for its trading counterparties. At the time, it was the largest bankruptcy filing in US history. As events unfolded and the investigations took place, it was revealed that there were several "off-sheet," "paper" companies churning-out false earnings. These were "mark-to-market," unrealized earnings that had no cash gains associated with them. Ultimately, it was a lack of controls, or a failure to adhere to them, that allowed this to occur. Top executives at Enron were convicted and sent to prison, and their outside auditors, Arthur-Andersen, would go out of business.
In this lesson, we will learn about other famous cases where financial disasters took place due to a lack of controls and oversight. We will explore concepts such as "mark-to-market," and "Value at Risk," both financial risk measures that are mandatory for today's publicly-traded energy companies.
Learning Outcomes
At the successful completion of this lesson, students should be able to:
- Be familiar with famous case studies prompting risk control measures.
- Understand how and why risk controls were implemented in the energy industry.
- Define risk control responsibilities and key risk measures.
- Be able to recognize a proper risk control structure.
What is due for Lesson 12?
This lesson will take us one week to complete. There are a number of required activities in this module. The chart below provides an overview of the activities for Lesson 12. For assignment details, refer to the location noted.
All assignments will be due Sunday, 11:59 p.m. Eastern Time.
REQUIREMENT | LOCATION | SUBMITTING YOUR WORK |
|---|---|---|
| Reading Assignment: Case Studies | Reading Assignment page | No submission |
| Mini-Lecture: Risk Control | Mini-Lecture: Risk Control page | No submission |
| Lesson Activity: Baring's Bank Case Study Analysis | Lesson Activity page | Submitted through course blog |
| Lesson 12 Quiz | Summary and Final tasks page | Submitted through ANGEL |
Questions?
If you have any questions, please post them to our Questions? discussion forum (not e-mail), located under the Communicate tab in ANGEL. The TA and I will check that discussion forum daily to respond. While you are there, feel free to post your own responses if you, too, are able to help out a classmate.
Reading Assignment: Lesson 12 - Hidden
Case Study 1: Barings Bank, PLC. - Hidden
In February, 1995, Nick Leeson, a “rogue” trader for Barings Bank, UK, single-handedly caused the financial collapse of a bank that had been in existence for hundreds of years. In fact, Barings had financed the Louisiana Purchase between the US and France in 1803. Leeson was dealing in risky financial derivatives in the Singapore office of Barings. He was the lone trader there and was betting heavily on options for both the Singapore (SIPEX) and Nikkei exchange indexes. These are similar to the Dow Jones Industrial Average (DJIA) and the S&P500 indexes here in the US.
In the early 90s, Barings decided to get into the expanding futures/options business in Asia. They established a Tokyo office to begin trading on the Tokyo Exchange. Later, they would look to open a Singapore office for trading on the SIMEX. Leeson requested to set-up the accounting and settlement functions there and direct trading floor operations (different from trading). The London office granted his request and he went to Singapore in April, 1992. Initially, he could only execute trades on behalf of clients and the Tokyo office for "arbitrage" (Lesson 10) purposes. After a good deal of success in this area, he was allowed to pursue an official trading license on the SIMEX. He was then given some "discretion" in his executions meaning; he could place orders on his own (speculative, or "proprietary" trading).
Even after given the right to trade, Leeson still supervised accounting and settlements. And there was no direct oversight of his "book" and he even set-up a "dummy" account in which to funnel losing trades. So, as far as the London office of Barings was concerned, he was always making money because they never saw the losses and rarely questioned his request for funds to cover his "margin calls" (Lesson 7). He took on huge positions as the market seemed to "go his way." He also "wrote" options, taking-on huge risk (Lesson 10).
He was, in fact, perpetuating a "hoax" in his record-keeping to hide losses. He would set the prices put into the accounting system and "cross-trade" between the legitimate, internal, accounts and his fictitious "88888" account. He would also record trades that were never executed on the Exchange.
In January, 1995, a huge earthquake hit Japan, sending its financial markets reeling. The Nikkei crashed, which adversely affected Leeson's position (remember, he had been selling Options). It was only then that he tried to hedge his postions, but it was too late. By late February, he faxed a letter of resignation, and when his position was discovered, he had lost ($1.4 billion USD). Barings became insolvent and was sold to a competing bank for $1.00!
(If you are interested in more details regarding this infamous case, you can read "Rogue Trader" by Nick Leeson himself. There is also a movie of the same name starring Ewan McGregor which should be available for rent in DVD format.)
The following two cases are brief descriptions of similar, catastrophic losses by traders with little, or no, oversight.
Case Study 2: Orange County, CA - Hidden
Robert Citron was the Treasurer for Orange County, California, in the early 90s. He was solely responsible for investing several of the county’s funds which totaled about $7.5 billion USD. Despite having no background in trading financial instruments, he decided to invest in risky interest rate swaps that were tied to the US Treasury Department’s rates.
Citron was a County Tax Collector with no college degree who was later elected to the position of Orange County Treasurer. In this capacity, he was able to push for California legislative approval for county treasurers to increase their use of financial instruments for investment and fund management.
He was attempting to artbitrage the difference between short-term and long-term interest rates. His position was sound and he could make money so long as short-term rates remained low. During his tenure, the average return on county investments was a healthy 9.4%, but interest rates had been low for that long.The position he took would lose money if interest rates rose. And, he inflated the county’s volumetric position by entering into other derivatives that would also be negatively impacted by higher interest rates.
Beginning in February, 1994 the Federal Reserve Board made the first of six consecutive interest rate hikes. Between February and May of that year, the County had to produce $515 million in cash (margin) to cover its position. Further margin calls would occur throughout year, leaving the County's cash reserves at only $350 million by November, 1994.
When word got out about the County's troubles raising cash, investors sought to retrieve their money, and by December 6, 1994, the County declared bankruptcy and lost ($1.64) billion.
Case Study 3: Metallgesellschaft (MG) - Hidden
MG was a huge, German industrial conglomerate that decided to open an energy trading office in the US in the early 90s.
The original plan was threefold:
- Sell refined products in the forward, physical market.
- Invest in refining capacity to produce the products.
- Hedge the forward sales through financial derivatives.
When the strategy was first implemented in 1992, current physical prices were lower than the futures prices. So the sales contracts were set at those higher prices. And it meant that purchasing the "near" month futures contracts would be profitable. So MG developed a strategy whereby they would cover the long-term, fixed-price sales by buying contracts in these few, near months. As each month "rolled-off," they would merely buy contracts in the next month. It was their intent to continue this process until the physical product sales contracts expired in (10) years. This strategy worked as long as the futures market was in "backwardation," whereby each successive month is less than the prior one (Lesson 7).
One of the major flaws in this approach, however, was the volume of contract being traded since they were "loading-up" on closer month contracts. Add to that the fact that they would not get paid for the product sales for years out, and you begin to have a cash flow problem where margin calls are concerned. Their position in the Fall of 1993 was estimated to be between 160 to 180 million barrels stretched-out over the following (10) years.
In 1993, prices fell as the market received a "bearish" signal from OPEC on production quotas. This lowered futures prices and reversed the market from "backwardated" to "contango," whereby each successive month's price is higher than the prior one (Lesson 7). Faced with this position, MG management was changed and the new team was directed to close all positions. This resulted in losses on the futures purchases totalling almost ($1.5) billion USD. The had to seek bailout funds from one of their banks, and in return, had to sell-off several divisions.
Mini-Lecture: Risk Control - Hidden
Key Lessons Learned by Examining the Case Studies
There were some common themes that ran through each of these cases.
- Single, or small groups, of “rogue” Traders (little supervision over the decision-making process).
- The use of risky financial derivatives.
- Lack of real accounting/auditing oversight and/or Trader controlled these.
- No trading policies, controls, etc., in-place.
- “Hidden” trade losses.
- Lack of executive knowledge and understanding of the inherent risks in trading.
- Trading positions increased to lessen impact of losses led to increased exposure (so-called, “doubling-down”).
These events, along with others, prompted the financial industry to institute ways to monitor, track and stay on top of, financial derivative trading. These same methods would later have to be adopted by publicly traded energy companies in the US.
Key Learning Points for the Mini-Lecture: Risk Control
- Severe losses by “rogue” Traders led to the establishment of controls for financial derivative trading in the banking and finance businesses.
- These “risk measures” were later made mandatory for the energy industry.
- Companies face more than just financial risk, such as legal, operational, credit.
- Necessary risk controls, measures, reports and organizational structure.
- “mark-to-market”
- “Value at Risk”
- “P&L”
- Volumetric
- Risk Control Group/Chief Risk Officer/Risk Oversight Committee
Lesson Activity: Baring's Bank Case Study - Hidden
Lesson Activity: Baring's Bank Case Study
Using the information presented in this Lesson, evaluate the Baring's Bank case to determined where the flaws were in the risk controls.
- What controls were lacking in the Singapore office?
- What were Nick Gleeson's biggest mistakes?
- What should London have done to prevent this?
- What controls/guidelines do you think should've been in place?
- Using the "Recommendations" I have presented, which of these would you recommend in this instance?
Submit your findings on the course blog.
Grading Criteria
You will be graded on the quality of your participation. See the grading rubric for specifics on how this assignment will be graded.
Summary and Final Tasks - Hidden
Key Learning Points: Lesson 12
- Catastrophic losses in the financial industry were caused by trading in risky financial derivatives.
- Similar themes and events existed among them all.
- A system of risk controls was established within the financial community to better monitor and quantify this trading activity.
- “mark-to-market” gives the current value of all “open” trading positions based on daily market prices.
- “P&L” is the estimated profit and/or loss determined by the mark-to-market calculations.
- “Value @ Risk” (VaR) is a theoretical measure of the maximum potential loss for a trading book.
- Corporations face various risk exposures. Among them are:
- Financial
- Market
- Counterparty
- Operation
- Credit
- Legal
- Publicly-traded energy companies engaged in trading financial derivatives were required to implement risk controls by FY2000.
- Companies need to have a defined risk control structure in-place including:
- Standard risk metrics
- Daily reporting requirements
- Risk Policies and Procedures
- Violations reporting
- Independent Risk Control Staff headed by a Chief Risk Officer
- Risk Oversight Committees comprised of top executives
Quiz
Log onto ANGEL and complete the Lesson 12 Quiz (located in the Quizzes, Surveys, Midterm, and Final Exam folder).Reminder - Complete all of the Lesson 12 tasks!
You have reached the end of Lesson 12. Double-check the list of requirements on the first page of this lesson to make sure you have completed all of the activities.
Syllabus - Tom Seng Version
EBF 301 - Global Finance for the Earth, Energy, and Materials Industries
This syllabus is divided into several sections. You can read it sequentially by scrolling the length of the document or by clicking on any of the links below to “jump” to specific sections. It is essential that you read the entire document as well as material covered in the course Orientation. Together these serve as our course "contract."
- Instructor
- Course Overview
- Required Course Materials
- Assignments and Grading
- Course Schedule
- Course Policies
- Technical Requirements
Instructor
Tom Seng
College of Earth and Mineral Sciences, The Pennsylvania State University.
- E-mail: Please use the course e-mail system (see the Communicate tab in ANGEL).
- Office Hours: I live in Tulsa, Oklahoma which is in the United States Central time zone (CST). I am one hour behind the Eastern time zone (EST) for those of you on the East Coast. I will try to check for and reply to messages at least once a day. Please contact me to make an appointment if you’d like to speak to me at a given time. I am flexible and will make every effort to accommodate your schedule.
Course Overview
Description: The aim of this course is to introduce fundamental concepts of physical and financial energy commodity trading.
The course will cover the physical and financial aspects of the following energy commodities – crude, natural gas, natural gas liquids, gasoline, and power. The physical “path” of each commodity from the point of production to the point of use will be explained, as well as, the “value chain” that exists for each. Commodity market pricing, both cash and financial, will be presented, encompassing industry “postings” for cash, commodity exchanges, and “over-the-counter” markets. The use of financial derivatives to reduce market price risk (“hedging”) will be presented, and “real world” examples will be utilized. Students will “trade” mock energy contract portfolios using a trading simulator (factsim.org)while learning about “mark-to-market” and risk controls. Financial contracts for crude oil and natural gas will be used with students justifying their "buy/sell' trades using both fundamental and technical analysisy. Other energy sources such as coal, nuclear, and alternative energy will not be covered in any great detail.
The course will largely be comprised of online narrative, audio lectures, and required readings. Students will use standard pricing and hedging models to work “real world” problems from both producer and consumer perspectives. Online forums will be available for student discussion with Instructor feedback and contribution. There will also be several case studies presented involving disastrous trading results where a lack of risk controls were present.
When you successfully complete this course, you will be prepared to:
- Understand the nature of energy commodity logistics, i.e., the ways in which energy production is delivered to the ultimate consumer.
- Establish costs and revenues associated with the movement of energy commodities from point of production to point of consumption, (the so-called economic “value chain”).
- Describe market pricing both “cash” and financial, including how prices are established. Identify key industry pricing publications, financial exchanges, and “over-the-counter” markets.
- Define energy financial derivatives, including futures, forwards, swaps, spreads and options. Illustrate how they are traded and their use for “hedging” market price risk and which industry segments utilize them.
- List the “do’s and don’ts” of energy commodity trading, i.e., risk controls and trading limits.
EBF 301 will be conducted entirely on the World Wide Web. There will be no set class meeting times, but you will be required to complete weekly assignments. The content of this course is divided into 14 lessons. Each lesson will be completed in approximately 1 week (subject to change). All assignments will be due Sunday, 11:59 p.m. Eastern Time on the week assigned.
What I Expect of You
On average, most students spend seven to nine hours per week working on course assignments. Your workload may be more or less depending on your study habits.
I have worked hard to make this the most effective and convenient educational experience possible. The Internet may still be a novel learning environment for you, but in one sense it is no different from a traditional college class: how much and how well you learn is ultimately up to you. You will succeed if you are diligent about keeping up with the class schedule and if you take advantage of opportunities to communicate with me and with your fellow students.
Specific learning objectives for each lesson and project are detailed within each lesson. The class schedule is published below.
Required Course Materials
- Fundamentals of Trading Energy Futures & Options, 2nd Edition, Steven Errera and Stewart L. Brown. Pennwell, 2002. ISBN 0-8714-836-1. (Core text on trading.) You may purchase the text through your favorite local or online bookseller.
- FACTSim.org Commodity Trading Simulation: University of Florida energy commodity simulation. Students will have to go to "www.factsim.org [23]" to register. Cost is $50 (Note: Access is active for six months from the time of purchase.) Instructions for registration and use will be posted in ANGEL.
All additional materials needed for this course are presented online through this course website and in ANGEL. In order to access all materials, you need to have an active Penn State Access Account user ID and password (used to access the on-line course resources). If you have any questions about obtaining or activating your Penn State Access Account, please contact the Outreach Helpdesk [24] (if you are a World Campus student) or the Penn State HelpDesk [25] if you are a resident student.
Assignments and Grading
EBF 301 will rely upon a variety of methods to assess and evaluate student learning, including:
- Quizzes allow you to practice your mastery of the terms and concepts in the lessons.
- Lesson Activities & Reflection/Discussion
- Trading & Reflection/Discussion
- Mid-term Exam and Final Exam evaluate your ability to synthesize and apply terms and concepts from throughout the course.
| Assignment | Percent of Grade |
|---|---|
| Quizzes | 15% |
| Lesson Activities | 10% |
| Midterm Exam | 25% |
| Final Exam | 25% |
| Fundamental Factors & Trading | 25% |
It is important that your work be submitted in the proper format to the appropriate place by the designated due date. Many of these activities require some interpretation and independent thinking on your part. As you are working on assignments, you are encouraged to share ideas and questions you may have in the "Questions?" Discussion Forum located in ANGEL. I will read daily and reply as needed.
Assignments are due by 11:59 p.m. Eastern Time on Sunday evenings.
You will earn a grade that reflects the extent to which you achieve the course learning objectives listed above. Grades are assigned by the percentage of possible points earned in each lesson's activities.
Make-Up Exams
Make-up exams will not be offered except in the case of University-excused absences.
Grades
I will use the ANGEL gradebook to keep track of your grades. You can see your grades in the gradebook, too, by clicking the Reports tab in ANGEL, then choosing "Grades" from the "Category" dropdown menu, then clicking "Run." Overall course grades will be determined as follows. Percentages refer to the proportion of all possible points earned.
| Letter Grade | Percentages |
|---|---|
| A | 93 - 100 % |
| A- | 90 - 92.9 % |
| B+ | 87 - 89.9 % |
| B | 83 - 86.9 % |
| B- | 80 - 82.9% |
| C+ | 77 - 79.9 % |
| C | 70 - 76.9 % |
| D | 60 - 69.9 % |
| F | < 60 % |
| X | Unsatisfactory (student did not participate) |
Course Schedule
Below you will find a summary of the primary learning activities for this course and the associated time frames. All assignments will be due Sunday, 11:59 p.m. Eastern Time on the week assigned.
|
Lesson |
Start Date |
Objectives/Assignments |
||||
|---|---|---|---|---|---|---|
| Course Orientation | Aug. 24 |
Objectives
Assignments
|
||||
| Lesson 1: The Energy Industry – Overall Perspective |
Aug. 31 |
Objectives
Assignments
|
||||
| Lesson 2: Supply/Demand Fundamentals for Natural Gas & Crude Oil |
Sept. 7 |
Objectives
Assignments
|
||||
| Lesson 3: The New York Mercantile Exchange (NYMEX) & Energy Contracts |
Sept. 14 |
Objectives
Assignments
|
||||
| Lesson 4: NYMEX Order Execution & Electronic Trading |
Sept. 21 |
Objectives
Assignments
|
||||
| Lesson 5: Energy Commodity Logistics - Crude Oil |
Sept. 28 |
Objectives
Assignments
|
||||
|
Lesson 6: |
Oct. 5 |
Objectives
Assignments
|
||||
|
Mid-Term Exam Opens |
Oct. 12 |
Assignments
|
||||
|
Lesson 7: Transmission Pipeline Rules, Regulations & Rates MID-TERM CLOSES Oct 19 |
Oct. 19 |
Objectives
Assignments
|
||||
| Lesson 8: Pricing Methodologies
|
Oct. 26 |
Objectives
Assignments
|
||||
| Lesson 9: Basic Energy Risk “Hedging” using Financial Derivatives |
Nov. 2 |
Objectives
Assignments
|
||||
| Lesson 10: Advanced Financial Derivatives - Swaps, Spreads, and Options |
Nov. 9 |
Objectives
Assignments
|
||||
|
Lesson 11: |
Nov. 16 |
Objectives
Assignments
|
||||
|
Lesson 12: Risk Controls in Energy Commodity Trading
FINAL EXAM OPENS Dec. 7 |
Nov. 30 |
Objectives
Assignments
|
||||
|
Final Exam CLOSES |
11:59pm on Dec. 15 |
Assignments
|
||||
Course Policies
- Penn State E-mail Accounts
All official communications from the Penn State World Campus are sent to students' Penn State e-mail accounts. Be sure to check your Penn State account regularly, or forward your Penn State e-mail [26] to your preferred e-mail account, so you don't miss any important information. - Deferred Grades
If you are prevented from completing this course within the prescribed amount of time, it is possible to have the grade deferred with the concurrence of the instructor. To seek a deferred grade, you must submit a written request (by e-mail or U.S. post) to your instructor describing the reason(s) for the request. It is up to your instructor to determine whether or not you will be permitted to receive a deferred grade. If, for any reason, the course work for the deferred grade is not complete by the assigned time, a grade of "F" will be automatically entered on your transcript. - Late Policy
I do not expect any "late work." In exceptional circumstances, you should contact me. The earlier you contact me to request a late submission, the better. Requests will be considered on a case by case basis. Generally, late assignments will receive a grade of -0-. All assignments will be due Sunday, 11:59 p.m. Eastern Time on the week assigned.Consider each Lesson to be one week of the semester unless otherwise notified to the contrary. Course lessons are available to you in advance. It is your responsibility to plan ahead and work ahead if necessary to accommodate your personal schedule. This flexibility is one of the great features of online learning. Take advantage of it! - Academic Integrity
This course follows the guidelines for academic integrity of Penn State's College of Earth and Mineral Sciences [27]. Penn State defines academic integrity as "the pursuit of scholarly project in an open, honest and responsible manner." Academic integrity includes "a commitment not to engage in or tolerate acts of falsification, misrepresentation, or deception." In particular, the University defines plagiarism as "the fabrication of information and citations; submitting other's work from professional journals, books, articles, and papers; submission of other student's papers, lab results or project reports and representing the work as one's own." Penalties for violations of academic integrity may include course failure. To learn more, see Penn State's "Plagiarism Tutorial for Students [28]." I cannot overemphasize the importance of academic integrity. DO NOT copy and paste from unreferenced sources. Without exception: if you use a direct quote from any source, as part of any submitted assignment, the quote must be clearly noted and properly referenced. (In-line references are fine.) - Citation and Reference Style
Academic Integrity and Citation Style Guide [29] - Accommodating Disabilities
Penn State welcomes students with disabilities into the University's educational programs. Every Penn State campus has an office for students with disabilities. The Office for Disability Services (ODS) Web site provides contact information for every Penn State campus [30]. For further information, please visit the Office for Disability Services Web site [31].
In order to receive consideration for reasonable accommodations, you must contact the appropriate disability services office at the campus where you are officially enrolled, participate in an intake interview, and provide documentation [32]. If the documentation supports your request for reasonable accommodations, your campus’s disability services office will provide you with an accommodation letter. Please share this letter with your instructors and discuss the accommodations with them as early in your courses as possible. You must follow this process for every semester that you request accommodations. - Military Personnel
Veterans and currently serving military personnel and/or spouses with unique circumstances (e.g., upcoming deployments, drill/duty requirements, disabilities, VA appointments, etc.) are welcome and encouraged to communicate these, in advance if possible, to the instructor in the case that special arrangements need to be made. - Inclement Weather
In case of weather-related delays at the University, this online course will proceed as planned. Your instructor will inform you if there are any extenuating circumstances regarding content or activity due dates in the course due to weather delays. If you are affected by a weather-related emergency, please contact your instructor at the earliest possible time to make special arrangements. - Netiquette
The term "Netiquette" refers to the etiquette guidelines for electronic communications, such as e-mail and bulletin board postings. Netiquette covers not only rules to maintain civility in discussions, but also special guidelines unique to the electronic nature of forum messages. Please review Virginia Shea's "The Core Rules of Netiquette [33]" for general guidelines that should be followed when communicating in this course. - Connect Online with Caution
Penn State is committed to educational access for all. Our students come from all walks of life and have diverse life experiences. As with any other online community, the lack of physical interaction in an online classroom can create a false sense of anonymity and security. While one can make new friends online, digital relationships can also be misleading. Good judgment and decision making are critical when choosing to disclose personal information with others whom you do not know.
Technical Requirements
For this course, we recommend the minimum technical requirements outlined on the Dutton Institute Technical Requirements page, including the requirements listed for same-time, synchronous communications. If you need technical assistance at any point during the course, please contact the Outreach Helpdesk [24] (for World Campus students) or the Penn State HelpDesk [25] (for students at all other campus locations).
NOTE: Access to a reliable Internet connection is required for this course. A problem with your Internet access may not be used as an excuse for late, missing, or incomplete coursework. If you experience problems with your Internet connection while working on this course, it is your responsibility to find an alternative Internet access point, such as a public library or Wi-Fi ® hotspot.
Disclaimer: Please note that the specifics of this Course Syllabus can be changed at any time, and you will be responsible for abiding by any such changes. Changes will be posted to the course discussion forum.
Using the EBF 301 Course Blog
For this course, we'll be utilizing a PSU blog for our activities and discussion. Here, you'll post your activities from each of the lessons and connect with your classmates to discuss issues.
- Go to the course blog homepage [34].
- You will need to sign in to be able to create posts. The 'Log In' button is in the top left corner. Once you are signed in, you should see your name appear in the upper right.
- On the home page of the blog, there's a brief introduction about what we'll be using the blog space for. Take a minute to read over this introduction.
- On the navigation bar, click "Blog," and this will take you directly to the postings of the instructor and your classmates. Here you can also access postings by category.
- To create a new blog post, hover over the "+ New" button at the top near where you logged in and select "Post."
- Give your introduction a good descriptive title, and include your name in this and every blog post title. Then follow the activity prompt here in the orientation to complete the introduction blog post assignment.
- Take some time to go through your classmates' intros - maybe you'll find someone you have a lot in common with! Or, someone who's worked in a field you're interested in pursuing. Leave a comment or two on your classmates' posts.
A note about your blog postings....
A blog is a great asynchronous way for us to have a discussion as a class. As such, it is somewhat less formal than a written paper or other type of written assessment. However, this informality has boundaries that are important for you to understand and follow. Your blog postings in this course are part of a series of assessments on which you will be graded, and in order to ensure you're getting the most points possible, you should consider the following:
- A blog posting is not a text message. Your blog posting should be well-written, edited, and punctuated. While it's common for us to write blog postings as they come to us off the tops of our heads, that doesn't mean that you should just type it out, hit submit, and walk away. You need to edit a post, just like you would a paper, before you submit it.
- Your posts are a reflection of you. Most, if not all of what you post to the Course Blog will challenge you to support your opinion on an issue with facts, making the postings somewhat subjective in nature. Your postings and comments on classmates' postings are an opportunity for you to illustrate professionalism in academic discussion. Take pride in the work you do for this class (and all your classes!).
- Keep it professional. The subject matter of our course is, in some ways, controversial and may spark lively discussions and debates. That's fine - in fact, that's good! But, it is important to do so in a way that is professional and appropriate. Arguments are more compelling when they're made with facts than emotion, anyway, so back up what you're saying!