Assumption: Increasing Marginal Cost of Production
Background
Economic models also assume increasing marginal costs of production. Marginal costs are the costs of each additional unit of output. For example, if a factory is running at full capacity, producing additional units may require paying overtime. In some cases, marginal costs are small. For example, the music and software businesses. And sometimes marginal costs will initially drop due to economies of scale but eventually rise again as quantities get higher and higher. But, in general, economic models assume that marginal costs increase as quantity goes up.
Similar to the way consumers experience diminishing marginal utility, output producing firms derive more productive benefit from their first input units to production. And successive inputs to production yield smaller marginal additions to output. For example, an apple farmer may increase production by investing in a pound of fertilizer. (Let’s assume it is organic!) But the second pound of fertilizer will increase apple production to a lesser degree. Consequently, equivalent incremental increases in apple production will require successively increasing expenditures on fertilizer.
For the producer, the price paid by the consumer for each unit of good or service is the marginal revenue of output. As long as this revenue exceeds the costs of inputs required in production, the producer will continue to produce.
Our model assumes that marginal costs are increasing. Eventually, if prices remain constant, the cost of producing the next unit will outweigh the marginal revenue (benefit) of the next unit. Firms will increase production until they achieve this level of output.
Analysis, Supply Curve
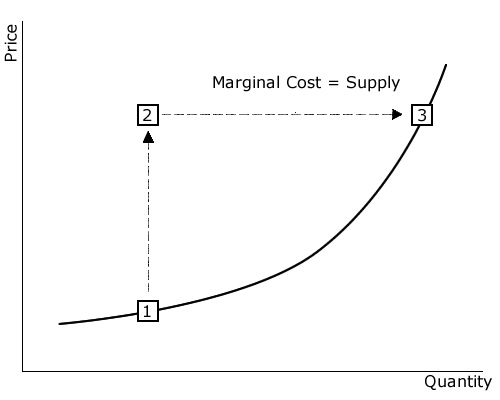
Increasing marginal costs of production result in a positive relationship between the price of a good and the total quantity of that good supplied to the marketplace. Graphically, we call this relationship a supply curve. As the price of a produced good is increased, from point 1 to point 2, for example, firms will find that the point at which marginal costs exceed marginal revenue occurs at a higher total production quantity. Firms will increase production to this level of output, and total units supplied to the marketplace will increase, to point 3 in the figure above. Similarly, as the price of a produced good is decreased, firms will find that marginal costs exceed marginal revenues at a lower number of output units, firms will decrease output to this level, and the total number of units supplied to the marketplace will decrease.
Shifts in Supply Curve
The quantity of a good supplied in the marketplace is dependent upon other factors in addition to price. These factors can cause the supply curve to shift to the left or right. For example, if the costs of inputs decline, then suppliers can afford to supply a larger quantity of a good at any given price level. And technological advances can shift a supply curve. For example, technological improvements in computing processor design and manufacturing had a profound impact on the markets for computers, cellphones, and other ‘smart’ consumer electronic devices. These technological innovations increased the supply of products that manufacturers were capable of producing at any given price level, leading to a significant reduction in prices to consumers.
Real World Example
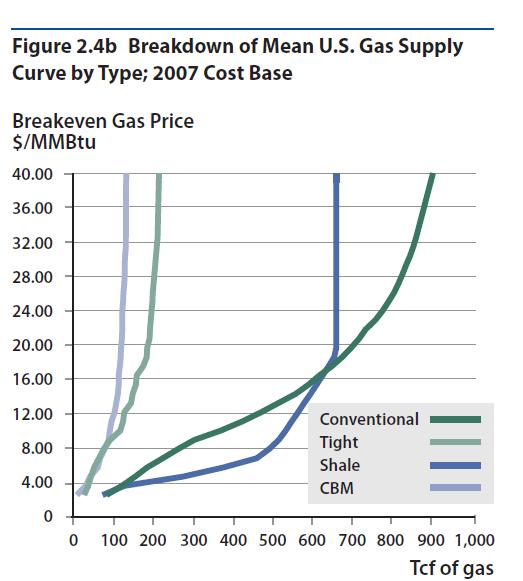
A 2011 report, The Future of Natural Gas, includes the supply curves shown below. The marginal costs increase differently depending on the source of the natural gas. We’ll discuss these details in a later lesson!