If mutually exclusive projects that are being analyzed don’t have the same lifetimes (for example, one investment has a length of 8 years and the other alternative example has the length of 12 years), we have to be careful using the parameters that we have learned so far.
NPV analysis
We can continue the NPV analysis without any problem for mutually exclusive projects with different lifetimes. This is because NPV analysis considers a common point in time for all projects, which is the present time.
It is also important to know that for NPV analysis, different discount rates may cause different results and may change the ranking of the projects. Thus, the selected discount rate for such should be representative of the opportunity cost of capital for consistent economic decision-making.
ROR analysis
For ROR analysis (and other analysis, such as future value, that require a specific point on the timeline) of mutually exclusive projects with different lifetimes, we need to find a common lifetime and analyze the alternatives based on that. This common lifetime is usually the longest lifetime between alternatives.
For ROR analysis, treat all projects as having an equal life that is equal to the longest life project with net revenues and costs of zero in the later years of shorter life projects.
Example 4-2:
Consider the following two mutually exclusive projects:
Assume a minimum rate of return of 8%
Project A
| C=1000 | I=250 | I=250 | I=250 | I=250 | I=250 | I=250 | I=250 |
|
|
|||||||
| 0 | 1 | 2 | 3 | 4 | 5 | 6 | 7 |
Project B
| C=2000 | C=3000 | I=1000 | I=1000 | I=1000 | I=1000 | I=1000 | I=1000 | I=1000 | I=1000 | I=1000 |
|
|
||||||||||
| 0 | 1 | 2 | 3 | 4 | 5 | 6 | 7 | 8 | 9 | 10 |
First, we need to evaluate each project individually and see if both are economically satisfactory.
Project A evaluation:
For project A: ROR> i*=8%, NPV is positive, B/C is higher than 1, and PVR is positive. So, project A is economically satisfactory.
Project B evaluation:
For project B: ROR> i*=8%, NPV is positive, B/C is higher than 1, and PVR is positive. So, project B is also economically satisfactory.
Please note that project A has a lifetime of seven years, while project B’s lifetime is 10 years. In this case, we chose the project with the longest lifetime (here, project B) as the base case and put zero for the years that project A doesn’t have any payment. Then we deduct the cash flow of project A from the cash flow of project B as incremental cash flow:
| -1000 | -3250 | 750 | 750 | 750 | 750 | 750 | 750 | 1000 | 1000 | 1000 |
|
|
||||||||||
| 0 | 1 | 2 | 3 | 4 | 5 | 6 | 7 | 8 | 9 | 10 |
Since the incremental project (B-A) is economically satisfactory, we can conclude that project B is better than project A.
Note that
Example 4-3:
Consider this situation that a manager faces. There are three alternatives:
- investing in development plan A, as shown in the following cash flow;
- investing in development plan B, as shown in the following cash flow;
- selling the property for $150 in cash. Apply the ROR, NPV, and PVR analysis to find the best economic alternative assuming a minimum rate of return of 15%, and then repeat the assessment for a minimum rate of return of 20%.
| Year | 0 | 1 | 2 | 3 | 4 | 5 | 6 | 7 | 8 | 9 | 10 |
|---|---|---|---|---|---|---|---|---|---|---|---|
| A | -200 | -350 | 100 | 100 | 150 | 150 | 150 | 150 | 150 | -- | -- |
| B | -300 | -400 | 200 | 200 | 200 | 200 | 200 | 200 | 200 | 200 | 200 |
| Sell | 150 | -- | -- | -- | -- | -- | -- | -- | -- | -- | -- |
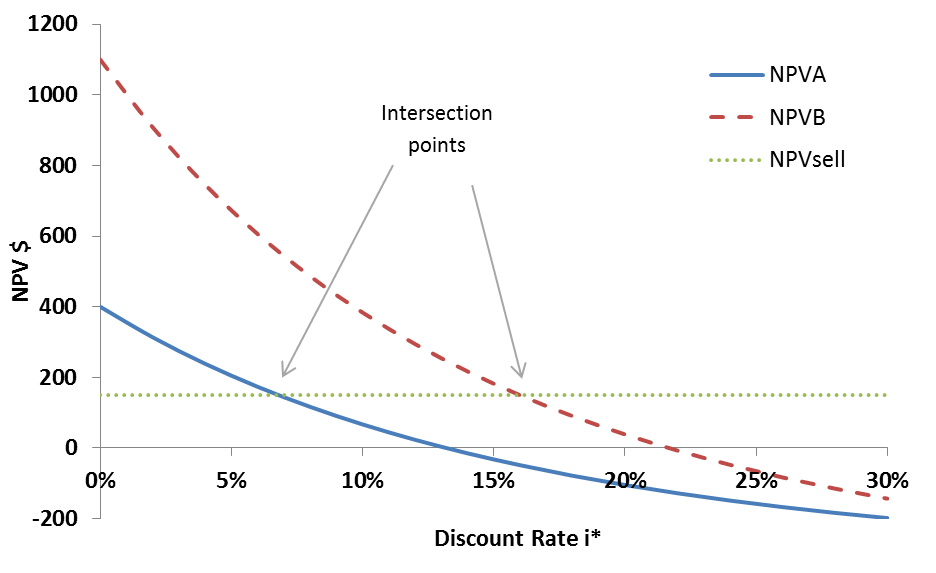
Figure 4-1: cash flow for three alternatives: 1) Development plan A, 2) Development plan B, 3) Sell the property
RORA = 13.2% ROR is less than minimum rate of return of 15%, so the project is not economically satisfactory
. NPV is negative, so the project is not economically satisfactory
. PVR is negative, so the project is not economically satisfactory.
RORB=21.65% ROR is higher than the minimum rate of return of 15%, so the project is economically satisfactory
. NPV is positive, so the project is economically satisfactory
. PVR is positive, so the project is economically satisfactory.
ROR, NPV, and PVR analysis indicate that development plan B is better than investing money at a minimum rate of return of 15%.
The NPV, ROR, and PVR for selling the property:
RORsell = +∞ higher than the minimum rate of return of 15%, so the project is economically satisfactory
NPVsell = +150 is positive, so the project is economically satisfactory
PVRsell = +∞ is positive, so the project is economically satisfactory
Since NPVB is higher than NPVsell, the above analyses show that development plan B is the best economic choice among the three alternatives.
In order to compare development plan B and selling the property, we can also apply the incremental analysis as:
| Year | 0 | 1 | 2 | 3 | 4 | 5 | 6 | 7 | 8 | 9 | 10 |
|---|---|---|---|---|---|---|---|---|---|---|---|
| B-sell | -450 | -400 | 200 | 200 | 200 | 200 | 200 | 200 | 200 | 200 | 200 |
which is greater than 15%, so project B is economically satisfactory.
is positive, so it is economically satisfactory.
0.04 is positive, so it is economically satisfactory.
As previously explained, the incremental analysis will always lead to selecting the alternative with the largest individual NPV. Therefore, development plan B is the best economic choice. However, note that project B does not have the highest ROR or PVR.
Assuming the minimum rate of return of 20%
It is negative, so the project is not economically satisfactory.
. NPV is positive, so the project is economically satisfactory
NPVsell= +150 is positive, so the project is economically satisfactory.
Therefore, at a minimum rate of return of 20%, selling the property is the best economic choice.
As calculations show, results are sensitive to discount rates (minimum rate of return)
Mutually exclusive projects with different starting dates
Example 4-4:
Consider two alternatives: development plan B, and selling the property. But assume that development plan B will start in the second year. Which project is the best economic choice at a minimum rate of return of 15%?
Cash flow for these alternatives:
| Year | 0 | 1 | 2 | 3 | 4 | -- | 12 |
|---|---|---|---|---|---|---|---|
| B | -- | -- | -300 | -400 | 200 | 200 | 200 |
| Sell | -150 | -- | -- | -- | -- | -- | -- |
In this case, NPV indicates that selling the property is the best economic choice. NPV is positive, so it is economically satisfactory.
NPVsell=150 is positive, so it is economically satisfactory.
Incremental analysis can also be done as:
| Year | 0 | 1 | 2 | 3 | 4 | -- | 12 |
|---|---|---|---|---|---|---|---|
| B-sell | -150 | -- | -300 | -400 | 200 | 200 | 200 |
RORB-sell = 11.11% which is lower than 15% minimum rate of return
which is negative, so it is not economically satisfactory.
Thus, choosing development plan B overselling the property is not economically acceptable.