
The Importance of Energy to the Economy, the Environment, and the World
The Economy
As we walk through our daily lives, it becomes very easy to take for granted the almost complete dependence we have, as humans in a post-industrial economy, on the incredible supply of inexpensive and convertible energy. If we live in anything other than a tropical climate, we require heating so that we don’t freeze. We use energy to till our fields and harvest our food. We also use energy to provide light during non-daylight hours as well as power machines that allow for inexpensive manufactures such as clothing and other household items. We move about, except when walking or bicycling, through the conversion of some sort of potential energy into the kinetic energy of the plane, train, automobile, or boat. And finally, we use energy to communicate and store and manipulate data. This vast network of comfort, nourishment, nutrition, transportation and information would be utterly impossible without inexpensive and readily dispatchable energy. It is literally the life’s blood of the entire economic system.
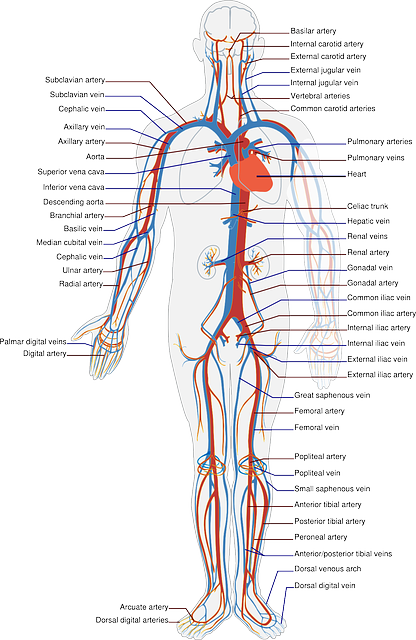
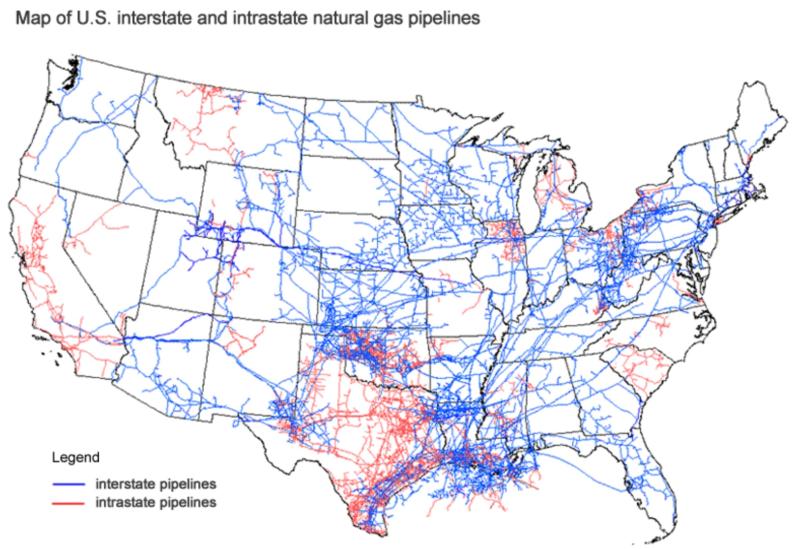
The resemblance between the human circulatory system and the natural gas grid (or the electric transmission and distribution grid) is similar, and the energy delivery system is almost as crucial to the economy as the circulatory system is to the human.
This chart shows the dependence on energy of various economies around the world. This is directly showing Tons of Oil equivalent to make $1,000 of GDP. A tonne of oil is equivalent to 7.44 barrels or 11,630 kWh. The implications are massive. Every 1,000 dollars of GDP in the US has at least 1 MWh or almost a barrel of oil embedded in it. More importantly, this offers no quantification of the risk to the economy should this energy supply be disrupted. Then the energy intensity would increase massively and whole supply chains and communication networks would be disrupted.
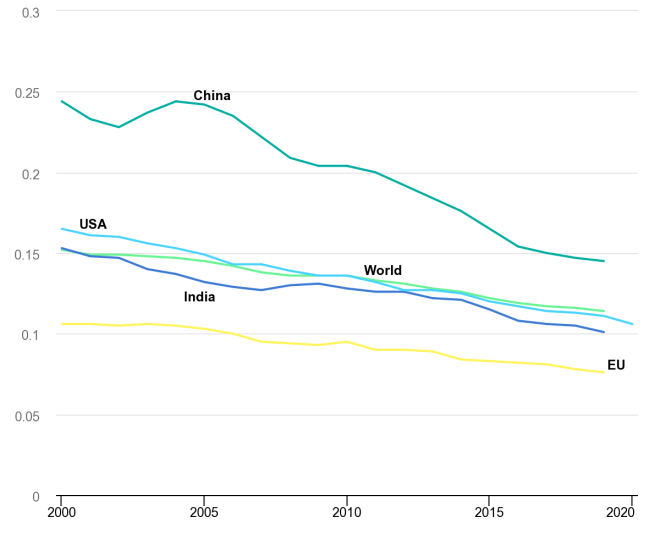
| USA | India | World | China | EU | |
|---|---|---|---|---|---|
| 2000 | 0.165 | 0.153 | 0.152 | 0.244 | 0.106 |
| 2001 | 0.161 | 0.148 | 0.149 | 0.233 | 0.106 |
| 2002 | 0.16 | 0.147 | 0.149 | 0.228 | 0.105 |
| 2003 | 0.156 | 0.14 | 0.148 | 0.237 | 0.106 |
| 2004 | 0.153 | 0.137 | 0.147 | 0.244 | 0.105 |
| 2005 | 0.149 | 0.132 | 0.145 | 0.242 | 0.103 |
| 2006 | 0.143 | 0.129 | 0.142 | 0.235 | 0.1 |
| 2007 | 0.143 | 0.127 | 0.138 | 0.222 | 0.095 |
| 2008 | 0.139 | 0.13 | 0.136 | 0.209 | 0.094 |
| 2009 | 0.136 | 0.131 | 0.136 | 0.204 | 0.093 |
| 2010 | 0.136 | 0.128 | 0.136 | 0.204 | 0.095 |
| 2011 | 0.132 | 0.126 | 0.133 | 0.2 | 0.09 |
| 2012 | 0.127 | 0.126 | 0.131 | 0.192 | 0.09 |
| 2013 | 0.127 | 0.122 | 0.128 | 0.184 | 0.089 |
| 2014 | 0.125 | 0.121 | 0.126 | 0.176 | 0.084 |
| 2015 | 0.12 | 0.115 | 0.122 | 0.165 | 0.083 |
| 2016 | 0.117 | 0.108 | 0.119 | 0.154 | 0.082 |
| 2017 | 0.114 | 0.106 | 0.117 | 0.15 | 0.081 |
| 2018 | 0.113 | 0.105 | 0.116 | 0.147 | 0.078 |
| 2019 | 0.111 | 0.101 | 0.114 | 0.145 | 0.076 |
| 2020 | 0.106 | -- | -- | -- | -- |