The Environment
The Environment
The constituents of global greenhouse gas emissions (those gasses which contribute to global warming) can be seen below:
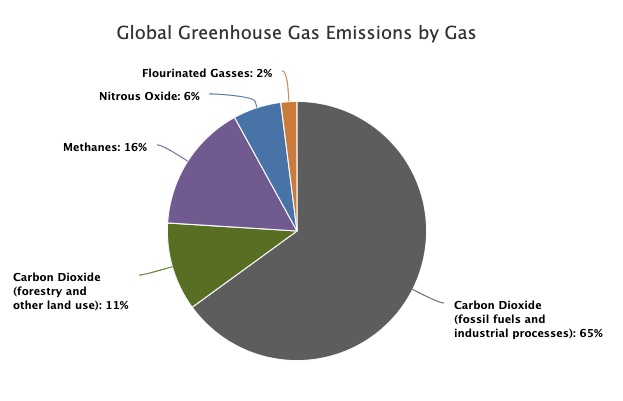
Figure 1.4: Global Greenhouse Gs Emissions by Gas
Click for a text description of this image.
| Source | 2010 Data |
|---|---|
| Carbon Dioxide (fossil fuels and industrial processes) | 65% |
| Carbon Dioxide (forestry and other land use) | 11% |
| Methane | 16% |
| Nitrous Oxide | 6% |
| Flourinated Gasses | 2% |
Credit: 2010 EPA Global Greenhouse Gas Emissions Data [1]. Based on IPCC (2014) [2]. Details about the sources included in these estimates can be found in the Contribution of Working Group III to the Fifth Assessment Report of the Intergovernmental Panel on Climate Change [2].
To see just how much the energy sector contributes to these emissions, please see below.
Note: The pie chart below is interactive. You can click on sectors of the chart to see the proportions within a sector or category.
Figure 1.5: Global Greenhouse Gas Emissions by Sector (%)
Click for a text description of Global Greenhouse Gas Emissions by Sector
| Sector | Category | Industry Sub-sector | Emissions % |
|---|---|---|---|
| Energy (73.2%) |
Used in Industry (24.2%) |
Other | 10.6 |
| Iron and Steel | 7.2 | ||
| Chemical and Petrochemical | 3.6 | ||
| Food and Tobacco | 1.0 | ||
| Non Ferrous | 0.7 | ||
| Paper Pulp | 0.6 | ||
| Machinery | 0.5 | ||
| Used in Buildings (17.5%) |
Residential | 10.9 | |
| Commercial | 6.6 | ||
| Transportation (16.2%) |
Road | 11.9 | |
| Aviation | 1.9 | ||
| Shipping | 1.7 | ||
| Rail | 0.4 | ||
| Pipeline | 0.3 | ||
| Unallocated Fuel Combustion | 7.8 | ||
| Fugitive Emissions | 5.8 | ||
| Agriculture & Fishing | 1.7 | ||
| Agriculture (18.4%) |
Livestock and Manure | 5.8 | |
| Agricultural Soils | 4.1 | ||
| Crop Burning | 3.5 | ||
| Deforestation | 2.2 | ||
| Cropland | 1.4 | ||
| Rice Cultivation | 1.3 | ||
| Grassland | 0.1 | ||
| Industry (5.2%) |
Cement | 3.0 | |
| Chemicals | 2.2 | ||
| Waste (3.2%) |
Landfills | 1.9 | |
| Wastewater | 1.3 |
Credit: OurWorldinData.org [3], Climate Watch, The World Resources Institute (2020), Licensed under CC-BY(2.0) [4]
Hopefully, it becomes apparent that to address the threat of global warming, addressing the greenhouse gas intensity of the energy sector is paramount. In order to address this intensity, we must understand how the markets for energy work. This understanding helps us to make better decisions as we are confronted with choices to make in our professions.