
3.2. Environmental Metrics
Environmental metrics are designed to assess the environmental impact of technology or activity. Such impacts are primarily related to using natural resources (lifecycle INPUTS) and generating waste and emissions (lifecycle OUTPUTS). The ultimate sustainability goal is to minimize the environmental impacts due to using non-renewable resources and minimizing waste and pollution. Since the complete elimination of these impacts is hardly possible (any technology has its environmental costs!), it is also important to evaluate the rate at which environment can absorb the impacts and become remediated.
There are a number of common metrics designed to characterize the lifecycle inputs and outputs. Some examples are given below:
|
Metric |
Units* |
What it measures |
|---|---|---|
| Water use | m3 |
Amount of water consumed in the process of extraction, processing, manufacturing, maintenance and use of the product |
| Land use | acre |
Land area required (not available for other needs) for extraction, processing, manufacturing, use, and disposal of the product |
| Embodied energy | J |
Sum of all energy inputs to produce the product. This metric may include both technological and natural transformations. |
| Total lifecycle energy | J |
Sum of all energy spent to produce the product, extract and process the initial materials, use the product, and dispose off the waste |
* The units in the metrics are typically normalized by unit mass, unit volume, or unit area of a material or product, depending on application. For example, for lifecycle energy, it is common to see the units such as J/kg, which indicate how many jules of energy were spent for manfacturing, use, and disposal of 1 kg of the material or product over its lifecycle.
| Metric | Units | What it measures |
|---|---|---|
| Global Warming Potential (GWP) | kgCO2-eq |
Contribution to global warming due to emissions of greenhouse gases to the atmosphere |
|
Ozone Depletion Potential (ODP) |
kgCFC11-eq |
Contribution to stratospheric ozone layer depletion |
|
Water/Soil Acidification Potential (AP) |
kgSO2-eq |
Contribution to acidification of soils and water due to the release of gases such as nitrogen oxides and sulfur oxides |
|
Smog / Tropospheric Ozone Creation Potential (SCP) |
kgNO2-eq |
Contribution to air pollution, creation of tropospheric ozone (smog) by releasing nitrogen oxides and particulates |
|
Eutrophication Potential (EP) |
kg N-eq |
Enrichment of the aquatic ecosystems with nutritional elements (nitrogen or phosphorus) |
|
Human Toxicity Potential (HTP) |
1,4-DCB-eq |
Impact on humans of toxic substances emitted to the environment (health / cancer /non-cancer impacts) |
It should be noted that input metrics primarily characterize the sources of impacts (not impacts themselves), while output metrics aim to quantify the consequences - how the extraction and manufacturing processes and technologies may affect natural ecosystems, human health, and environmental values at large.
Next we are going to take a closer look at some of the metrics and show how those can be estimated.
Emergy / Transformity
The concepts of emergy and transformity are introduced as universal measures in the environmental accounting theory. The basic approach in that theory is to use energy units for assessing inputs and outputs of various natural and industrial systems. All types of energy and real wealth products are related to the primordial source - solar energy - through transformity. It is stated that going through multiple transformations via both technological and natural converters, available energy acquires new quality, while the load on the environment due to those transformations increases.
For example, on a hot day, we use an air conditioner. The energy to power the air conditioner comes from the electricity grid. Prior to that, the electric energy is generated at a power plant via conversion of thermal energy of steam and kinetic energy of the turbine into electricity. The thermal energy is, in turn, produced by combustion of fossil fuels. Energy stored in the fossil fuels (which were originally biomass) was actually the solar energy transformed by plants to organic matter via photosynthesis. So, solar energy is indeed the original component of the final energy used by the air conditioner (Figure 3.1).
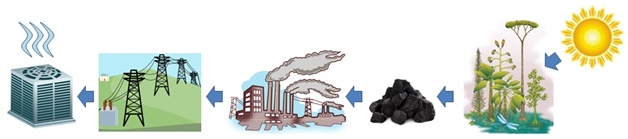
Transformations of the primary types of energy through an array of energy conversion processes and technologies described in the example above demonstrate the idea of transformity applied to a particular type of usable energy, such as electricity. In other words, transformity indicates how many transformations are necessary to obtain a particular sort of energy in a usable form and also show how “costly” those transformations are for the environment. Quantification of the energy inputs and outputs in terms of primary solar energy may be a tricky task; however, a number of studies provided such data and enabled energy flow analysis for environmental systems.
Check Your Understanding
Probing Question: Which of the following types of resources, in your opinion, has the lowest transformity based on the concept outlined above:
(A) Hydrogen
(B) Natural gas
(C) Wastewater
(D) Gasoline
(E) Ammonia fertilizer
Click for answer.
Emergy is defined as the available solar energy used up directly or indirectly to make a service, product, fuel, or another form of usable resource. This term essentially means the solar energy equivalent. Transformity, in this case, is the equivalence factor:
Emergy [seJ] = Energy stored or available [J] x Transformity [seJ/J]
Emergy is usually measured in solar energy joules [seJ], and transformity is therefore expressed as a ratio of solar energy Joules to regular Joules.
Example of transformity calculation
Here we use tree logs as an example for expressing transformity. The key energy transformation involved in the production of tree logs is photosynthesis, the natural processes that convert CO2 gas and solar radiation into biomass.
This calculation is done for 1 Ga of forest. Here, the Solar emergy flow essentially indicates how much solar energy is supplied by the sun onto that 1 Ga area. This would depend on solar insolation, which, in turn, depends on the geographic location of the forest, local weather profile, and other factors. The Energy flow, in this case, is the energy content of the wood produced by the 1 Ga forest per year. The result can be read as: 3846 joules of solar energy is used per each joule of energy stored in the logs. We understand that, in order to be accurate, transformity has to be evaluated taking into account the larger surroundings of the system and specific conditions. We also see from this example that only a part of the available solar energy is captured and converted to the usable stored energy (logs), while the rest of it is dissipated or redirected in this system.
Supplemental Reading:
Book: Odum, H.T., Environmental Accounting, John Wiley & Sons 1996. pp.1-15.
This book introduces the emergy theory and method for evaluation of environmental and economic use. Chapters 1 and 2, especially, would help you understand the basics of this approach. This is an optional reading, and the book is not provided in the electronic format. However, if you are interested in this topic and would like to use this approach in your own assessments, it is a proper resource to explore.
Embodied Energy
Embodied energy is another popular representation of the same concept. By definition: embodied energy is the sum of all the energy required to produce any material or product considered as if that energy was incorporated or 'embodied' in the product itself (Wikipedia, Embodied Energy).
The main difference between the embodied energy and emergy is that the former does not include the energy content in the raw resource (e.g. energy content in growing trees), but rather just accounts for the subsequent energy expenditures associated with the extraction, processing, and manufacturing stages.
Embodied energy is often expressed in the units of energy per making a unit mass [J/kg], unit volume [J/liter], or unit area [J/m2] of material depending how the its amount is accounted. Some data are given below for illustration.
| Material | Embodied Energy, MJ/kg |
|---|---|
| Concrete | 1.1 |
| Timber | 8.5 |
| Glass | 15 |
| Stainless steel | 55 |
| Plastic (PET) | 82 |
| Aluminum | 155 |
For more complex products consisting of multiple raw materials, the embodied energy increases significantly. For instance, for a common monocrystalline silicon solar PV panel, the embodied energy was estimated at ~4750 MJ/m2.
Global Warming Potential
Global Warming Potential (GWP) is a very common way to account for greenhouse gas emissions of a project. It can be used within the Lifecycle Assessment and outside of it as a criterion for choosing the most climate-friendly solution among the alternatives. GWP scale is also commonly used to compare different atmospheric gases and pollutants with respect to their ability to cause greenhouse effect. In that sense GWP is a relative metric - it is always related to carbon dioxide CO2 as the universal benchmark.
GWP of a gas depends on:
- Heat (IR radiation) absorption properties
- Spectral location of the absorbed wavelength (specific for Earth's radiation range)
- Atmospheric lifetime (longer = more impact)
- Time span of assessment (commonly 100 years)
For example, GWP of methane (CH4) = 25. That means that a ton of methane causes 25 as much warming in the atmosphere as a ton of CO2 due to greenhouse effect over a 100-years period.
Here is the list a few common atmospheric pollutants graded on the GWP scale.
| Gas | GWP factor | Atmospheric Lifetime |
|---|---|---|
| CO2 | 1 | 50-200 years |
| CH4 | 25 | 8-12 years |
| N2O | 298 | 120 years |
| CF4 | 7350 | 50,000 years |
| Hydrofluorocarbons | 1000-12,000 | 12-300 years |
| CF6 | 22,800 | 3200 years |
It is easy to notice the correlation between the longer lifetime and GWP. Some gases are not necessarily potent IR absorbers, but due to very long persistence in the atmosphere, the overall impact is compounded in the long term.
Let us see how these GWP factors for these chemicals can be used in project assessment.
Example
Assume greenhouse gas (GHG) emissions from an agricultural project are estimated as follows:
- Carbon dioxide: m(CO2) = 5 ton/year (gasoline and diesel-based machinery, irrigation pump, electric grid emissions)
- Methane: m(CH4) = 0.1 ton/year (organic decay, on-site waste management)
- Nitrous oxide (N2O) = 0.01 ton/year (transportation emissions)
All these emissions will contribute to the greenhouse effect and global warming, but not equally. Total contribution can be calculated based on GWP metrics:

As another example of using GWP, you can look at the LCA study by Stoessel et al., 2012, that assessed various crops with respect to a number of environmental metrics. Figure 2 of the paper makes an interesting illustration of environmental costs of production and sales of different types of agricultural produce.
Kaya Equation
Kaya Equation (introduced by the economist Yochi Kaya) is another example of environmental metric, which helps to estimate the total CO2 emissions of a country based on some common social and economic information, such as population, gross domestic product, energy intensity, and carbon intensity:
Where P = population, GDP = gross domestic product, (GDP/P) = GDP per capita, (E/GDP) = energy intensity per unit of GDP, and (CO2/E) = carbon intensity, i.e., emissions per unit energy consumed.
Obviously, the population is an important factor here since more people means more energy use, so it is included as the first term in this equation. GDP is commonly determined the market value of all officially recognized final goods and services produced within a country in a given period of time. GDP per capita is often considered an indicator of a country's economic well-being and standard of living. GDP per capita appears as the next term in the formula, since bigger economy means higher energy use. The next two terms - energy intensity and carbon intensity - are technology related. As we develop more efficient ways to convert energy or produce goods through technological innovation, we expect that it will take less energy to increase our GDP by another dollar. As efficiency grows, the E/GDP term should go down. Finally, the carbon intensity is primarily affected by the ways we generate energy. As we develop and gradually switch to renewable energy sources and minimize the use of fossil fuels, we should see CO2/E factor to decrease. As a result, less carbon dioxide will be emitted per kW of power produced.
The last metric in the Kaya equation is also useful to understand the real "carbon cost" of the energy converting technologies. The more fossil fuel burning is involved in the production of consumable energy (energy conversion), the higher the “carbon cost” of each bit of that energy. Renewable energy technologies, such as solar, wind, and others are characterized by lower (CO2/E), or even approach zero carbon in an ideal case. However, from the systems perspective, zero emission is not always achievable, since manufacturing, maintenance, and support system operation of such energy conversion systems may still require a certain amount of energy from fossil fuels.
Consider this example: A “green bus” uses a hydrogen fuel cell stack as an engine and emits only water from H2 + 0.5O2(air) = H2O reaction. Its operation is totally carbon-free, as we see no C letter in that reaction. However, manufacturing of such a bus requires equipment operated from the grid, which distributes electricity from a local fossil fuel power plant. Furthermore, maintenance of this bus over its lifetime may require other non-renewable resources. Therefore, its carbon “footprint” may be quite low, but still non-zero (at least until the moment we entirely decarbonize the grid).
The Kaya model allows estimating how changing technological solutions for energy conversion can help the economy in terms of emission reduction. Determination of the CO2/E factor provides a quantitative scale for measuring environmental impact in terms of “carbon cost”. The CO2/E metric is common in many assessment studies discussing alternative energy sources. We need to keep in mind that reported values usually reflect the lifecycle, "cradle to grave" emissions, i.e.,those related to raw material extraction, manufacturing, delivery, operation, maintenance, and decommissioning altogether (not just operational emissions).
Data Reading Exercise:
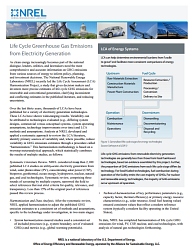
Take a look at this example of a National Renewable Energy Laboratory (NREL) study that had a goal to compare the lifecycle greenhouse gas emissions of various energy technologies. The study took into account the total estimated emissions from more than 2100 LCA publications and related those to the total amount of energy generated by those systems during their lifetime operation. The carbon intensity results are summarized on the bar graph (p.2 of the fact sheet). Interpreting the graph, answer the following questions for yourself and write answers in your notes:
- What units are used to express the CO2/E metric?
- Energy from which technology (out of those studied) has the highest "carbon cost"? Which one has the lowest "carbon cost"?
- Which stage of the technology lifecycle does result in the most CO2 emissions: in case of renewable energy systems and in case of fossil fuel energy systems?
In summary, a review of the Kaya equation indicates that the development of technologies can lower the global and country's carbon emissions in two ways: (1) increasing conversion efficiency and (2) decreasing carbon content in the lifecycle.
Try this: Estimate Your Ecological footprint
Various internet sites use combinations of environmental metrics to calculate the so-called ecological footprint. This is an illustration of how environmental metrics can be used to compare human lifestyles, which essentially comes down to the comparison of technologies people use. These calculators are far from being specific and use generalized information on environmental impacts. Here are a couple of calculators you can check just for fun:
- Easy to take quiz to calculate your ecological footprint
- Household Carbon Footprint Calculator
- Calculator of the ecological impact of foods
Do you get similar results from different calculators?