
3.3. Economic Metrics
When a systems approach is used for technology evaluation, the financial dimension of the system life cycle cannot be omitted. While it is not the purpose of this course to teach the entire theory of economic assessment, reviewing some fundamentals and practical tools for economic evaluation should be useful here.
The purpose of economic metrics is to provide the quantitative information needed to make a judgment or a decision on deployment of a new technology or to select alternative options. The most complete analysis of an investment in a technology or a project requires the analysis of each year of the life of the investment, taking into account relevant direct costs, indirect and overhead costs, taxes, and returns on investment, plus any externalities, such as environmental impacts that are relevant to the decision to be made.
The main questions to answer are:
- Is the technology / process cost-effective?
- Is deployment of the particular technology project financially viable?
- What would be the cost of the technology products and services to the public?
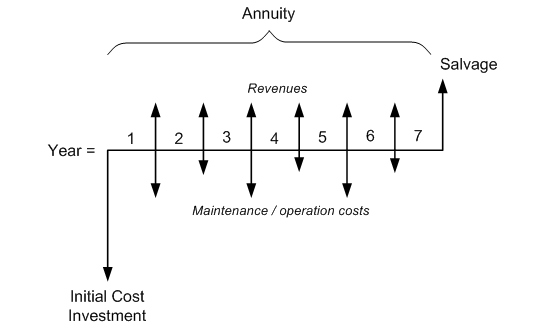
Cash Flow Analysis
Cash flow is a tool used to show how the project expenses and revenues vary over the term of the project - it is a financial timeline. For the basic cash flow, the following terms need to be defined:
- Term of the project – for how many years the process, technology, or facility will be deployed.
- Initial cost (capital investment) – one-time expense at the beginning (e.g., purchase of major assets - land, equipment, buildings, labor).
- Annuity – annual increment of cash related to the operation of the technology:
- positive, if it brings revenue;
- negative, if it brings expense;
- Note that net (expenditure vs. revenue) balance should be positive in order to repay the investment cost.
- Salvage value – one-time positive cash flow at the end of the planning period (if everything is sold in its actual condition). Usually, salvage value is low compared to initial cost.
General cash flow scheme can be visualized as follows (Figure 3.3):
Modeling the cash flow helps assess the financial viability of a project and answer some of the important questions before the decision is made to start the project.
In this section, we are going to consider two basic approaches to cash flow analysis for a project: (1) Simple Payback approach and (2) Discounted Cash Flow analysis.
The first method is attractive for its simplicity and can be used as a quick-check calculation before any further, more sophisticated analysis is performed. It is best suited to short-term projects, in which the money value is not significantly impacted by inflation. The second method is preferred for long-term projects, when the money value is expected to significantly change over time or if interest is applied to investment over an extended period of time.
Referenced below are two reading sources that provide background on the economic evaluation, which will introduce several key economic metrics. The first source is more important, and its content is linked to one of the homework assignments given in this Lesson. Additional explanations and examples to the concepts discussed in the Vanek and Albright's book are provided further in this section.
Reading Assignment:
Book chapter: F.M. Vanek and L.D. Albright, Energy Systems Engineering. Evaluation and Implementation, McGraw Hill, 2008 - Chapter 3 Economic Tools for Energy Systems, pp. 62-75. (Available via E-Reserves in Canvas.)
This reading provides an introduction and examples on the economic evaluation of technologies. Please learn the basic approaches of cost analysis and take notes on terminology. Some of the concepts introduced in this chapter are further explained below.
Simple payback approach
This approach is suitable for short-term projects with quick return on investment. In this case, discounting (for money value declining over time) may be unnecessary.
In simple payback evaluation, all cash flows into and out of the project are added up to find Net Present Value (NPV) metric. That includes initial cost, annuities, and salvage value.
NPV = – Initial Cost + S(Annuities) + Salvage Value
If NPV is positive, the project is considered financially viable.
Example
Consider a hypothetical technology project with the initial cost of $100,000, net positive annuity of $20,000 for 10 years, and a salvage value in the end of that term of $5,000. Then, its net present value can be calculated as:
NPV = -$100,000 + (10 years x $20,000) + $5,000 = $105,000
The positive NPV value indicates that the project is financially viable.
The break-even point, i.e., the year when the sum of annuities surpasses the initial cost and the initial expenditures have been paid back, is characterized by the Simple Payback Period (SPB):
SPB (years) = Initial Cost / Net annuity
SPB indicates the number of years after which the initial expenditures are paid back.
For the case described above:
SPB = $100,000 / $20,000 = 5 years
Capital Recovery Factor (CRF) evaluates the relationship between the cash flow and investment cost. This evaluation is applicable to short-term investments (within N=10 years).
CRF = ACC / NPV
where ACC = Annual Capital Cost
ACC = Annuity – NPV/N
Here, the NPV/N term is the average share of the net present value per each year of the project. So, ACC is the part of the annuity that goes each year to cover the investment; it does not go towards profit.
For the project example described above, we can calculate:
ACC = $20,000 – $105,000/10 = 9,500
CRF = $9,500/$105,000 = 0.09 (9%)
CRF factor then should not be too high for a project to be considered financially viable.
By recommendation of the Electric Power Research Institute (EPRI), CRF value should not exceed 12%.
Discounted Cash Flow Analysis
This approach is better applied to long-term projects with slow payback. Money value declines over time, so it must be taken into account.
For example, many renewable energy projects generate low positive annuity at the beginning, while having high initial costs, so it takes more years to pay back investments. In this case, the discounted evaluation should be used.
In the case of discounted cash flow, we need to evaluate how much any cash flow element would value in the future. That would depend on the interest rate (i) imposed on initial investment and the number of years (N) the project is underway. The following conversion factors are used:
Then the NPV can be calculated using the following equation:
NPV = – Initial Cost + (P/A) × Annuity + (P/F) × Salvage Value
Example
For the example used in the simple payback approach section above, if the interest rate on the initial investment is set at 5%, the conversion factors for 10-year project can be calculated as:
(P/F, 5%, 10) = 0.614
and
(P/A, 5%, 10) = 7.722
and the discounted NPV future value can be found as:
NPVfuture = – Initial cost + (P/A) × Annuity + (P/F) × Salvage value =
= -$100,000 + 7.722 × $20,000 + 0.614 × $5,000 = $57,510
So, even with depreciation taken into account, the NPV of this project is still positive, indicating its economic viability.
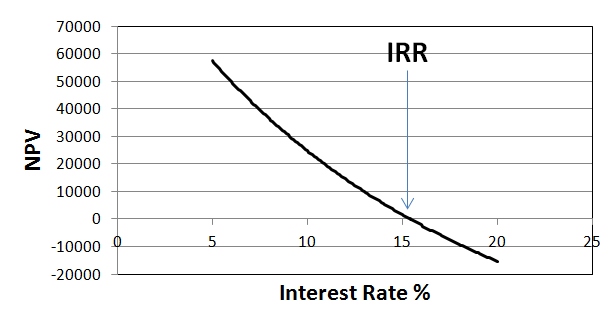
Another useful metric associated with the discounted cash flow analysis is Internal Rate of Return (IRR), which corresponds to the marginal interest rate that would allow the project to break even in the end of the term.
Setting the investment interest rate above IRR would render the project not viable.
By calculating NPV future value for the end of the project term at different interest rates, one can find the rate at which NPV is equal to zero. The rate corresponding to that condition is IRR (Figure 3.4).
Another illustration of the comparison of the simple payback and discounted cash flow methods is given by the Example on p.67 of the book [Vanek and Albright, 2008].
Listed below are some other economic measures that can be used in different analyses as metrics to evaluate technological systems:
- TLCC = Total life cycle cost
- LCOE = Levelized cost of energy
- RR = Revenue requirements
- B/C = Benefit to cost ratio
- SIR = Savings to investment ratio
You can refer to supplemental reading source [Short et al., 1995] mentioned above for more details on how these metrics are useful and how they can be estimated.
Check your understanding:
Using the simple payback approach, estimate the net present value of a proposed technology project with the initial capital investment of $5 million, projected net annuity $500,000 per year for 8 years, and salvage value of $100,000. Is the project financially viable?
Click for answer.
NPV = -5,000,000 + 8 x 500,000 + 100,000 = -$900,000. This project is not financially viable based on simple payback evaluation, since its NPV is negative.
Supplemental Reading:
NREL Report: Short, W., Packey, D.J., and Holt, T., A Manual for the Economic Evaluation of Energy Efficiency and Renewable Energy Technologies, National Renewable Energy Laboratory, Golden, CO, 1995.
This report provides detailed guidelines on economic metrics and methods for technology evaluation.