Module 1: Core Concepts
Lesson 1: Energy and Sustainability
Overview
This lesson provides an introduction to the course, and covers basic considerations for energy and sustainability. Given that one of the primary goals of this course is for you to be able to critically analyze claims made in contemporary materials, it is important that you have some baseline knowledge about energy and sustainability. Some of this may be review, but even if it is, it is to your benefit to go through all of the material to make sure you understand all of the concepts. If this is new to you and you find anything confusing, please don't hesitate to ask me, preferably by posting to the HAVE A QUESTION Discussion Forum.
Lesson Objectives
By the end of this lesson, you should be able to:
- define energy, energy efficiency, and the First Law of Thermodynamics;
- identify and describe types of energy and energy conversions;
- identify and define fossil fuels, non-renewable energy sources, and renewable energy sources, and their origins and characteristics;
- analyze the energy data provided in charts and graphs;
- identify reliable sources of energy data;
- evaluate the implications of sustainability definitions;
- define the "3 E's" of sustainability and use the 3E framework to evaluate the sustainability of given actions.
What is due for this Lesson?
Please note that the quiz can only be taken once. You have unlimited time to complete it prior to the deadline and can save your progress and pick up where you left off at a later time. See the Assignments and Grading section of the syllabus [1] for tips on how to do this. Once you submit the quiz, you cannot change answers. All saved answers will automatically be submitted at the deadline if you have not submitted them.
| Requirement | Submission Location |
|---|---|
| Lesson 1 quiz | Modules tab > Lesson 1 |
| Start posting to the Yellowdig discussion board | Modules tab > Lesson 1 |
| OPTIONAL Extra Credit: Lesson 1 Extra Credit quiz | Modules tab > Lesson 1 |
Questions?
If you have any general course questions, please post them to our HAVE A QUESTION discussion forum located under the Discussions tab. I will check that discussion forum regularly to respond as appropriate. While you are there, feel free to post your own responses and comments if you are able to help out a classmate. If you have a question but would like to remain anonymous to the other students, email me.
If you have something related to the material that you'd like to share, feel free to post to the Coffee Shop forum, also under the Discussions tab.
Introduction to Yellowdig
As noted in the Orientation, you will be using a discussion board application called Yellowdig. [2]For a review of these activities, see the syllabus [1]. You should start posting to the discussion board this week!
Description of how Yellowdig will be used in EM SC 240N
-
You will be making posts throughout the entire semester. I will periodically post prompts that you must follow, but you can make other comments, as long as they are relevant to the course content. The prompts will focus on the content for that week or lesson. This ongoing assignment (which is worth 25% of your grade!) serves a few purposes: First, thinking and writing about the content helps you internalize it better than reading about it. Second, it helps you learn to communicate these important sustainability issues to others. Third, it gives you an opportunity to have authentic interactions with fellow students.
-
Some of your posts will be graded using a specific rubric, but most of them are auto-graded by Yellowdig.
- Yellowdig is a points-based discussion board app. The app automatically assigns points for length, frequency, commenting on other posts, others commenting on your post, and a few other things. As you accomplish these things, your points go up. The app automatically divides the assignment into "periods," each about a week long. You can always view how many points you have out of your target points that period.
- There is no set amount of posts per se, but more substantive posts, more substantive responses to others' posts, and more frequency of posts all earn you more points. You also get points for others commenting on your post, so make it interesting!
- Please note that Yellowdig keeps a running total of points out of your target points for that period. If you are running low on points, you can bring your score up until the last commenting period is over. The end of the last commenting period is the last day of the semester.
- Each time you make a post you need to add at least one topic. (It forces you to do this, so I won't explain how to add them.) I have pre-loaded topics, all of which match up with the Lesson content.
- At the end of the semester, your score will be your grade. For example, if you get 9,000 out of 12,000 points, that is a 75%. Thus, you would get 75% of the 25% on your Canvas course grade (0.75 x 25% = 18.75%).
I hope you find this engaging, and who knows, maybe even fun! It's a great way to interact with your fellow students.
Please go to the Yellowdig discussion board link in the Lesson 1 Canvas module to read more details about how Yellowdig works.
All interactions on this discussion board and any other personal course interaction must follow the ESP Peer-to-Peer Participation Policy, which can be accessed Course Website [3]. I will be monitoring the board to make sure you adhere to these.
What is Energy?
Learning Objectives Self-Check
Read through the following statements/questions. You should be able to answer all of these after reading through the content on this page. After going through the content, check the boxes next to the questions/statements that you feel at least somewhat confident answering. I suggest writing or typing out your answers, but if nothing else, say them out loud to yourself. This is to help you reflect on important content and will help you prepare for this week's quiz. It will also help lay the foundation for future course content.
Considering that this course is called “Energy and Sustainability in Contemporary Culture,” let’s start by answering two fundamental questions:
- What is energy?
- What is sustainability?
Energy
Let’s tackle the second question first, since the answer is a little more straightforward, even if it’s not always easy to grasp: What, exactly, is energy?
To Read Now
The National Energy Education Development (NEED) Project [4] is a non-profit organization that provides a lot of useful (and free!) information about energy and energy issues. Please read the first two pages of their Introduction to Energy [5], which provides a good overview of energy. Hopefully, much of this will be a review for you! (Note that we will go over more up-to-date energy use data than the document has - i.e., more recent than 2009 - below.). You are welcome to read the rest, but it is not necessary. (It is helpful, though.)
- Introduction to Energy [5], National Energy Education Development Project (pp. 8 - 9)
Energy is most commonly defined as "the ability to do work." This is a useful technical definition, but from a practical perspective, the NEED Project's indication that energy is also "the ability to produce change" is helpful. A similar way to think of energy is that it "makes things happen." Energy is required to make a TV turn on, a car to move, the sun to generate light and heat, water to vaporize, plants to add biomass, a power plant to generate electricity, and for you to think about this course content as you read it. And even if these things are not actually happening, energy provides the ability to make them happen.
As indicated in the reading, the two categories of energy are potential (stored energy) and kinetic (energy in motion), each of which have several forms. (Note that the categories are listed in parentheses below because they can either be included or not, e.g., chemical energy can be referred to as "chemical" or "chemical potential" energy. Generally, "kinetic" or "potential" is not included.):
- Chemical (potential) energy is stored in the bonds between atoms and molecules. Common examples include the energy stored in food, fossil fuels, and batteries, but anything that is made of more than one atom has chemical energy. Practically speaking, basically everything made of matter has chemical energy.
- Mechanical (potential) energy is "stored in objects by the application of a force." Common examples include a wound spring, a stretched-out rubber band, and compressed air.
- Nuclear (potential) energy is "stored in the nucleus of atoms," and is what holds the nucleus together. Anything made of matter has nuclear energy, but most of the nuclear energy converted by humans comes from the fission (splitting) of uranium atoms and is used to generate electricity. Most of the energy used by humans, however, comes from nuclear fusion (fusing of atoms) in the sun.
- Gravitational (potential) energy is "energy of position or place." Common examples include water (e.g., in a river) at a high(er) elevation, a ball sitting on top of a hill, and you sitting on your chair right now. If you see naturally flowing water, it is moving down hill (tides and waves notwithstanding), so hydroelectric energy (electrical energy generated from flowing water) starts out as gravitational potential energy.
- Electrical (kinetic) energy is "the movement of electrons." The most common example of this is electricity moving through a wire, but discharging static electricity and lightning are also electrical energy.
- Radiant (kinetic) energy is also called "electromagnetic energy." It travels in transverse waves and is produced by anything with a temperature above absolute zero. Common examples include light, sunlight, microwaves, radio waves, and radiant heat emanating in all directions from a fire.
- Thermal (kinetic) energy is the vibration of the molecules of a substance. As an object or substance gets heated up, the molecules vibrate more rapidly, and they slow down as it cools down. Humans cannot see this vibration because it happens at a molecular level, but we can feel it, or at least the results of it. Have you ever accidentally touched a hot stove and gotten burned? That unpleasant sensation is the result of the quickly vibrating molecules of the stove imparting their thermal energy into your skin. Anything above absolute zero has thermal energy, so it is all around us all the time, including everything you see right now.
- Motion (kinetic) energy is the energy in moving objects. Anything with mass that is moving has motion energy. Moving cars, flowing water, a falling object, and even wind (air is made of matter, after all!) are common examples.
- Sound (kinetic) energy moves in waves and is produced by vibrating objects. When you hear something, it is the result of the bones in your ear absorbing and converting these waves into motion energy, which your brain then interprets as sound. Despite what you may have heard, if a tree falls in the woods and there is no one there to hear it, it does generate a sound! Well, it generates sound energy, at least.
Energy efficiency and conservation of energy will be addressed later in this lesson.
The gentleman in this video (4:35 long) also provides useful information regarding energy and illustrates many of the concepts from the reading above. (In case you are wondering, yes, he is this excited all the time. He also has a number of really good videos regarding many topics. His YouTube channel [6] has over 6,000,000 subscribers, so he must be doing something right!). Please note that you can open this video in YouTube by clicking on the title of the video in the window below.
As you probably know by now, we’ve been working with Google and YouTube to answer ten of the most popular science questions asked on the Internet. And I gotta hand it to you, because there are few questions that are as confounding and complex and fascinating and inspiring, as this one the collective consciousness has spewed forth:
What is energy?
I'm Hank Green, and this is the World’s Most Asked Questions.
[Intro]
Energy is everything. It’s everywhere. It’s one of the true constants of the universe because as long as there’s been a universe, there’s been energy. And while it comes in lots of different forms that can seem different to us, they all amount to the same thing: Energy is the ability to do work. And work is just the act of displacing something by applying force.
So, say you stomp on a stomp rocket. The force of your foot hitting the pedal is turned into the force of air leaving the cannon -- sending your rocket sailing. Or maybe you're enjoying a nice patty melt -- the energy from that food is broken down for all of the quadrillions of cells that you have to do all of the things that they have to do -- make copies of your DNA, assemble and repair proteins, transport materials from one place to another, make muscle cells contract -- you know, all the stuff of being alive. That rocket sailing, your cells toiling away, your phone or computer being on right now to watch me -- that’s all work being done. And the ability to do these things is inherent in everything around you. Even things that look inert, completely lacking in energy. Like this log.
This log, for example, is chock full of chemical energy because it’s made up of combinations of carbon and hydrogen and oxygen formed into lignin, which is the stuff that makes up wood. All of the bonds between all of those atoms, in every molecule of lignin, contain energy. How do I know? Because if I were to apply enough extra energy, like as heat, to break those bonds -- it would release that chemical energy as fire. That chemical energy is also the kind of energy you get from your patty melt -- your body is fueled by the chemical bond energy in sugars, fats, and proteins. But this log also contains nuclear energy! Each atom in this wood has a nucleus, made of protons and neutrons, and the energy that binds them together is one of the most powerful sources of energy in the universe. If you could split one of the atoms of carbon or hydrogen in this log, and rip those protons and neutrons apart, it’d release some of that energy. There’s so much nuclear energy in each atom that, if I could unleash all of it that's in this log? There’d be a giant smoldering crater where I’m standing and everyone in the town of Missoula, Montana, would be dead.
So, everything that’s made of atoms has nuclear energy locked up in it, but also, it turns out, that mass and energy are the same thing! You might have heard of this little equation that a German patent clerk came up with about a hundred years ago: E = mc2. And there are SO MANY OTHER KINDS of energy that I’d love to get into if we had the time ... but even though they may seem different, they can all be used to do work, whether it’s driving a turbine, or moving an engine piston or allowing the screen on your tablet to glow. Or, if it’s that most mysterious of energies, dark energy, causing the universe to expand more than it seems like it should. But here’s the thing to remember.
Once the work is done, the energy isn’t done. Because energy never goes away. It can never be destroyed, and in the same way, it can never be created. It can only be transferred from one source to another -- like, how the energy in the plants and animals that were in the patty melt were transferred into you -- or it can be transferred from one form into another -- like the chemical energy in the wood being transferred to light and heat as fire. You could think of the universe as a constant flow of energy, and we are just little pit stops along the way. Everything your body is doing right now -- whether it’s your lungs absorbing oxygen, your heart pumping blood, your brain cells firing as you watch me and learn things -- all those things are using recycled energy that’s been around since the origin of the universe. And by simply being alive, you’re releasing that energy back into the environment around you, to be used by other things in other ways.
So Internet, to answer your question: Energy is everything. And for those of you who answered our questions on our SciShow survey, where you feel like you get your energy may be keeping you up at night. Survey takers who have a hard time falling asleep nearly every night get their energy from knowledge first, second from purpose. Least likely? From exercise. Of all the fascinating questions in the world, what question do you want to see answered most? Let us know on Facebook or Twitter or down in the comments below and we will aim to answer those questions in a new video at the end of the month.
Okay, so if you ask a physicist or energy expert what energy is, she will likely tell you that energy is the ability to do work. This sounds straightforward enough, but you may be thinking, “what is work?” Ask the same (or another) expert, and you will likely hear: “Work is the transfer of energy.” The video below from Kahn Academy (3:16) is optional but does a good job of explaining what this means. If you are still a little confused after watching it, you may want to read through the rest of the energy lesson, then go back to it. The formulas are not important for this course, but the concept of how work is related to energy is important. One thing to note: the narrator uses the term "Joule" a lot in this video. A Joule (J) is the international unit of energy and is simply a way to quantify energy. (More on quantifying energy shortly!)
Optional Viewing
Work as the transfer of energy from the Khan Academy (3:17 minutes)
One way to find the amount of work done is by using the formula Fd cosine theta. But this number for the amount of work done represents the amount of energy transferred to an object. For instance, if you solve for the work done and you get positive 200 joules, it means that the force gave something 200 joules of energy. So, if you have a way of determining the amount of energy that something gains or loses, then you have an alternate way of finding the work done, since the work done on an object is the amount of energy it gains or loses.
For instance, imagine a 50-kilogram skateboarder that starts at rest. If a force starts the skateboarder moving at 10 meters per second, that force did work on the skateboarder since it gave the skateboarder energy. The amount of kinetic energy gained by the skateboarder is 2,500 joules. That means that the work done by the force on the skateboarder was positive 2,500 joules. It's positive because the force on the skateboarder gave the skateboarder 2,500 joules. If a force gives energy to an object, then the force is doing positive work on that object. And if a force takes away energy from an object, the force is doing negative work on that object.
Now imagine that the skateboarder, who's moving with 10 meters per second, gets stopped because he crashes into a stack of bricks. The stack of bricks does negative work on the skateboarder because it takes away energy from the skateboarder. To find the work done by the stack of bricks, we just need to figure out how much energy it took away from the skateboarder. Since the skateboarder started with 2,500 joules of kinetic energy and ends with zero joules of kinetic energy, it means that the work done by the bricks on the skateboarder was negative 2,500 joules. It's negative because the bricks took away energy from the skateboarder.
Let's say we instead lift the bricks, which are 500 kilograms, upwards a distance of four meters. To find the work that we've done on the bricks, we could use Fd cosine theta. But we don't have to. We could just figure out the amount of energy that we've given to the bricks. The bricks gain energy here. And they're gaining gravitational potential energy, which is given by the formula mgh. If we solve, we get that the bricks gained 19,600 joules of gravitational potential energy. That means that the work we did on the bricks was positive 19,600 joules. It's positive because our force gave the bricks energy.
This idea doesn't just work with gravitational potential energy and kinetic energy. It works for every kind of energy. You can always find the work done by a force on an object if you could determine the energy that that force gives or takes away from that object.
[MUSIC PLAYING]
In order for an object to gain or lose energy, work must happen. If you pick up a book from the ground and put it on a table, the book gained gravitational (potential) energy. You performed work on the book, and the amount of work is equal to the amount of potential energy gained. When you pull your car or bike out from a parking spot, the car/bike has motion energy, but when it was parked had none. That energy gain is the result of work done by the car engine (then drivetrain and wheels) or your legs (then pedals, chain, and wheels), and you can figure out the work done by considering the velocity and mass of the moving object. When the vehicle stops, the bike/car performs work on the road and tires, resulting in them heating up.
The sun is constantly generating massive amounts of radiant energy. That energy is provided by hydrogen atoms fusing together into helium and releasing nuclear energy. The amount of radiant energy generated in this process is equal to the amount of work done by the hydrogen atoms on the sun. When this sunlight hits your skin (or any object), it performs work on it, resulting in a gain in thermal energy. This gain in thermal energy is equal to the amount of work done.
I could go on and on, but the key thing to remember is that energy transfer requires work. Any time energy is transferred from place to place or from one form to another, work must be done, and the amount of work is equal to the amount of energy gained or lost.
Optional (But Strongly Suggested)
Now that you have completed the content, I suggest going through the Learning Objectives Self-Check list at the top of the page.
Thermodynamics and Energy Transfer
Learning Objectives Self-Check Edit (active tab)
Read through the following statements/questions. You should be able to answer all of these after reading through the content on this page. After going through the content, check the boxes next to the questions/statements that you feel at least somewhat confident answering. I suggest writing or typing out your answers, but if nothing else, say them out loud to yourself. This is to help you reflect on important content, and will help you prepare for this week's quiz. It will also help lay the foundation for future course content.
Forms of Energy
It can be easy to get bogged down by the formulas used to calculate how much work is done, when, by whom, and to whom. Since this is not a physics class, let’s not dwell on those. As described on the previous page, a somewhat simplified, but very useful way to think of energy is that “energy makes things happen.”
Try This
Take a few minutes to look around you. Based on what you know about energy and what you learned in the reading and videos, what is energy “doing” where you are right now? (Seriously, take a look.)
We could go on and on. But as you probably know, these are all examples of kinetic energy, or “energy of motion.” As stated in the reading and video, there are also a number of types of potential energy. Think of some examples of potential energy around (and in) you right now. You are able to move and think because of chemical (potential) energy inside of your body. In fact, everything around you has chemical potential energy. Any object on the wall, on a table, attached to the ceiling, or just above the ground has gravitational (potential) energy because it is above the ground. There is also nuclear (potential) energy in all matter because all matter has at least one nucleus. Again, we could go on and on, but the point is that everything around you has potential energy - nuclear if nothing else - and thus has the ability to do work, i.e., “to make things happen.”
Conservation of Energy
One of the foundational concepts in the understanding of energy – and something that is very important in the context of this course – is the First Law of Thermodynamics. The simplest way to put the First Law of Thermodynamics is that “energy cannot be created or destroyed – it can only change forms.” This is often referred to as the “Law of Conservation of Energy,” for obvious reasons. Practically speaking, this means that all energy came from somewhere else, and that it does not disappear when it is “used.”
All of the examples of energy that were noted above came from somewhere else. The light coming from a light bulb is converted from electrical energy running through a wire. The heat radiating from non-living things around you was absorbed from another source such as sunlight or the heating system of the building. The motion and electrical energy your body has right now comes from the chemical energy inside of your body. The gravitational energy of things around you came from motion energy required to lift the objects. And so on. And recall that each time energy was transferred, work was done.
Good to Know
NASA defines thermodynamics [11] as "the study of the effects of work, heat, and energy on a system." Thermodynamic principles are relevant to many applications, including things as diverse as nanotechnology, health sciences, refrigeration, climatology, manufacturing, space travel, and much, much more. If you are interested, here are some thermodynamic resources: Kahn [12]Academy [12] and Hyperphysics [13] (from Georgia State University) [13].
Of course, this also means that all of the previous forms of energy also came from somewhere else. Where do you think the electricity used to generate the light coming from the screen came from? It almost certainly came from a power plant somewhere. But where does the power plant get its energy from? If you live in the U.S., chances are it came from either coal, natural gas, or nuclear material (about an 80% chance nationally [14], but it depends on where you live).
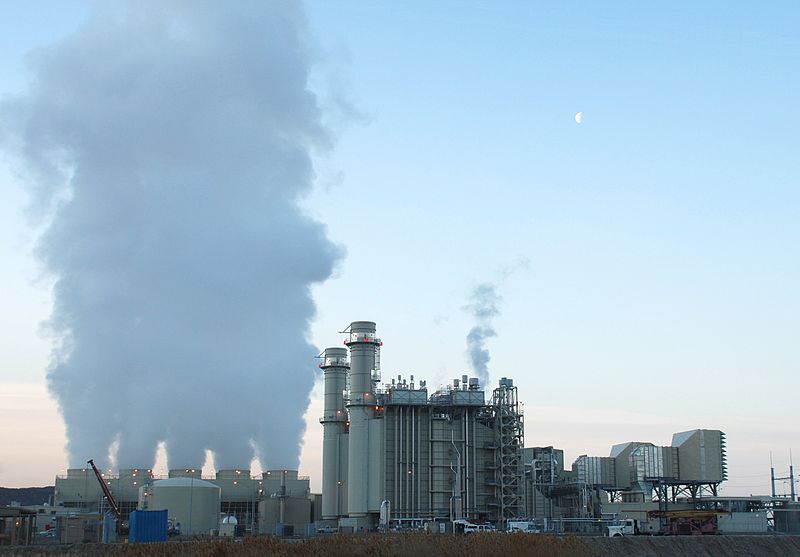
Let’s assume the electricity in question is from a natural gas-fired power plant. If so, the electricity used to generate the light on the screen you are looking at right now was originally chemical (potential) energy stored in the molecules of natural gas. Note that before it was converted to electricity, it went through a number of conversions, including being burned (thermal and radiant energy), and spinning a turbine (motion energy). But let’s not stop there. Where did the natural gas get its energy? Before we answer this, please read the short readings below.
To Read Now
Knowing where to get reliable information is an important skill to have. If you want U.S. energy data, there is no better source than the U.S. Energy Information Administration [15] (US EIA, or simply EIA). The US EIA is an outstanding source of information, from specific energy use data to general energy information. For the energy geeks among us <raising hand>, there is so much interesting (and reliable) information that hours can be spent perusing, reading, and watching videos. Please read the following pages before moving on. You are, of course, welcome to explore the rest of the website, but at least read the links below:
- Introduction to natural gas [16] (read through the first 3 subheadings in the "Basics" tab and the "Did you know?" box.)
- Introduction to coal [17] (read through the "Basics" tab)
- Introduction to oil [18] (read through the "Basics" tab and browse the "Data and Statistics" tab). Also browse the imports and exports [19]page.
- Introduction to nuclear [20] (read through the "Basics" tab)
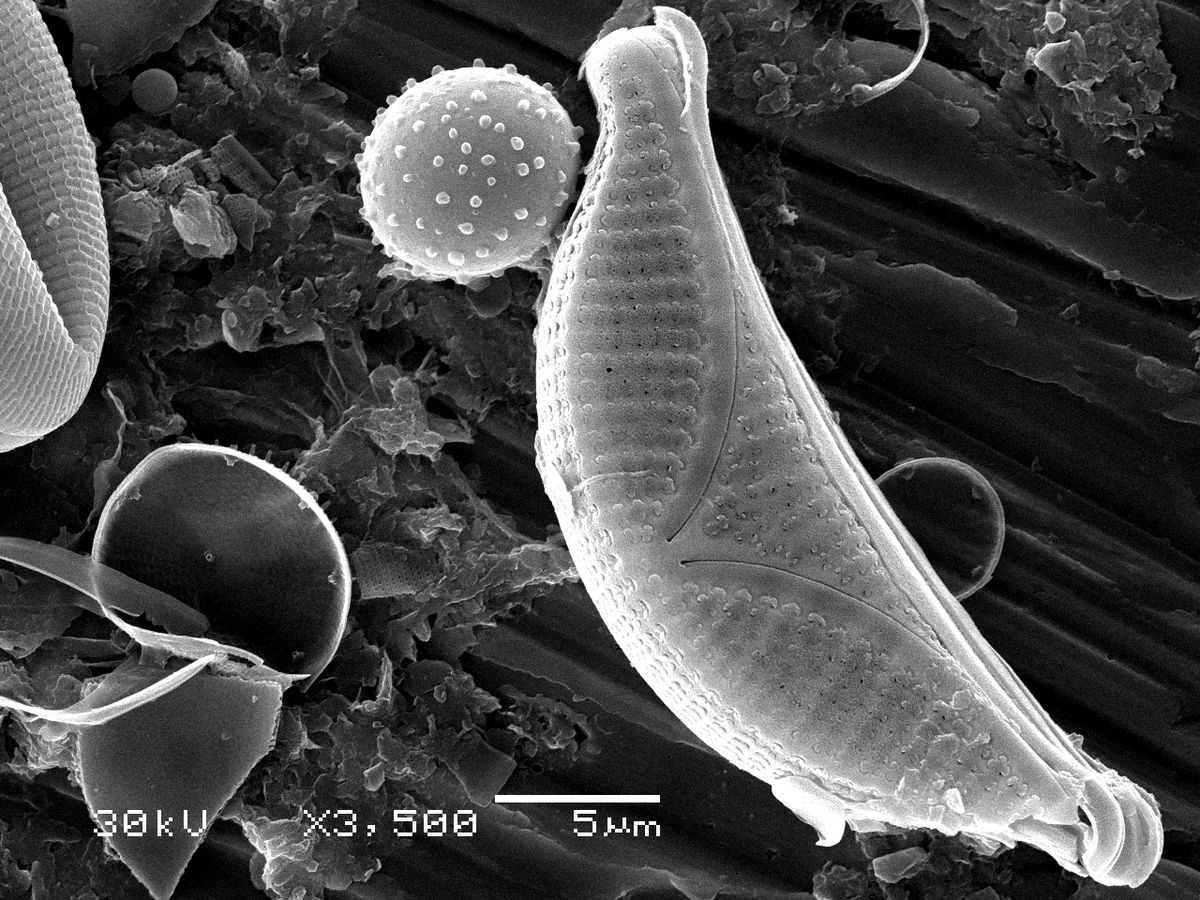
Natural gas is formed from the remains of living organisms over millions of years, as are coal and oil. Most of this is from photosynthetic organisms, such as plants and phytoplankton [21](e.g., diatoms [22]). If so, then the energy came from the sun. If it was an animal that formed the gas, then the energy came from what the animal ate to gain that energy, i.e., a plant or another animal. If it ate a plant, then that energy originally came from the sun, but what if it ate another animal? That animal either got its energy from a plant or another animal.
What this boils down to is that no matter how you slice it, all of the energy in natural gas came from the sun. The implications are kind of mind-boggling (and let’s face it, awesome): The light energy coming from the screen you are looking at right now probably started out as sunlight that hit the earth millions of years ago!
Fossil Fuels
Coal, oil and natural gas are considered fossil fuels because they are derived from remains of ancient organic material. They are also all hydrocarbons (technically, oil and natural gas are made of multiple hydrocarbons), which indicates that they are made primarily of carbon and hydrogen. You will often see coal, oil, and natural gas referred to by either name - fossil fuel or hydrocarbon.
Again, we could go through innumerable examples of energy, and most of them would require tracing multiple steps to find their original source. Almost all sources (aside from some nuclear energy and some geothermal energy) can be traced back to the sun, whether it’s recent or ancient sunlight. But more importantly in the context of this course is that:
- all energy comes from somewhere else, and
- energy is a quantity of “something” that takes many forms and can be converted from one form to another.
As the saying goes, “there ain’t no such thing as a free lunch.” In other words, when we “use” energy, that energy must come from somewhere else, and it does not disappear, it is converted to another form.
Good to Know
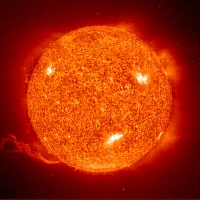
Almost all of the energy used on earth came from the sun, but where does the sun get its energy? Sunlight is nuclear energy released when atoms of hydrogen fuse to form helium, in a process called fusion. This reaction releases a HUGE amount of energy - the surface of the sun is nearly 6000 °C (more than 10,000 °F), and the core is more than 20 million degrees C [25] (36,000,000 °F)!
Optional (But Strongly Suggested)
Now that you have completed the content, I suggest going through the Learning Objectives Self-Check list at the top of the page.
Quantifying Energy
Learning Objectives Self-Check
Read through the following statements/questions. You should be able to answer all of these after reading through the content on this page. After going through the content, check the boxes next to the questions/statements that you feel at least somewhat confident answering. I suggest writing or typing out your answers, but if nothing else, say them out loud to yourself. This is to help you reflect on important content, and will help you prepare for this week's quiz. It will also help lay the foundation for future course content.
It should be clear by now that energy can take many different forms and is often converted from one form to another. Though different forms of energy cannot always be used the same way (ever tried to watch TV by plugging into a lump of coal?), you can always express the amount of energy present in different forms using the same units by using unit conversions. There are many energy units, but the most common unit you’ll see in the U.S. is the British Thermal Unit or Btu. Joules are considered the international unit of energy (you may see these from time to time in the U.S.), but since we like to make things difficult for scientists in the U.S. by using English units instead of metric, we’ll stick mostly to Btus in this course.
A Btu is defined as the amount of heat required to heat up one pound of pure water one degree Fahrenheit. To give you some perspective, a single match releases about one Btu if it is allowed to burn entirely.
The following are examples of commonly used energy equivalencies, i.e., unit conversions:
- One kilowatt-hour (kWh) of electrical energy is equivalent to exactly 3412 Btus of energy.
- Each time you burn a gallon of gasoline in a car, you convert approximately 120,000 Btus to other forms of energy (mostly as waste heat, it should be noted).
- Every 100 cubic feet (ccf) of natural gas that is burned releases approximately103,700 Btus of energy. (Note that 1 ccf = 100 cubic feet, so there are approximately1,037 Btus in 1 cubic foot, or cf).
- You know the calorie labels on the side of packaged food? Those are actually kilocalories, and each one is equivalent to just under 4 Btus of energy.
- There are about 1,055 Joules (J) in 1 Btu.
These are but a few examples - you can pick any amount and any form of energy, and it can be converted to Btus or any other energy unit. The US EIA has a useful unit converter [27].
This is useful in many ways, one of them being that it is possible to tally up all of the energy “used” by a given person or group of people – including a city, state, country, continent, or even planet – and convert that number to a single quantity to see how much energy is being used. Further, it is often possible to separate total energy use into categories to compare uses. This can provide a nice snapshot of energy use and can tell you a lot about the energy regime in an area, including how much is being wasted.
Visualizing Energy Use
The U.S. Department of Energy (DOE) is part of the Executive Branch of the U.S. government. According to whitehouse.gov [28]: "The mission of the Department of Energy (DOE) is to advance the national, economic, and energy security of the United States." The DOE is another excellent source of information (the US EIA is run by the DOE). In addition to providing information, the DOE funds a lot of research, much of which is performed by people in the national labs. There are 17 national labs [29] in the U.S., each with a different research focus. The national labs host some of the top researchers in the U.S., and because they are funded by taxpayers, all of the non-sensitive information is published for free. These are great sources of reliable and cutting-edge information. (Feel free to browse the national labs [30]' website.)
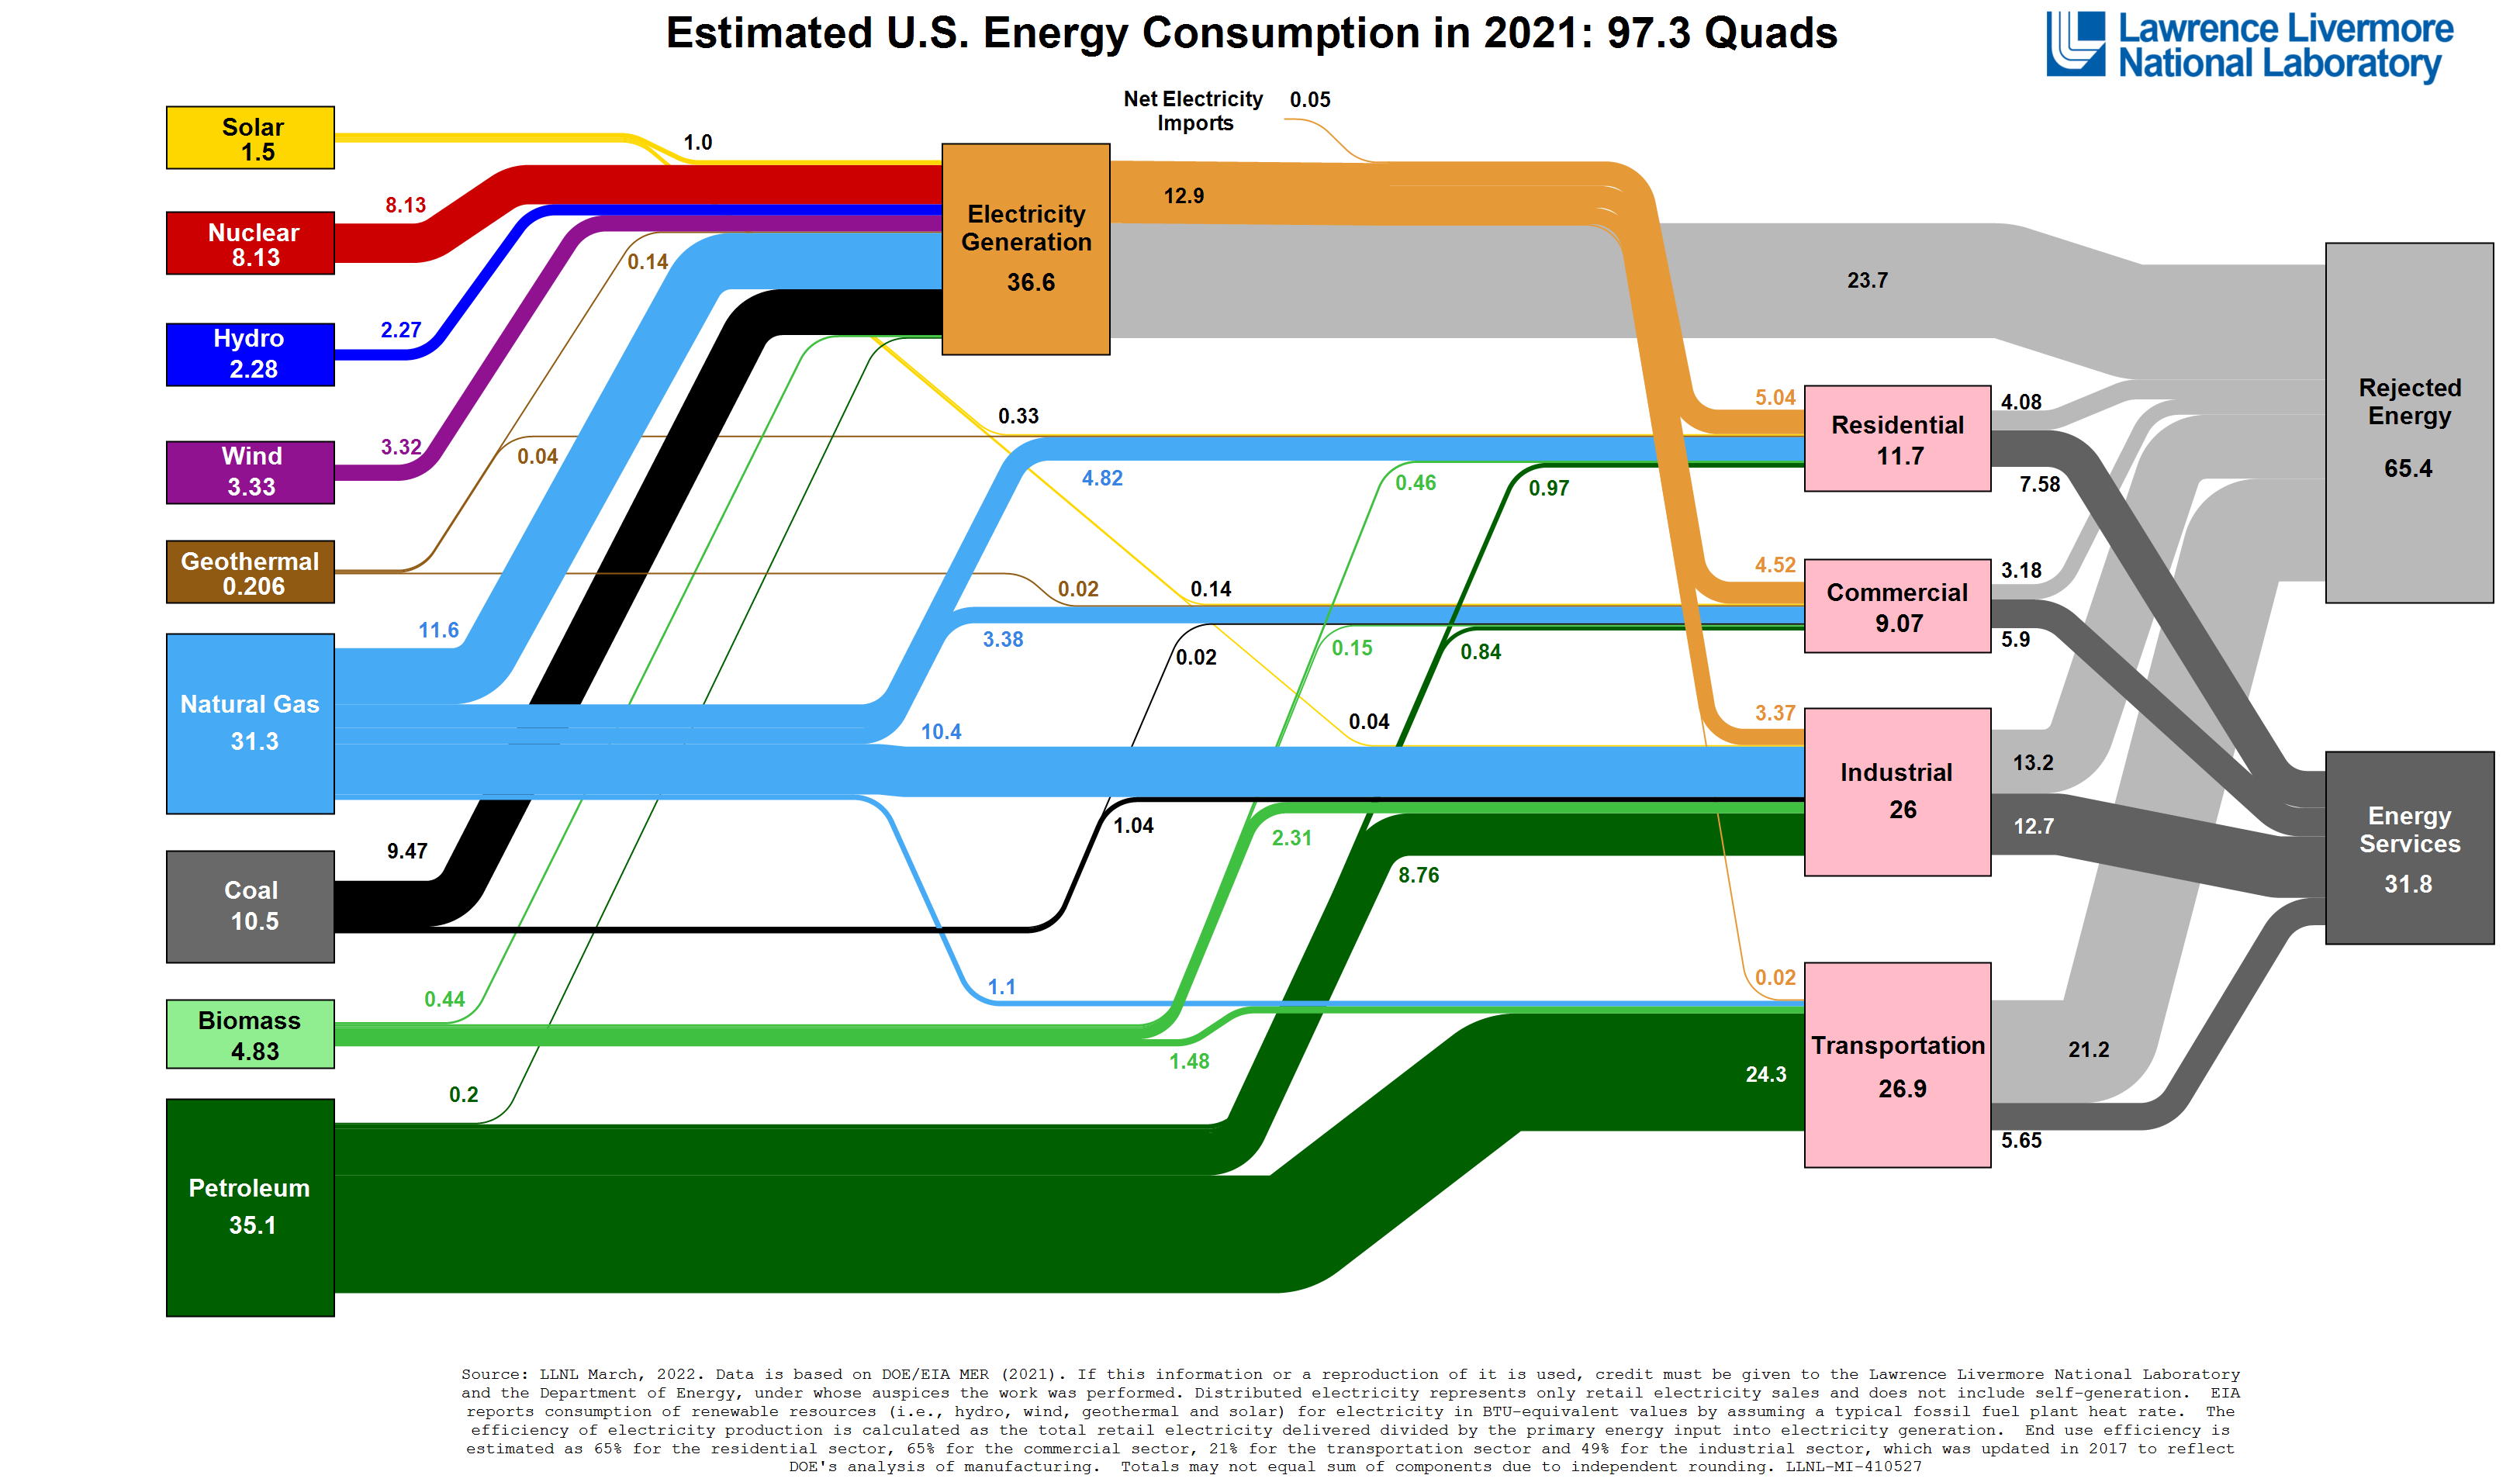
Apropos to our discussion of energy use, Lawrence Livermore National Lab (LLNL) [31] in California publishes annual energy use data for the U.S. and often for U.S. states. The image below (click on it to see a larger version) shows the most recent estimate of energy use in the U.S., divided by source. IMPORTANT: LLNL uses quads as their fundamental unit. As mentioned in a previous reading, a quad is a quadrillion Btus, which is 1,000,000,000,000,000 BTUs, or 1 x 10¹⁵ Btus. (Side note: This is one of my favorite charts! I appreciate the amount of information it provides and the ease with which it can be interpreted. It tells a robust - and important - story about energy use in the U.S. I can't be the only one that has favorite charts, can I? Anyway, moving on...)
 [32]
[32]
You can click on the chart to open a larger version in a new window.
he "blocks" on the left are energy sources (also called primary energy), the pink blocks on the right are end-use sectors (note that electricity is NOT an end-use sector), and the grey blocks to the far right indicate whether or not the energy was successfully used ("Energy Services") or wasted ("Rejected Energy"). All of the numbers in the chart indicate total energy flows or uses. Think of this as a flow chart - follow the lines from left to right to see how energy is used in the U.S.
Let's look at coal as an example. (Find coal on the left side of the chart, then follow the lines coming from coal on the chart and observing the numbers associated with those lines.):
- The U.S. used about 10.5 quads of coal in 2021 (this is up from 9.7 in 2020 and down from 17.9 quads in 2014 [34], by the way).
- Of that, 9.47 quads were burned to generate electricity, and
- 1.04 quads were used in the industrial sector (mostly to create heat for things like making steel), and
- 0.02 quads were used in the commercial sector
You can see where each energy source was "used" by following the chart. Oil is mainly used in the transportation sector but is used in all others as well. Natural gas is used in many sectors too. Nuclear is only used for electricity generation. All of this can be seen by following the energy sources on the left to the end uses on the right of the chart.This type of diagram is called a Sankey diagram and can be used for any number of purposes. Lawrence Livermore creates Sankey diagrams for each state, and many countries have diagrams as well. There are even some used to describe water and carbon flows in the U.S. At any rate, it is a useful tool for analyzing energy and other resource flows.
Check Your Understanding - Chart Analysis
Answer the following 2 questions.
Optional (But Strongly Suggested)
Now that you have completed the content, I suggest going through the Learning Objectives Self-Check list at the top of the page.
Energy Efficiency
Learning Objectives Self-Check
Read through the following statements/questions. You should be able to answer all of these after reading through the content on this page. After going through the content, check the boxes next to the questions/statements that you feel at least somewhat confident answering. I suggest writing or typing out your answers, but if nothing else, say them out loud to yourself. This is to help you reflect on important content, and will help you prepare for this week's quiz. It will also help lay the foundation for future course content.
Explain what it means when an appliance is 40% efficient, in terms of input and useful output.
Though many forms of energy can be converted to many others, it is important to consider how efficient the conversion process is. Energy efficiency is the percentage of "useful" energy that is converted from another form.
For example, have you ever thought about what it means to have an "efficient" light bulb, like a light emitting diode (LED)? Think about it - the purpose of using a light bulb is to provide light. Seems obvious enough, but did you know that about 90% of the energy used by an incandescent light bulb is actually converted to heat? Only about 10% is converted to light, which means that incandescents are about 10% efficient. If you are still using these old-style light bulbs, you are wasting about 90% of the money you spend on the electricity used, unless you are purposefully using them to heat your house (this is a very expensive way to heat your house, by the way). This is one reason why CFLs have become so common, and now LEDs ("light emitting diodes") - both of them are around 40% - 45% efficient, which is 4 - 4.5 times as efficient as an incandescent.
Good to Know
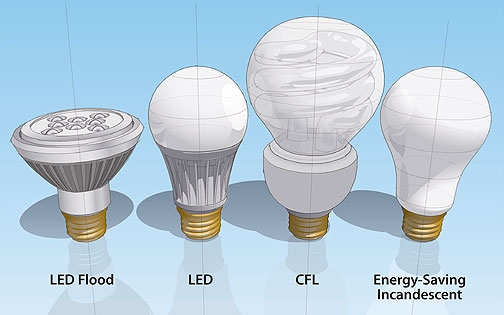
Consumers have a wide array of energy efficient lamps available to them. In addition to using electricity more efficiently, CFLs last about 10 times longer than incandescents, and LEDs around 25 times longer.
Efficiency considerations can be made for anything that uses energy. An efficient car is one that gets a lot of miles (useful "output") per gallon (energy input). An efficient home heating system, such as an electric heat pump, releases a lot of heat energy (output) for each kilowatt-hour of electric input. TVs, cell phones, airplanes, refrigerators, you name it - all have a certain efficiency. It can be used in other contexts as well. If you are efficient at work, you get a lot done (output) in a short period of time (input). In an efficient outing by a baseball or softball pitcher, not many pitches (input) were required to retire the batters (getting outs is the useful output).
This leads us to one aspect of the Second Law of Thermodynamics. A full explanation of the 2nd Law goes beyond the scope of this course, but you are welcome to watch the video below (9:29) from the Kahn Academy for a short explanation. One application of this law is that it is impossible to convert energy into a more dense, useful state without adding energy to the system. As Dr. Eric Zencey of the University of Vermont describes it, "the capacity of the energy to useful work is diminished" whenever it is transformed from one form to another (source: Is Sustainability Still Possible? p. 73). In other words, when energy is converted from one form to another, it is impossible to convert all of it. Some is "wasted" in another form, usually heat.
Let's continue with the lighting example to illustrate this. When using a light, electrical energy is converted almost entirely to light and heat (there may be a little sound energy thrown in there, but not much). Electrical energy is relatively dense, useful, and easy to control. You can store electrical energy in a battery. It is relatively easy to transport across distances without losing much. It can be used for many different things. But what about light and heat? Both of them are relatively diffuse and difficult to control. Neither is particularly useful for converting to other forms. It is very difficult to convert heat or light into another form with any kind of efficiency. Sure, you can convert heat back into electricity. In fact, this is exactly what happens in a typical power plant. But this process is very inefficient. Going further back, it is impossible to convert light, heat, or electricity back into coal (or oil, natural gas, or nuclear energy). Fossil fuels are very energy dense, and the molecules and atoms are neatly organized. Once the bonds are broken and the energy is released, there is no way to put it back together. That's the 2nd Law in action.
To Watch Now
The video below provides a very good explanation and animation of how a coal-fired power plant works. Think it's as easy as dumping a bunch of coal into a furnace and turning a turbine? Watch the video to find out. (9:28 minutes)
First Energy operates twenty power plants in the northeast United States that produce nearly seventy million megawatt-hours of electricity each year for over 4 million residential, commercial, and industrial customers. Over half of First Energy's electricity is produced by using coal compared to about 60 percent nationwide. Let's see how electricity is generated from coal by taking a virtual tour of a coal-fired power plant similar to those operated by First Energy.
This plant has three generating units that produce more than 2,000 megawatts of electricity. At full capacity, this one power plant can produce enough electricity to supply the needs of one and a half million homes and businesses. Generating electricity requires a fuel source. At this plant, the fuel source is coal which arrives mainly by a barge but also by rail and truck. Each barge delivers 1500 tons of coal - enough to keep the plant running for a couple of hours. The plant uses about 21,000 tons of coal each day, so over a million tons of coal is stockpiled next to plant. A device called a stacker reclaimer scoops coal onto a quarter mile long conveyor that can transport up to 900 tons of coal into the plant each hour.
Once inside the plant, up to a thirty-hour supply of coal can be stored in bunkers. Coal moves from the bunkers to feeders to be measured and moved to pulverizers. Each generating unit has 16 coal feeders that supply 8 pulverizers. Coal enters the pulverizer and spins in a large drum where hundreds of steel balls grind it into a fine powder.
Now a fine powder, the coal leaves the pulverizers and heads to the boiler. About 335 tons of coal can be pulverized per hour. Large fans add warm air to the powdery coal and blow it into the boiler. The boiler has miles of tubes filled with high quality water. Once inside the boiler, the coal ignites, releasing energy and generating intense heat. This changes the water inside the tubes to hot dry steam. The temperature of the steam is now about 1,000 degrees Fahrenheit. This process generates thermal energy which is transformed to mechanical energy at the turbine which is the next stop on our tour.
High pressure steam, now one thousand degrees Fahrenheit at 3500 pounds per square inch, is piped from the boiler to the first in a series of turbines. Here it expands between layers of turbine blades mounted on the turbine shaft the steam loops back to the furnace, then on to the second turbine. In this process, the steam turns the series of turbines 3600 revolutions per minute, providing power to the generator, the last in the series of machines. The generator continuously creates an electrical charge of 34481 amps at 18000 volts of electricity. From here, the electricity leaves the plant and begins its journey to customers.
After the steam has been used to create electricity, it is exhausted from the turbine and sent to a condenser to be changed back into water. Inside the condenser, steam passes over the outside of pipes filled with chilled water from the cooling towers. The steam condenses to water and returns to the boilers to repeat the steam generating process over again. As the steam condenses, the chilled water inside the condenser pipes becomes warm from the heat of the steam, so it is sent to a cooling tower. These particular towers are called natural draft cooling towers, which are designed with no moving parts. Inside, the water splashes over a series of baffles which breaks up water into small droplets. These droplets mix with air from the open bottom of the tower, evaporating some of the water and cooling the rest by as much as 27 degrees. The newly chilled water returns to the condenser to repeat the process, cooling more steam.
Since 1971, First Energy has spent more than $5 billion dollars on environmental protection. Our plants are equipped with air quality control systems to remove sulfur dioxide and particulates called fly ash. Fly ash is removed by a mechanical process, and sulfur dioxide is removed with a chemical reaction using lime. These processes take place in large ductwork scrubber trains located between a unit's boiler and its chimney. Boiler gases pass through scrubbing vessels and are sprayed with slurry, a mixture of water and lime. The sulfur dioxide particles and other pollutants are absorbed by the slurry and fall to the bottom of the vessels. A fan releases the cleansed gases through the chimney. By the time this happens, more than 99 percent of particulates have been removed, as well as ninety-two percent of sulfur dioxide. A plant similar to this one can remove over 400,000 tons of sulfur dioxide each year.
The scrubbing process creates a huge amount of a byproduct called calcium sulfite. This plant could create more than 3 million gallons of calcium sulfite slurry each day. First Energy created a process that turns that waste product into a valuable building material called gypsum which is used to make wallboard or drywall. The slurry leaving the scrubbers is thickened and pumped through a forced oxidation gypsum or fog system. Oxygen is then added changing it into gypsum which is dried treated and sent to a gypsum manufacturer to make wallboard.
First Energy recycles about a half million tons of gypsum each year - enough to manufacture wallboard for seventy thousand new homes.
Precipitators are another method of extracting coal ash, also called fly ash, which can be recycled or deposited in landfills. This mechanical process extracts fly ash left over from the combustion process. These poles, called rappers, shake fly ash from a vibrating wire. Gas from the furnace containing fly ash flows into the box. The fly ash drops into a storage chamber and is blown into silos to be loaded into a truck.
Fly ash from First Energy plants is used in manufacturing a variety of products, including concrete crowding roofing shingles, grouting, and anti skid road materials. First Energy also use a selective catalytic reduction technology or SCR to reduce nitrogen oxide emissions. SCR systems work much like a catalytic converter on a car. Flue gas containing nitrogen oxide emissions from the combustion process is mixed with ammonia. The mixed gases travel through a series of catalytic layers which causes the nitrogen oxides to react with the ammonia. The reaction converts the nitrogen oxides to water vapor and pure nitrogen, a benign chemical that makes up eighty percent of the air we breathe. Both elements are returned to the environment through the station stacks.
Now that we've taken a look at how electricity is produced and some of the environmental control protection systems used in our plants, let's take a look at how the electricity is delivered to our homes and businesses. Transformers located just outside the plant boost the power from 18,000 volts to 345,000 volts. So it can travel long distances over transmission lines to where it is needed. Substations located along the path reduce the voltage so it can be moved along distribution lines attached to the utility poles. As the electricity nears customer locations, transformers on poles step down the power for usage in homes and businesses. We hope you enjoyed seeing how electricity is produced at First Energy where our energy is working for you.
Optional - Explanation of the Second Law of Thermodynamics
The second law can be confusing, but the narrator in the video below does a pretty good job of explaining some aspects of it. Watch the Second Law of Thermodynamics (12:40 minutes) from Kahn Academy.
Let's talk about the Second Law of Thermodynamics. This law is weird. There's about 10 different ways to state it, which is one reason why it's weird. Let's start with one of the most common ways to state it, which is, if you've got a cold object and a hot object, heat will never be seen to flow spontaneously from a colder object to a hotter object. So if you have these two sitting together, maybe an ice cube and a hot piece of metal, and you make them touch, heat's going to flow between them, but we know what's gonna happen. The heat's gonna flow from the hot object to the cold object, and never the other way. At least, not spontaneously. You can force heat from a cold object to a hot object, like we do with a refrigerator or a freezer, but that's using a heat pump. And those refrigerators and freezers are doing work to force that heat from the cold region into the hot region. It won't do it spontaneously by itself. You've got to force it to do it. So what the second law says, or at least one version of it, is that that process will never be seen to happen in reverse. The heat will never be seen to flow from the cold object to the hot object. Now, you might be thinking, "Duh. "Do we really need a law to tell us that?" But it's not so obvious, because you can still conserve energy and momentum and all the other rules of physics and laws of physics by allowing heat to flow from the cold object to the hot object. In other words, let's say the cold object started with 10 Joules of thermal energy and the hot object started with ... It's hotter, so let's just say it has 30 Joules of thermal energy. You could imagine five Joules of energy going from the cold object into the hot object which would leave you with five Joules of energy for the cold object, 35 Joules of thermal energy for the hot object. You still have 40, just like you did before. You didn't break the law of conservation of energy. It's just, energy won't go that way. So why? Why is thermal energy never seen to flow from the cold object to the hot object, even though it satisfies every other known law of physics besides the second law? Well, before we answer that question, I think it'd be useful to talk about an alternate version of the second law, which looks something like this. The total disorder will never be seen to decrease. What do I mean by "disorder"? Imagine you had a room and there were blue spheres. And they're bouncing around wildly. So these all have some velocity and random directions. And when they strike a wall or each other, they lose no energy. So they keep bouncing around like crazy. And then there's another section of the room with red spheres, and these are also bouncing around randomly. They lose no energy. They keep doing their thing. Except, there's a divider in this room that doesn't allow the red spheres to go onto the blue spheres' side, and vice versa. These can't mix up. So right now, this is an ordered state because the reds are separated from the blues. So we say that this state has a certain amount of order to it. But let's imagine we removed the divider. Now what's gonna happen? Well, you'll see these things mix up. This blue sphere will move over here, and it'll bounce onto this side. This red sphere will go over here. They'll just keep getting mixed up. And at some given moment, you might find the spheres in some configuration like this. They're still bouncing around, but now they're all mixed up and we say that this state has a higher amount of disorder. This is not ordered. We say that this is more disordered, which supports the second law. The second law says, if you let things do what they wanna do spontaneously, your system will go from a more ordered state to a more disordered state. And you'll never see it go the other way. We can stand in this room and wait. But you're probably never gonna see the blue spheres line up all on the left side and the right spheres line up on the right side. With 12 total spheres, maybe if you wait long enough, a really long time, you might catch it where all the red spheres are on one side and blues are on the other. But image this. Imagine now, instead of six reds and six blues, there's 100 reds, 1,000 reds, maybe 10 to the 23d and Avogadro's number of reds, and now they're all mixed up. The odds of ever seeing them get back to this ordered state are basically zero. The probability isn't exactly zero, but the probability is very, very low that you would ever see a disordered state with that many number of particles reassemble themselves into an ordered state.
So we kind of just know that from experience and what we've seen in our day-to-day lives. But you still might be wondering, "How come? "How come we never see a disordered state Well, it basically has to do with counting. If you were to count all the possible ways of lining up the reds over here on this side and the blues on the left-hand side, there'd be a lot of combinations that would satisfy that condition. I mean, you could swap this red with that red, and this red with that red, all on the right-hand side. All these reds could get swapped around. And these blues, as well. They can get swapped around on the left-hand side. You get a large number of variations that would satisfy the condition of blues on the left, reds on the right. But now I want you to ask yourself, how many possibilities are there for having blues and reds spread out through the whole room? Well, you could probably convince yourself, there's more. And it turns out, there'll be a lot more. its position on the right-hand side somewhere. This red can get swapped out anywhere over here. I can swap a red with this blue, and this blue with this red, and this red with this red, and this blue with this blue. I can move them all over. Now that these spheres have the whole room through which they can mix, the amount of states that will have blues and reds mixed throughout the whole room will vastly outnumber the amount of states that have just reds on one side and just blues on the other side. And this simple idea is the basis for the Second Law of Thermodynamics. Roughly speaking, the Second Law of Thermodynamics holds because there are so many more disordered states than there are ordered states. Now, I'm gonna tell you something that you might not like. This particular disordered state that I have drawn, this exact one, is just as likely as this exact ordered state. In other words, if I get rid of the barrier over here, if you came in, you'd be just as likely to find the room in this exact configuration as you were to find it in this exact configuration. These two exact states are equally likely, which sounds weird. It makes you think, "Well, you're just as likely But no. This particular state is just as likely as this other particular state. But there are so many more mixed-up states than there are separated states. Even though any particular state is just as likely, since the mixed-up states vastly outnumber the separated states, if you pick one at random, it's gonna be a mixed-up state because there are so many more of them. Imagine putting these all into a hat. Imagine writing down all the possible configurations of states, ordered, disordered, in between. You put them all into a hat, you pull one out randomly, any particular state is just as likely. But since there's so many more disordered states, you pick one out randomly, it's probably gonna be mixed up. And if there's a large number of particles, you're almost certain to find it mixed up. So to help us keep these ideas straight, we need some different terms. Physicists came up with a couple terms. One is a macrostate. And a macrostate is basically saying, okay, the particle are mixed up. That's one possible macrostate. And we could be more precise. We can say, the reds and the blues can be anywhere within the box. Another possible macrostate would be to say that the particles are separated, that is to say, reds are on this side, anywhere on that side, but on the right side, and blues are on the left side, anywhere on the left side. These terms are referring to a macrostate, an overall description of what you would see. Now, there's another term, a microstate. And a microstate is a precise, exact description of the nitty-gritty details of what every particle is doing within there. If I just tell you, "The particles are mixed up," you're not gonna know exactly where they are. Similarly, if I just tell you, "They're separated," you're not gonna know exactly where they are. You'll know they'll be on the right-hand side, the red ones will, but you won't know. Maybe this red ones moves down here, maybe this red one moves up here. The microstate is an exact description. This red one's right here, going a particular speed. This blue one's right here, going a particular speed. If you specify the exact location, blue right here, blue right there, going that fast, red right here, what you're describing to me is a microstate. And so the second law, another way of thinking about it, there are more microstates for a disordered macrostate than there are micorstates for an ordered macrostate. And that's why we see systems go from order to disorder. It's really just a statistical result of counting up the possible number of states. You might be wondering, what does this have to do with heat going from hot to cold, all this talk about microstates and macrostates? Well, it's not just position that can get disordered. It's velocities that can get disordered, energy that can get disordered, and that's more of like what's happening up here. The positions of the hot molecules aren't necessarily moving over into the cold range. But the energy over here is getting dissipated into the cold area. So image it this way. Let's get rid of all this. And imagine you had a room with a gas in it, but this gas was kind of weird. At this particular moment, all the gas molecules on the right-hand side were moving really fast, and all the gas molecules on the left-hand side were moving really slow. So the room was separated into a cold region and a hot region, just like this energy is. This is ordered, or at least, somewhat ordered. It's more ordered than it's going to be. If you wait a while, this is all gonna mix up. You're gonna have some fast-moving particles over here, some slow ones over here. It's all gonna be blended together.
And so, what would you say if you were standing in here? At first, you'd feel cold because these particles don't have a lot of energy. Then you start feeling warmer and warmer. You'd say heat is flowing over to the left because you feel faster-moving particles striking your body. And so you'd rightly say that heat is moving from the right of this room to the left of this room. It flows from the hot to the cold. And that's what's happening up here. Heat flows from the hot to the cold. You might object. These are solids, I said, copper and an ice cube. A copper atom's not gonna make it over into the cold ice cube. But the energy is gonna move. So you can make the same argument over here. Don't allow these, let's say these are the copper atoms moving around fast, or at least jiggling in place rapidly. When they bump into the slower-moving water molecules in the ice cube, they're gonna give those water molecules some of their energy. And this energy's gonna become mixed up. The energy will become disordered. It will go from this ordered state, where the high energy is over here and low energy's here, to a disordered state where the energy's distributed somewhat evenly. So essentially what I'm saying is, if you consider the macrostate, where the hot molecules are separated from the cold molecules, there will be less microstates that satisfy that condition than there will be microstates that satisfy the condition for a macrostate where the energy is mixed up and you're just as likely to find a fast-moving particle on the left as you are on the right. This will have vastly more microstates, many more possible ways of making up a mixed-up state than there are microstates that create a separated state. I mean, there's gonna be a lot. I'm talking a lot of microstates that satisfy this condition for this macrostate, separated. But there will be so many more microstates for the mixed-up case, this dominates. That's why you always see heat flow from a hot object to a cold object, just because it's statistically inevitable with the large number of particles that you have here. There are so many more ways of heat flowing from hot to cold than there are from cold to hot, statistically speaking, you just never see it go the other way. Energy will always, at least spontaneously, if you let it do what it wants to, energy's always going to dissipate and evenly distribute. That's why it goes from the hot to the cold. This energy's trying to get mixed up, just because statistically, there are so many more ways for that to happen. Now, I need to tell you that there's actually a scientific term for the amount of disorder, and we call it the entropy. Physicists use the letter S to denote the entropy. And if you wanna know the formula for the entropy, you could look on Bolzmann's grave. This is Ludwig Bolzmann. He's got it on his gravestone. How awesome is that? The entropy S is k, Bolzmann's constant, times log. This is actually natural log of W. And W is the number of microstates for a particular macrostate. So you got some configuration, you wanna know the entropy? Just look at what macrostate it's in, count up how many microstates are there for that macrostate, take log of it, multiply by Bolzmann's constant, that gives you the entropy. And there's a term for this W. It's called the Multiplicity, because it's determining the multitude of microstates that satisfy the conditions for a particular macrostate. Now, entropy is cool. Entropy is weird. Entropy is somewhat mysterious and still, probably, has secrets for us to unlock here. I don't have time to go into all of them here, but if you read up on it, entropy has a role to play in the fate of the universe, the beginning of the universe, the arrow of time, maybe our perception, all kinds of facets of physics that are extremely interesting. And entropy, you always find this guy lurking around. And one place you always find entropy is in the Second Law of Thermodynamics, because it allows us a third way to state the second law, which is that the total entropy of a closed system will always be seen to increase. Technically, if it's a reversible process, the entropy could stay the same. But honestly, for all real-world processes, the entropy's gonna increase for a closed system, which is to say that the disorder increases.
Here is another optional link regarding the 2nd Law [39].
Clearly, a lot of engineering goes into building a power plant. Despite the technical prowess required to convert coal into electricity, the process is extremely inefficient, as are all of the major forms of electricity generation in the U.S. and the world. Take a look at the chart below to see just how inefficient this process is for different fuels.

As you can see, as the most efficient fuel, natural gas-fired power plants are just above 40% efficient on average. Coal is closer to 30%. This, of course, means that around 70% is wasted as heat. 70%! And this does not take into consideration the losses associated with transporting the electricity across long power lines, which in the U.S. averages around 5%.
Power plants are not alone in their inefficiency. The typical internal combustion engine of a car only provides around 20% - 25% of the energy from gas to move the car. New natural gas furnaces are very efficient (95%+), but many older ones operate at lower than 80% or even 70% efficiency. This is all poor energy management in principle - it's just plain wasteful - but it is also important for a couple of other reasons, one in particular. Specifically, there is a limited amount of all of these sources, and yet they are essential for modern society. In other words, coal, oil, natural gas, and nuclear are non-renewable energy sources. (To be fair, all indications are that the world will not run out of coal, natural gas, oil, or nuclear energy terribly soon, but no one knows when it will become too expensive to use. More on that later.)
The "Fifth Fuel" (Or Perhaps the "First Fuel")
One last note before moving on to renewable and non-renewable sources. Energy efficiency is sometimes referred to as the "fifth fuel." Why do you think that is? (Hint: coal, oil, natural gas, and nuclear are the four primary fuels used globally, though that is changing as renewables are used to a greater extent.)
Increasing efficiency reduces the use of other sources of energy. Efficiency is on the demand side of energy use because it affects energy demand (think of this as how much energy is "demanded" for use.) Energy sources are the supply side of energy use because they supply the energy. By reducing demand through energy efficiency, you reduce the need for supply, which is almost like having more supply, to begin with. Hence, it is sometimes referred to as the "fifth fuel." There are tremendous opportunities for energy efficiency improvements worldwide.
Some energy efficiency advocates refer to efficiency as the "first fuel," because they feel that it should be the top priority in terms of energy management. There is some strong validity to this. Consider that a report [42] from the American Council for an Energy Efficient Economy found that it is cheaper to reduce energy use through efficiency than it is to supply energy by any other source. Very interesting reading, if you are so inclined (and only a few pages long).
Check Your Understanding - Efficiency
Optional (But Strongly Suggested)
Now that you have completed the content, I suggest going through the Learning Objectives Self-Check list at the top of the page.
Renewable and Non-Renewable Energy
Learning Objectives Self-Check
Read through the following statements/questions. You should be able to answer all of these after reading through the content on this page. After going through the content, check the boxes next to the questions/statements that you feel at least somewhat confident answering. I suggest writing or typing out your answers, but if nothing else, say them out loud to yourself. This is to help you reflect on important content, and will help you prepare for this week's quiz. It will also help lay the foundation for future course content.
What is the difference between renewable and non-renewable energy?
Knowing whether a source of energy is renewable or non-renewable is important when considering energy and/or sustainability. Renewable energy is defined by the U.S. Environmental Protection Agency thus: “Renewable energy includes resources that rely on fuel sources that restore themselves over short periods of time and do not diminish” (Source: U.S. EPA [43]). Non-renewable energy is energy that cannot restore itself over a short period of time and does diminish. It is usually easy to distinguish between renewable and non-renewable, but there are some exceptions (more on that in a minute).
To Read Now
Once again, we will go to the US EIA for a description of renewable energy sources. Please read through the following links (quickly, if nothing else). You are welcome to read the sub-headings for each source, but that is not necessary. The key points are summarized below.
- Solar [44]
- Wind [45]
- Wind Turbines (video) [46] (Transcript [47])
- Hydropower [48]
- Biomass [49]
- Biofuels [50]
Optional Readings/Videos
- Solar Photovoltaics video [51]
- Geothermal [52]
Please note that these readings only scratch the surface of the world of renewable energy sources! The DOE's "Energy 101" YouTube channel [53] has a bunch of good, short videos about different energy sources, note that there are a lot more energy-related links on the EIA websites that you read just now. You could spend your whole career learning about them (as some people do), and still have more to learn. I encourage you to learn as much as you can about these and other sources. It may sound like hyperbole, but you can never know too much about energy. It figuratively and literally makes the world go 'round.
Renewable Energy
It should be clear how most of these sources fit the definition of renewable energy ("resources that rely on fuel sources that restore themselves over short periods of time and do not diminish") and have various benefits and drawbacks. Please note that this does not provide a comprehensive list of pros and cons, but will give you a solid idea of many of them:
- Solar energy comes directly from the sun, which comes every day in most locations and does not diminish appreciably over time. Yes, the intensity does ebb and flow on short and long timescales, but it is hopefully not going away anytime soon. If the sun burns out and stops shining, we have bigger problems than solar panels not working!
- Pros: A few benefits of solar energy are that it is relatively predictable and reliable, it is effectively limitless, and that it does not create any emissions/pollution when generating energy.
- Cons: The main drawback is that it is intermittent, both in terms of the sun only being in the sky 50% of the time, and that weather can impact it significantly. Solar is also very diffuse, meaning that it is not very concentrated, and so, usually a large area is required to provide a lot of useful energy. Solar PV used to be very expensive but is now cost-competitive.
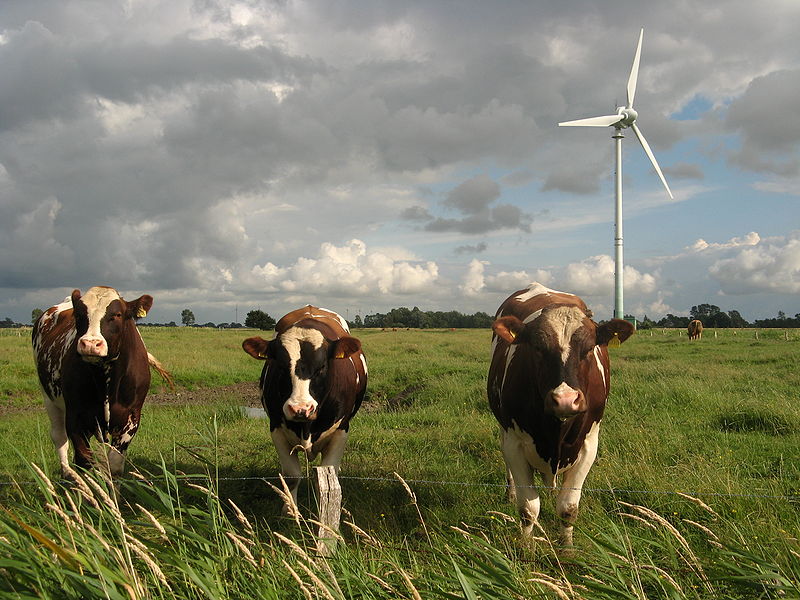
- The wind gets its energy from the sun - it is caused mostly by differential heating across the surface of the earth - so cannot be "used up" either.
- Pros: More good news is that the wind will never disappear as long as the sun shines and the earth is spherical, and like solar, wind does not generate emissions. Well-sited onshore wind is actually the least expensive form of electricity.
- Cons: However, the wind is also variable - more in some locations than others - and is less predictable than solar energy in most locations.
- Hydropower is the power in moving water and gets its energy from the sun as well and is even more consistent in most locations than the wind.
- I want you to think for a moment how the energy in moving water started out as solar energy. (This is a good thought experiment in energy conversion.) Answer: Remember that water flows downhill, and so the motion energy in flowing water started out as gravitational potential energy. How does water get this potential energy, i.e., how does it get uphill? Mostly from evaporation caused by the sun!
- Pros: In terms of other benefits, like solar and wind, hydropower does not generate emissions, and is very consistent and reliable in most locations. Though it should be noted that some methane emissions result when organic material behind dams decomposes.
- Cons: There are some drawbacks associated with large hydropower installations (see the EIA's Hydropower and the Environment website [54] for some examples), and in some cases, very big environmental and social drawbacks (e.g., in the Three Gorges Dam [55] in China). All of these factors are important to keep in mind. Hydroelectricity is the single biggest source of renewable electricity in the world.
- One additional drawback of all of the above sources is that they are each location-specific. In other words, some locations may have a lot of sun, wind, and/or hydro, while others may have very little. (This will be addressed in more detail in a future lesson.) This problem can be at least partially solved by transporting electricity, but that is not always easy, and often expensive.
All of these sources renew themselves over short periods of time and do not diminish. And though intermittent, none of these sources are going to disappear in the foreseeable future. They are textbook renewable energy sources.
Good to Know: Agrivoltaics
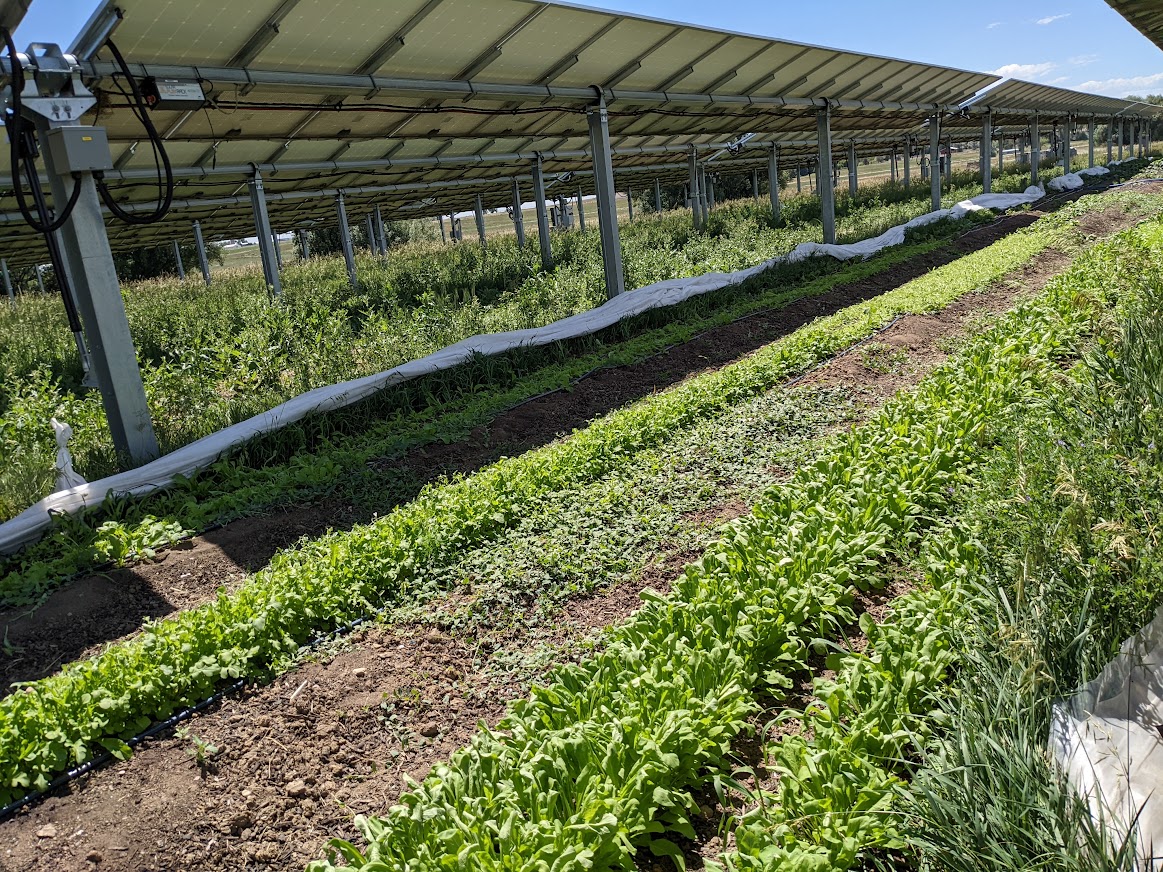
Agrivoltaics are a burgeoning systems-thinking application. Agrivotaics combines - you guessed it - agriculture and photovoltaics. Ground-mounted solar arrays are a great application of solar PV technology, but they do take up a lot of space relative to their energy output. So why not find a way to use all of this space? Enter agrivoltaics! With some careful design considerations (e.g. knowing which plants are shade-tolerant or even prefer some shade), crops can not only be successful but in some cases more successful in terms of production than when planted in an open field. This is particularly helpful in hot, dry climates, such as the eastern part of Colorado, which is pictured below. But it can be successful in more humid and cooler climates as well.
Agrivoltaics are becoming increasingly recognized and researched throughout the U.S. and internationally. Feel free to browse through the National Renewable Energy Laboratory's (NREL) article about agrivoltaics [57] for more information.
Okay, so what about biomass and biofuels? They are both derived from living or recently living things (trees, corn, algae, sugarcane, etc.) They also get their energy from the sun (anyone sensing a pattern here?), and plants are usually pretty good at regenerating themselves. But I want you to take a minute to try to think about examples of biomass and/or biofuels that might not be "renewable," in the sense of the definition above. Can you think of any examples of non-renewable biomass?
Nearly all forms of biomass and biofuels are renewable. Corn-based ethanol is the most-used source of bio-based energy in the U.S. Corn can be grown in the same field year after year, so it is renewable. Whether or not it is sustainable is another question, which will be addressed later. The primary source of bioenergy in Brazil is sugarcane. Nearly all of Brazil's vehicles are able to use 100% sugarcane ethanol for fuel. (Contrast this with the U.S., where most automobile engines are only required to be able to handle up to 10% ethanol.) Sugarcane grows year-round in Brazil, so is definitely renewable.
There are many other biomass sources that fit our definition of renewable, including animal dung, algae (for biodiesel), jatropha nut, soybean, switchgrass, and more. Wood is used around the world as a source of heat, particularly for cooking. Most trees and shrubs regrow relatively quickly, so they are generally considered renewable. But even a fast-growing tree like an oak (up to two feet per year, according to the National Arbor Day Foundation [58]) has limits. Though most biomass sources are considered renewable, keep this in mind: if you harvest a renewable resource faster than it regenerates, it will not be able to renew itself over time. We will revisit this point in a later lesson, but it is important to remember.
Not all Renewables Are Created Equal
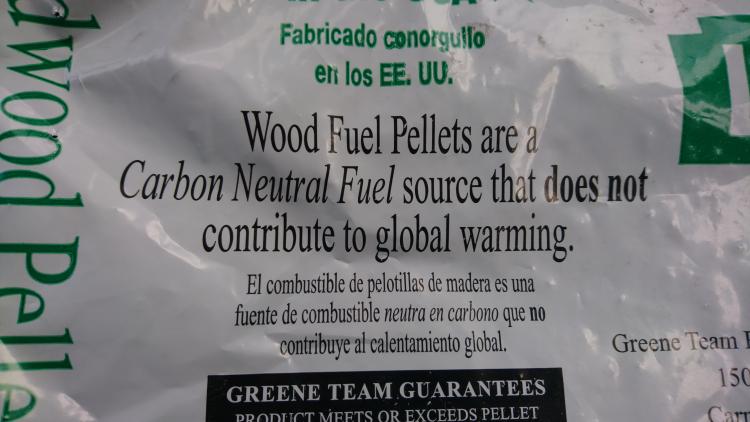
Most renewable energy sources are carbon-free. This means that they do not emit any carbon dioxide when they generate energy. Solar, wind, and hydroelectric are carbon-free. Nuclear, though not renewable, is also considered a carbon-free energy source, because unlike coal and natural gas, it does not burn. As noted in a previous reading, nuclear energy generates heat through fission, not combustion. Biomass and biofuels are often considered carbon-neutral because they emit carbon dioxide when they are burned. So, why are they carbon neutral?
Good to Know
The International Energy Association (IEA) is a good source of information for international energy data. The US EIA (not to be confused with the IEA) publishes some international data as well, but IEA is usually the first place I look. The chart below shows the estimated energy use by type worldwide in 2016, and the data are from their 2018 Key World Energy Statistics [59] document. Note that the energy unit they use is Mtoe, which stands for million tons of oil equivalent. A Mtoe is equivalent to about 0.04 quads. In other words, there are about 25 Mtoe in a quad. The amount of energy is not important for our purposes, but please take note of the percent of the total that each energy source provides.
FYI, another good, reliable source of global energy data is BP's annual "Statistical Review of World Energy [60]." It is worth browsing if you are interested!

There are a few interesting things to point out from the chart above.
- First of all, Total Primary Energy Supply (TPES) refers to all original or primary energy consumed. For example, if your electricity is supplied by a power plant, the energy your electronic device is using right now is not primary energy because the electricity was converted from an original source (e.g., coal, oil, natural gas, nuclear). Given that electricity generation is always less than 100% efficient (sometimes much less, per the previous section), the primary energy used by your device is greater than what shows up on your electric bill. Incidentally, the "energy sources" on the left-hand side of the sankey diagram that you looked at earlier this lesson are primary energy.
- Another interesting thing to point out is that biofuels are lumped together with "waste." In many parts of the world, including many states in the U.S., if you burn garbage to produce heat and/or electricity, it is considered a biofuel, and thus renewable. I'll leave it to you to think about whether or not that is reasonable. But note that biofuels (and biomass) constitute the majority of that "slice" of the global energy pie.
- Hydro is at only 2.5%. But where are wind and solar? We hear about them all the time in the U.S., and in other parts of the world. If you read the fine print at the bottom, you'll see that wind and solar's contribution was so small that it was lumped into the "other" category, at a measly 1.7%. This has improved since 2015 (and was 1.1% of the total in 2012), and in fact has been growing at an all-time high rate, but there is still a long way to go before wind and solar make a major dent in the global energy regime.
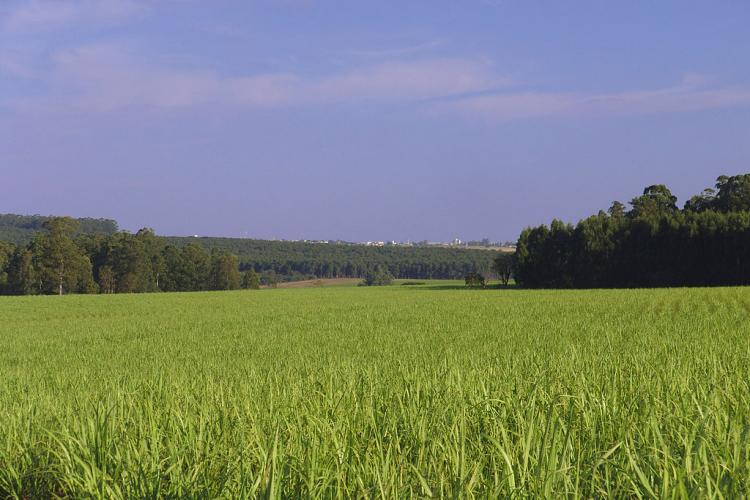
Non-Renewable Energy
Non-renewable energy sources diminish over time and are not able to replenish themselves. In other words, they are finite, and once they are used, they are effectively gone because they take so long to reform.
You have already read about the four non-renewable energy sources: coal, oil, natural gas, and nuclear. Let's start with coal, oil, and natural gas, which (as you read earlier) are referred to as fossil fuels. Fossil fuels were created from the remains of dead plants and animals. The source material is renewable (it's biomass!), but since they take millions of years to form, they are not replenished over a "short" period of time, so are non-renewable. Fossil fuels are forming somewhere under your feet right now, but don't hold your breath waiting for them to finish.
The nuclear energy we use comes from an isotope of uranium called U-235. Unlike fossil fuels, U-235 has cosmic origins: it was formed by one or more supernovae around 6 billion years ago, about 1.5 billion years before the Earth was formed (a supernova is a collapsing star, "supernovae" is the plural form of supernova) (source: World Nuclear Association [62]). Again, this is not renewable on a human timescale.
All fossil fuels emit carbon dioxide (CO2) and other emissions when they are used to generate energy. Recall that they are made mostly of hydrogen and carbon, and the carbon mostly ends up as CO2. Nuclear is considered carbon-free, because it is not burned, and it is not made of carbon. Remember that energy is extracted through fission or splitting of atoms. This generates heat, but no emissions. (It is important to note that it does result in very dangerous and long-lasting radioactive waste, but that will be addressed in a future lesson.)
To summarize:
Non-renewables
- Coal, oil, and natural gas are fossil fuels. Even though they all get their energy from the sun, none of them are renewable. They all emit CO2 and other emissions when burned.
- Nuclear is also non-renewable, but not a fossil fuel. It is carbon-free but causes radioactive waste.
- Most importantly, for all intents and purposes, whatever coal, oil, natural gas, and nuclear exists today is all that we will ever have.
Renewables
- Solar, wind, and hydro are renewable and carbon-free, and effectively inexhaustible.
- Bioenergy is renewable and carbon-neutral. It emits CO2, but no more CO2 than was originally pulled from the atmosphere. Even though it is considered renewable, it is possible to use bioenergy unsustainably by harvesting it more quickly than it can be replenished.
Check Your Understanding
All of the carbon dioxide emitted from coal, oil, and natural gas was originally pulled from the atmosphere to make the plants from which is was derived grow. In other words, the amount of carbon dioxide emitted is no more than the amount of carbon dioxide it originally removed from the air. Why are they not carbon-neutral energy sources?
Good to Know
We hear a lot about renewables and natural gas in the U.S., as their use has been growing rapidly for some time now. But as you can see in this chart from the EIA, coal and nuclear still constitute over 40% of all electricity generation in the U.S. Solar, despite its massive growth and growth potential, is only 1.8%! We have a long way to go, people!
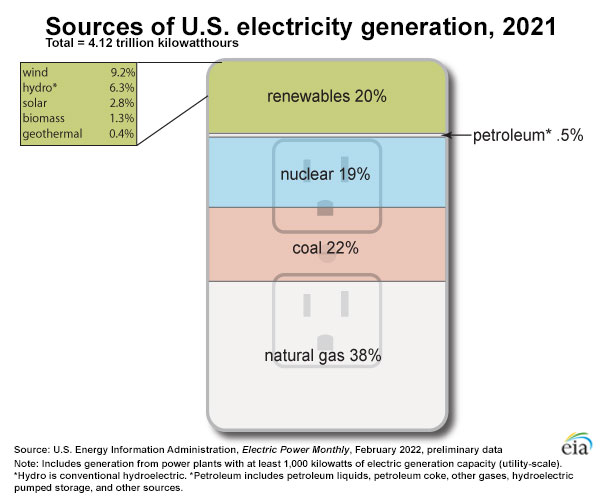 [63]
[63]
Optional (But Strongly Suggested)
Now that you have completed the content, I suggest going through the Learning Objectives Self-Check list at the top of the page.
Sustainability
Learning Objectives Self-Check
Read through the following statements/questions. You should be able to answer all of these after reading through the content on this page. After going through the content, check the boxes next to the questions/statements that you feel at least somewhat confident answering. I suggest writing or typing out your answers, but if nothing else, say them out loud to yourself. This is to help you reflect on important content, and will help you prepare for this week's quiz. It will also help lay the foundation for future course content.
Hopefully, you now have a reasonably good grasp of what energy is, how it is used, where we get it from, whether or not it is renewable, as well as some good resources for finding energy information. I do not expect you to be energy experts, but it is important that you possess a good baseline knowledge of energy basics if you are going to critically analyze material that has energy information in it. There are many free information sources available, some of which I listed in the previous pages. If you have suggestions for other sources, feel free to share them on one of the course discussion boards.
Sustainability and Sustainable Development
Okay, time to shift gears and address sustainability. Unlike energy, sustainability (and “sustainable”) does not have a universally accepted definition. The phrase “sustainable development” is usually used to describe the goal of sustainability planning, and is often used interchangeably with the term “sustainability.” For the purposes of this course, the terms are effectively the same. Before we start really digging into the term, it’s good to start with the root word “sustain.” Dictonary.com's most relevant definition of “sustain” [65] is:
“to keep up or keep going, as an action or process”
This lies at the core of the term, and is a good place to start. If something is being done that cannot continue to be done for the foreseeable future, then it is not sustainable. The devil is in the details, though, as we will see.
Suggested Reading
The reading in this box is not required. I summarize the key points below. But it will help you understand the content in more depth.
There is almost an unfathomable number of books, articles, and websites that address sustainability. I just Googled "sustainability" and got 437,000,000 results in 0.65 seconds! There is no shortage of information out there, nor is there any shortage of definitions of sustainability. Robert Engelman, President of the Worldwatch Institute, does a very good job of cutting through some of the "sustainable" and provides some cogent thoughts on the state of sustainability and how it can be framed in the book Is Sustainability Still Possible, by the Worldwatch Institute. You are welcome (but not required) to read his entire "Beyond Sustainababble" chapter [66]. I have provided key excerpts below, which I suggest you read before moving on. I have emphasized some key text in bold lettering:
We could spend weeks analyzing the content of Engelman's chapter, but I would like to focus on a few key points.
1. The Overuse of the Term "Sustainability" and "Green"
First of all, what it means to be sustainable (and it's even fuzzier substitute "green") is open to interpretation at best, and misuse at worst. (Greenwashing is an example of such misuse, and will be addressed in more detail later in the course.) Since there is no single definition of sustainability, anyone is free to use the term to describe whatever they want, regardless of whether or not it is truly sustainable. Sustainable travel, sustainable consumption, sustainable underwear, sustainable food, green growth, green cars, greenhouses, green energy - as Engelman puts it, "frequent and inappropriate use lulls us into dreamy belief that all of us - and everything we do, everything we buy, everything we are - are now able to go on forever, world without end, amen" (p. 4).
How often do people stop and think about what it really means to be sustainable or green? Engelman points out, and I must say I agree, that too often it means "better than the alternative." But simply doing "better" is almost certainly not going to be enough to achieve a sustainable world. Hopefully, the content in this course will help you find out why!
2. The Brundtland Commission and Intergenerational Equity
Engelman also mentions the Brundtland Commission's definition of sustainable development:
Sustainable development "meets the needs of the present without compromising the ability of future generations to meet their own needs." (Source: Is Sustainability Still Possible?, p. 3. Original source: Our Common Future, World Commission on Environment and Development. Full text available here. [67])
This is the most commonly cited definition of sustainability/sustainable development, in part because it appeared in a book - Our Common Future, published in 1987 - that was the first organized international attempt (in this case, by the United Nations) to address what was widely seen as a global problem. Namely, the commission was tasked with analyzing and proposing solutions for the unsustainable course on which the world's societies were on. But it is also a good, concise way to sum up some primary goals of sustainability. Perhaps most importantly, it acknowledges the need to focus on the world that we leave to future generations. As Engelman puts it, we need to ask ourselves "whether or not civilization can continue on its current path without undermining prospects for future well-being" (p. 4). It is important to point out that not only does society need to simply "last" or "continue" for sustainability to happen, but that we need to consider the quality of life of people living in future societies. This concern is often referred to as intergenerational equity. We will investigate the quality of life in more depth in future lessons.
On paper, the goals indicated by this definition may seem pretty straightforward:
- allow the current generations to continue to thrive,
- improve the lots of those that are currently suffering, and
- make sure future generations are able to meet their "needs."
But what is a "need," exactly? Is it meeting the bare essentials of survival, e.g., food, shelter, and clothing? Do I need to have a car? Do you need to have 3+ solid meals a day? Does your neighbor's family need that guest bedroom for when family visits? Do working Germans need to have four weeks of paid vacation each year? Does the mother or father in rural Kenya need a cell phone if there are no landlines? Does India need to update its outdated electricity infrastructure? It's hard to argue that any of these things are true needs, but if you asked each person in this situation, they would all probably say that they are, or at least that they are an important aspect of their lives.
Further, as Engelman brings up, to what degree do we sacrifice the needs and wants of the current generation in order to maximize the chances of future generations to live a good quality of life? Are you willing to impact your quality of life by buying fewer things, not traveling by airplane, not eating meat, living in a smaller house, not owning a car, and growing your own food, just so people in the future can live a better life? I would argue that some of these things actually improve the quality of life for you right now, but who has the right to decide what quality of life means? And how can we guarantee that any of this will work? None of these questions have easy, obvious, or even objectively correct answers, but they are all important to ask if we are to address sustainability.
3. Environmental Concern
There is something explicitly missing from the Brundtland Commission's definition (though it is implied) and from any part of the discussion so far, though it is mentioned in the book chapter. What about the natural environment? There are a few ways to approach this question - nature-centric (ecocentric) and human-centric (anthropocentric) - but for now, let's focus on the anthropocentric approach.
The anthropocentric sustainability implications of human concern for nature are concisely summarized by the US EPA when they note that "everything that we need for our survival and well-being depends, either directly or indirectly, on our natural environment" (Source: US EPA [68]). We will investigate this further through ecosystem services in a future lesson, but the logic is impossible to argue against: If we destroy nature, we destroy ourselves. At the very least, the oxygen we breathe is generated by plants and other organisms like phytoplankton, and the food we eat is reliant upon soil and water, though there are many more things we currently depend on nature for. Many would argue that nature has value in and of itself (this is generally referred to as deep ecology or ecocentrism), but that goes beyond the scope of this course.
4. The Importance of Metrics
As Engelman stresses throughout his chapter, if we are to know whether or not we are living sustainably, we must measure it. In his words, sustainability "must be tied to clear and rigorous definitions, metrics, and mileage markers." If we do not define and measure it, how can we know whether or not we are closer or farther away from achieving it? These are often called metrics or indicators, and there are many of them, including levels of biodiversity, pollution levels, quality of life metrics, economic indicators, percentage access to clean water and energy, and more. Engelman mentions concentrations of carbon dioxide (CO2) in the atmosphere, which the best science indicates is very likely the major cause of global warming trends, as a very important metric. This will be addressed in more detail later in the course, but suffice to say the trend is pointing in the wrong direction, and possibly already at dangerous levels. There are many other indicators that are at a varying level of (non-)concern, some of which will be addressed later. Unfortunately, Engelman is mostly right when he writes that "the basic trends themselves remain clearly, measurably unsustainable."

5. Economics and Systems Thinking
Finally, Engelman addresses the fraught relationship between economic prosperity and sustainability, and the difficulty in satisfying both present and future needs. Ridding the world of abject poverty is at the forefront of sustainability goals, and is addressed in future lessons. But unfortunately economic growth and sustainability - particularly environmental sustainability - are often at odds. For example, increasing access to fossil fuels generally helps facilitate improving economic conditions, but causes unsustainable emissions. Even current and future sustainability can be at odds, e.g., when Engelman notes that: "Safe water may be reaching more people, but potentially at the expense of maintaining stable supplies of renewable freshwater in rivers or underground aquifers for future generations."
This all indicates the importance of systems thinking. There is a lot of literature about systems thinking, and it does not have a single definition. (If only the world of sustainability were so simple!) It can be thought of as analyzing the world around us as a collection of interrelated systems, and considering phenomena as related to other phenomena. In other words, systems thinking requires consideration of connections. There is an old saying that "the biggest cause of problems is solutions," which is important to keep in mind when analyzing sustainability issues. Examples of unintended (sustainability) consequences abound. For example:
- The so-called Green Revolution instituted in Pakistan and India in the 1960's and 1970's probably saved [70] millions, or even hundreds of millions of lives, but has also contributed to [71] soil loss, debt, and farmer suicides due to the unsustainable farming practices it uses.
- Forest fire prevention and suppression in the U.S. has led to more severe forest fires (an example of a Penn State led study [72] can be found on Penn State News, December 17, 2019).) As it turns out, low-grade forest fires naturally reduce understory fuel sources (shrubs, fallen branches, etc.), which help prevent more intense fires from occurring.
- Many invasive species were purposefully introduced by humans, only to inflict lasting damage on native plant and/or animal populations. Kudzu [73]is a vining plant that has proved to be a major menace wherever it grows in the U.S., yet was promoted first as an ornamental plant, then a tool for preventing soil erosion. Cane toads were released [74] into Australia in the 1930's in an effort to control the beetle population. Not only have they not controlled beetles, but they are now major nuisances to humans and native species and habitats.
From a sustainability perspective, systems thinking means that you should at least always a) consider the short- and long-term impacts of actions, both in space and time, and b) consider the possible causes of issues. It is unwise to address a problem or situation without thinking about the possible causes and consequences. More on this below.

The Three E's of Sustainability
The EPA offers a definition of sustainability that encompasses a lot of the concepts described above: "To pursue sustainability is to create and maintain the conditions under which humans and nature can exist in productive harmony to support present and future generations" (source: US EPA [68]). Note that this definition changed slightly in early 2017. It used to be: "Sustainability creates and maintains the conditions under which humans and nature can exist in productive harmony, that permit fulfilling the social, economic and other requirements of present and future generations." Read into that change what you will. This is a more thorough definition than the Brundtland Commission's and provides a more actionable list of goals. (Though it should be noted that there is still a lot of room for debate on how to achieve them or what they really mean.) It also brings to mind what is commonly referred to as the "three E's of sustainability."Optional Reading
Box 2.1 on pp. 7 - 8 of the document below provides a helpful primer to the three E's (3 E's). This is a chapter from The Post Carbon Reader, an edited volume by Post Carbon Institute [76]. You are welcome to read the rest of the chapter as well.
"What is Sustainability," p. 7 - 8 [77] by Dillard, Dujon, and King.
Sustainability and sustainable development are often thought of as having three core components: environment, economy, and equity. These are commonly referred to as the "3 E's" of sustainability. The 3 E's are a useful way to provide an analytical framework for sustainability. This 3E framework is useful because it provides questions that can be asked when investigating whether or not something is sustainable. While even these terms can be defined in various ways, we will use the following definitions from the reading when analyzing the sustainability implications of something:
- Is it "environmentally sustainable, or viable over the very long term"? (environment)
- Is it "economically sustainable, maintaining [and/or improving] living standards over the long term"? (economy)
- Is it "socially sustainable [and just], now and in the future"? I would add "Are the benefits and burdens shared be everyone equally?" (social equity)
As Dillard and Dujan note, if a business is attempting to address these criteria, it is often called the triple bottom line. If it meets all three criteria, and will likely continue to do so into the foreseeable future, then that is a pretty strong case for sustainability.

The details of how to maintain environmental sustainability are not without controversy, but at some point, we will have to maintain a steady-state of natural resources if we are to survive (this will be addressed later). As Engelman and others say, this may come at the expense of quality of life for some/many people now. No one said it will be easy.
But through my own personal experience and the experience of others, it is clear that social equity is the most confusing of these concepts. Dillard, Dujon, and King do a good job of outlining what it means. Contrary to what some believe, equity does not mean equal distribution of resources. There will always be inequality, whether we want it or not. What it does refer to is the fairness of opportunity and access to resources like education, health care, a clean environment, political participation, social standing, food, shelter, and others. In a socially equitable society, everyone has reasonable access to things that provide a good quality of life. Social equity is about equality of opportunity. Whether or not they take advantage of this opportunity is another story. There is an important difference between being uneducated because of laziness and because of a lack of access to good schools. Making this happen is easier said than done, but the distinction is important to make.
One reason that addressing equity can be controversial is illustrated in the image below. What do you think it is?
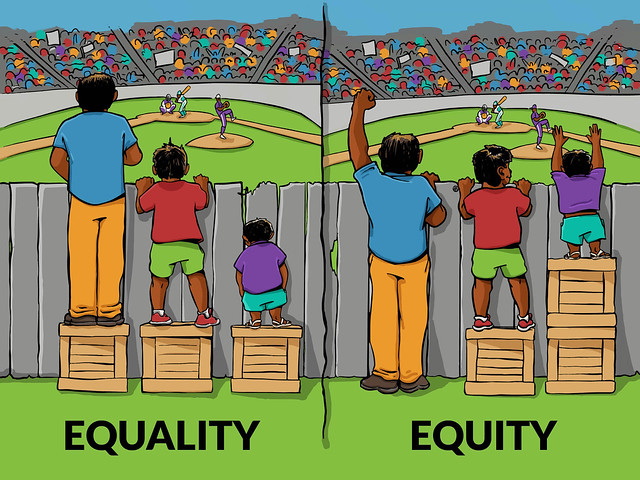
As indicated in the caption, equity often requires providing more resources to those that are at some disadvantage. Why they are disadvantaged, who decides they deserve help, the amount of help they are given, and more aspects can be controversial. Which is understandable, given that individual and group circumstances are rarely black and white and oftentimes public resources such as tax dollars are involved. Generally, those that advocate for equity err on the side of "too much" equity rather than "too little."
Economy can also be a point of confusion. It is very important to keep in mind that "economy" from a 3E perspective does not refer to just having and/or making money. It refers both to engaging in actions that are economically sustainable (if businesses do not make enough money to continue, they will not be in business for long) and having enough money to provide and maintain& a reasonably high quality of life over the long term. Yes, money is often an important - if not the most important - factor in achieving a high quality of life, particularly at lower income levels. But please keep in mind as we move forward that, from a sustainability perspective, the true "economic" goal is quality of life, not high income. Money often does contribute to a high(er) quality of life, but not always, as we will see later. Money is a means to an end. For sustainability purposes, that economic "end" is providing adequate living standards for people now and in the future. (After all, if you are incredibly happy, healthy, safe, and have everything you need, does it matter if you do not have a lot of money? More on this later.)
Food for Thought
Engelman's chapter brings up some very tough questions that (probably) need to be answered if we are going to achieve a sustainable world. I would like you to think about these moving forward this semester:
- Is there any way to know how much sacrifice is needed now to allow for future generations' quality of life?
- How can considerations for future generations be successfully integrated into today's actions?
- Is there a way to account for this economically? If so, what kind of controversies would it cause?
Optional (But Strongly Suggested)
Now that you have completed the content, I suggest going through the Learning Objectives Self-Check list at the top of the page.
Energy, Sustainability, and Society
Learning Objectives Self-Check
Read through the following statements/questions. You should be able to answer all of these after reading through the content on this page. After going through the content, check the boxes next to the questions/statements that you feel at least somewhat confident answering. I suggest writing or typing out your answers, but if nothing else, say them out loud to yourself. This is to help you reflect on important content, and will help you prepare for this week's quiz. It will also help lay the foundation for future course content.
It may be helpful to summarize some of the key points from the previous page (though more will be addressed in this week's homework questions):
- Sustainability/sustainable development has no single definition, but the most commonly cited one is by the Brundtland Commission ("meeting the needs of the current generation without compromising the ability of future generations to meet their needs").
- We must consider quality of life when addressing sustainability and may need to make some sacrifices to achieve abroad-based quality of life.
- We must utilize systems thinking when addressing sustainability problems, recognizing that actions taken will likely have far-reaching consequences.
- If we are to achieve sustainability, we must at least consider the environmental, economic, and social equity impacts on current and future generations.
- In order to know how well we are achieving sustainability, we must find a way to measure it or at least find ways to know if things are (not) going well.
Sustainability is some heavy, complex stuff! Most would argue that the future of civilization depends on how we address sustainability, starting yesterday <raising hand>. As Asher Miller phrases it in his introduction to The Post Carbon Reader [80], "The success or failure of the human experiment may well be judged by how we manage the next ten to twenty years" (p. xv). (For better or worse, and unfortunately I'd say "worse," that was written about 10 years ago.) Sustainability is a very important topic, but it is an even more complex and broad topic than energy. I don't expect you to be an expert (yet), but I hope that this course helps you think critically about sustainability-related and other claims.
Energy, Sustainability, and Society
I have a challenge for you: think of something that you did in the past week that did not involve energy.
Okay, so that's not really a fair challenge. Everything we do, even thinking about things that we might do, require energy. Here's a more reasonable challenge: think of something that you did in the past week that did not involve the use of non-renewable energy.
Any food you eat almost certainly required non-renewable energy. There are obvious connections like farm machinery, artificial fertilizers, and herbicides, transporting food, refrigerating food, cooking food, and packaging food. But even if you grow your own [81], you likely used a tool or fencing that was manufactured using non-renewables, seeds that were processed and shipped with fossil fuel-using machines, packaging that was made using non-renewable energy, or maybe even plastic row markers made with petroleum-based plastics. Almost all transportation uses non-renewables, most businesses run on non-renewable energy sources (either directly or indirectly through electricity generation), almost all of the products you buy contain materials either made of or that are processed with fossil fuels. The electronic device you are looking at right now is partially made of and manufactured using fossil fuels. In short, modern society is very dependent upon access to non-renewable energy, particularly fossil fuels. As Asher Miller notes in The Post Carbon Reader:
Look around and you'll see that the very fabric of our lives - where we live, what we eat, how we move, what we buy, what we do, and what we value - was woven with cheap, abundant energy. (p. xiv)
Watch the video below for an interesting 5-minute journey through the last 300 years of fossil fuels in society.
It all started with a big bang. Wait, we don't have to go back that far. The earth was formed 4.5 billion years ago. No, still too far. Try this. It's the middle ages. People in Britain run out of firewood. They start burning coal, but they use up the coal on the ground. Miners dig deep, Coal mines fill with water. Samuel Newcomen invents a coal-burning steam engine to pump out water so miners can keep digging. James Watt makes it practical for other uses. Now we have ingredients for the industrial revolution. Fossil fuels and a way to put them to work. All hell breaks loose. Coal miners bog down lugging coal. Rails make it easier rails and with steam engines combined make a railroad. Michael Faraday makes the first electric motor. Nicola Tesla invents alternating current. Soon, utility companies start burning coal to generate electricity. Meanwhile, Edwin Drake drills the first rock oil well in Pennsylvania and Gottlieb Daimler builds an automobile running on petroleum. Coal tar and oil are turned into industrial chemicals and pharmaceuticals that prolong life. More population growth. The Wright brothers start oil fueled Aviation. Fritz Haber and Carl Bosch make fertilizer from fossil fuels. Fertilizer and oil-powered tractors expand food production, feeding more people. World War One is the first fossil fueled conflict. Then comes World War Two, giving us guided missiles and atom bombs. In between is a great depression partly caused by overproduction. Powered assembly lines make products faster than people need them. Advertising executives invent consumerism to soak up overproduction. It's the 1950s. Advertisers use television to hook new generations of consumers. In the 70s, there's an oil shock. Everyone's shocked to realize how dependent they are on oil. With the energy crisis, the environmental movement is born. But oil prices fall, and everyone forgets energy shortages. There's a showdown between market and planned economies. Market wins. Goodbye evil Soviet empire. Politicians decide the market will solve everything. Personal computers arrive.
Globalization takes over when the market notices labor is cheaper in China. Suddenly everyone has a cell phone, but world oil production stalls out. China's now burning half the world's coal to make export products, but where will China get more coal and oil to fuel more growth? Environmental problems everywhere. Rising CO2 levels lead to record heat waves, floods, droughts. Oceans acidify. Topsoil erodes by 25 billion tons a year from industrial agriculture. Ancient forests disappear. Species go extinct at a thousand times normal rates. Freshwater is scarce or polluted. Oil companies drill in miles of sea water because the easy oil is gone, but a deep water oil platform explodes and fouls the Gulf of Mexico. Manufacturing moves to polluting countries where labor is cheap, while the U.S. becomes a casino. The financial sector is forty percent of the economy. But wall street is over leveraged. Banks fail, unemployment soars, credit evaporates. The economy is on the verge of collapse! Okay. Present time. It's amazing how far we've come in 200 years. Just three human lifetimes from the beginning of industrialism until now. But where are we headed? We can't keep doubling human population. We can't keep dumping carbon in the atmosphere. We can't keep ruining topsoil. We can't keep growing population and consumption or basing our economy on depleting fossil fuels. We can't just print more money to solve the debt crisis. It's been an exhilarating ride but there are limits. Now, it's not the end of the world, but we have to do four things fast: Learn to live without fossil fuels. Adapt to the end of economic growth as we've known it. Support seven billion humans and stabilize population at a sustainable level. And deal with our legacy of environmental destruction. In short, we have to live within nature's budget of renewable resources at rates of natural replenishment. Can we do it? We have no choice. Alternative energy sources are important, but none can fully replace fossil fuels in the time we have. Also, we've designed and built our infrastructure for transport, electricity, and farming to suit oil, coal, and gas. Changing to different energy sources will require us to redesign cities, manufacturing processes, health care and more. We'll also have to rethink some of our cultural values. None of our global problems can be tackled in isolation, and many cannot be fully solved. We'll have to prepare for business as unusual. Our best goal is resilience: The ability to absorb shocks and keep going. If we do nothing we still get to a post carbon future, but it will be bleak. However, if we plan the transition we can have a world that supports robust communities of healthy creative people and ecosystems with millions of other species. One way or the other we are in for the ride of a lifetime. Understand the issues and pitch in. It's all hands on deck!
The charts below provide rather dramatic evidence of how important non-renewable energy is to the U.S. All charts are from the EIA's Annual Energy Outlook (AEO) series, which are published on a yearly basis. I have provided a series of charts to provide some indication of how difficult it is to predict future trends. But, these serve as official (and generally pretty accurate) guides to future energy use.
The first chart is from the 2015 version of the AEO. Though a bit outdated, I put it here because the chart style makes it very easy to see the dominance of non-renewable energy sources. The second chart is from a more recent report (2019) that has total energy consumption, and the third from the most recent (2022) report. The second and third charts are obviously more recent, but is not quite as easy to interpret. Another nice feature of these charts is that they include both historical use and projected future use.
Any way you slice it, the charts make clear that non-renewable energy - particularly fossil fuels - have played and will continue to play a dominant role in society. At this point, our society simply cannot function at its current capacity without them.
Another aspect worth noting is that aside from recessions (e.g., early 1980's and 2007-8), energy use continues to increase over time. Despite consistent increases in energy efficiency, the U.S. can't seem to level off, never mind reduce overall consumption. This is also something that will have to be addressed if we are going to have a sustainable energy future.
Finally, Figure 1.15 shows which energy sources are most responsible for carbon dioxide emissions in the U.S. Oil i the current leader, but as more and more natural gas is used (particularly to generate electricity), it will likely come close to catching up to oil-based emissions by 2050, according to the EIA.
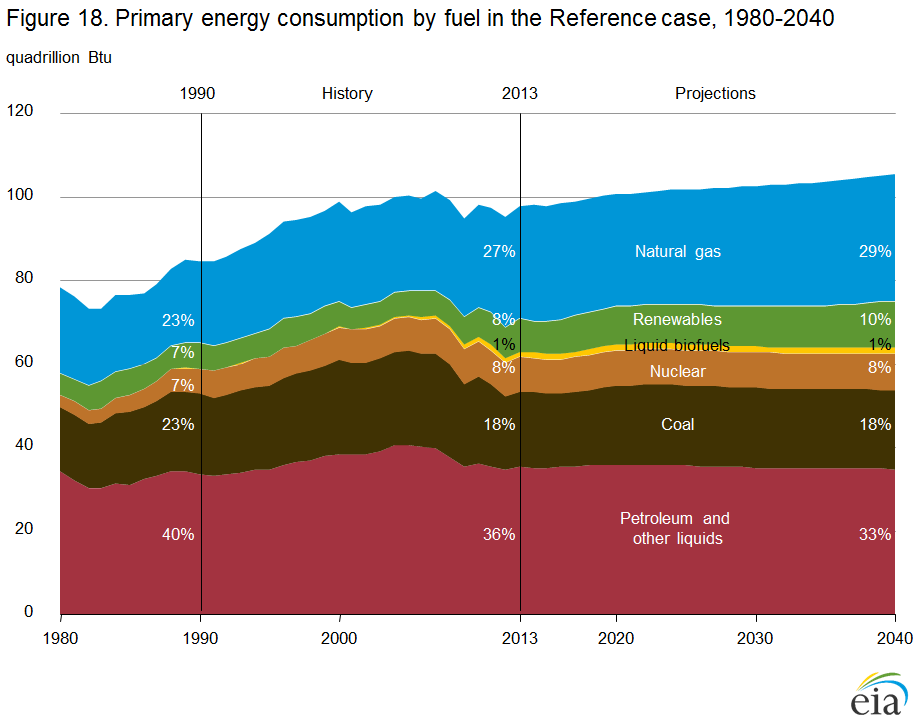

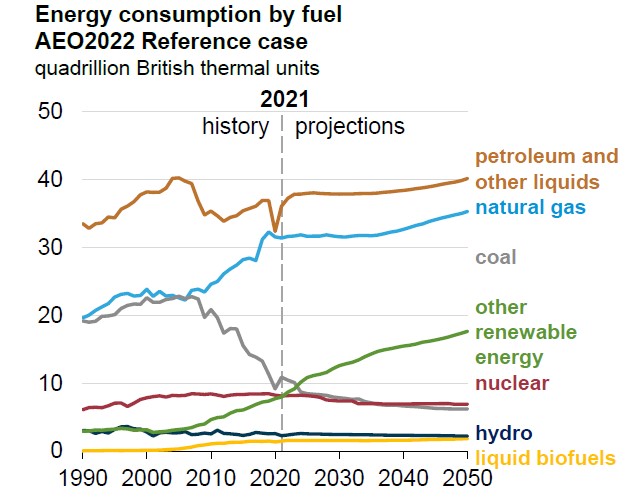


Non-renewable energy is extremely useful - it has played an essential role in human society developing to the point that it has. It is energy dense, generally easy to transport and control, and is used for a variety of purposes. Non-renewable energy will continue to play a starring role, for at least the short term future. I enjoy the freedom of the open road in my car [88]. I like to have a house in which I have some control over the temperature and humidity. I like to buy new things from time to time. I enjoy the occasional air travel. I eat food that was shipped from countries on the other side of the world. If we are all to enjoy such things (and more) in the way society and our economy is currently structured, we need access at least to fossil fuels. But given our understanding of the nature of sustainability and non-renewable energy, this cannot go on forever. In fact, it will probably need to change dramatically within the next 10-15 years.
If nothing else, since non-renewable energy is finite, we will reach limits at some point in the future - exactly when is open to debate. But even before that eventuality, it is becoming apparent that the results of unsustainable energy (and resource) use is making it difficult for current generations to meet their needs, never mind future generations. The topics in the next lessons illustrate some of the reasons that scientists and others are worried about the sustainability of our society, some of which are directly related to energy, others not.
Food for Thought
Richard Heinberg mentions four things that must be done to achieve a sustainable society with an adequate quality of life. Think about how difficult each of these is. Which do you think is the most difficult to achieve? Do you think they are even feasible? Can you envision a society that achieves these, and if so, is it good or bad? I don't have the answers (I wish I did!), but I think they are important questions to ask. Heinberg is not alone in thinking these are important.
- "Learn to live without fossil fuels"
- "Adapt to the end of economic growth as we’ve known it"
- "Support 7 billion humans and stabilize population"
- "Deal with our legacy of environmental destruction"
Optional (But Strongly Suggested)
Now that you have completed the content, I suggest going through the Learning Objectives Self-Check list at the top of the page.
Summary and Final Tasks
All right, that does it for the content for this week. Before you relax, make sure you complete the assignments listed at the beginning of this lesson.
This week, we went over some of the core considerations for energy and sustainability.
You should be able to do the following. The Lesson 1 quiz will help you solidify these skills:
- define energy, energy efficiency, and the First Law of Thermodynamics;
- identify and describe types of energy and energy conversions:
- identify and define fossil fuels, non-renewable energy sources, and renewable energy sources, and their origins and characteristics;
- analyze the energy data provided in charts and graphs;
- identify reliable sources of energy data;
- evaluate the implications of sustainability definitions; and
- define the "3 E's" of sustainability and use the 3E framework to evaluate the sustainability of given actions.
The Language of Energy and Sustainability
At the end of each lesson, I will provide a list of all of the key terms from the lesson. These terms are easy to find because most of them are in bold throughout the lesson, or appear in headings. This is designed to help you review the content, both before you take the quiz, and later. Many of these terms will be used in other parts of the course, in future courses in the Energy and Sustainability Policy curriculum, and in the sustainability and energy literature. They are mostly listed in the order they appear in the text.
- Energy, work
- Kinetic energy, potential energy, electromagnetic energy, sound energy, radiant energy, mechanical energy, electrical energy, chemical energy, gravitational energy, nuclear energy, thermal energy, First Law of Thermodynamics
- Coal, oil, natural gas, nuclear, fossil fuels, hydrocarbons
- British Thermal Unit, Btu, Joule, kilowatt hour (kWh), 100 cubic feet (ccf), quads, national labs, energy sources, end-use sectors, Sankey diagram
- Energy efficiency, Second Law of Thermodynamics, the "fifth fuel"
- Renewable energy, non-renewable energy, solar photovoltaics, wind turbines, hydropower, biomass, biofuels, primary energy, carbon free, carbon neutral
- Energy Information Administration (EIA), International Energy Agency (IEA)
- Sustainability, sustainable development, Brundtland Commission, ecocentric, anthropocentric, 3 E's, environment, intergenerational equity, equity, economy, triple bottom line, sustainability indicators/metrics
Time for the Lesson 1 Quiz!
This quiz is based on the material this week. Unless otherwise indicated, all of the answers to the quiz questions are in the required readings, videos, and website text from this week. You have unlimited time to take this quiz, but it must be completed by the due date to receive credit. You get one try. Refer to one of the course calendars for due date. Note that you can start the quiz and save your progress, and pick up where you left off later. The quiz answers automatically save as you complete the quiz, and if you stop taking it you will pick up right where you left off if you start again. If the quiz is partially completed, it will automatically submit at the due date/time if you do not submit it yourself. Please note that students in the past have had some issues saving and resuming with Internet Explorer. I suggest using Firefox or Google Chrome. To take the quiz:
- Go to the Modules tab.
- Locate the Lesson 1 Module.
- Click on Lesson 1 Content Quiz.
- Begin!
- When you are done, click "Submit." You cannot undo a submission once it is submitted.
Don't forget to start commenting on the Yellowdig discussion board!
Lesson 2: Fundamental Sustainability Considerations
Overview
The material in this lesson covers many of the fundamental considerations in sustainability. All sustainability topics are related in some way, but the topics addressed in this lesson are either integrated into many other topics, or are overarching issues that many other topics are a part of. These concepts are important to understand if you want to analyze specific issues such as water sustainability, energy sustainability, and others (those are addressed in Lesson 3), or to understand sustainability holistically.
Lesson Objectives
By the end of this lesson, you should be able to:
- differentiate between positive externalities, negative externalities, and non-external impacts;
- explain how externalities impact sustainability;
- analyze the impact of the social cost of carbon on economic decisions;
- identify elements of ecological footprint;
- compare the impacts of various lifestyle choices on ecological footprint;
- analyze how ecological footprint relates to sustainability;
- differentiate between different quality of life metrics;
- differentiate between energy return on energy invested (EROI), embodied energy, and net energy;
- examine benefits and limitations of EROI values;
- characterize the difference between growth and development;
- define steady state economy;
- analyze how establishing a steady state economy can impact sustainability;
- identify approaches to achieving a steady state economy;
- explain how Gross Domestic Product relates to development;
- identify the relationship between sustainability and various quality of life metrics;
- theorize what factors lead to a high quality of life;
- define social and environmental justice; and
- identify examples of social and environmental injustice.
What is due this week?
Please note that the quiz can only be taken once. You have unlimited time to complete it prior to the deadline and can save your progress and pick up where you left off at a later time. See the Assignments and Grading section of the syllabus [1] for tips on how to do this. Once you submit the quiz, you cannot change answers. All saved answers will automatically be submitted at the deadline if you have not submitted them.
| Requirement | Submission Location |
|---|---|
| Lesson 2 Quiz | Modules tab > Lesson 2 |
| Continue posting to the Yellowdig discussion board. | Modules tab > Lesson 2 |
| OPTIONAL Extra Credit: Lesson 2 Extra Credit quiz | Modules tab > Lesson 2 |
Questions?
If you have any general course questions, please post them to our HAVE A QUESTION? discussion forum located under the Discussions tab. I will check that discussion forum regularly to respond as appropriate. While you are there, feel free to post your own responses and comments if you are able to help out a classmate. If you have a question but would like to remain anonymous to the other students, email me.
If you have something related to the material that you'd like to share, feel free to post to the Coffee Shop forum, also under the Discussions tab.
Externalities
Learning Objectives Self-Check
Read through the following statements/questions. You should be able to answer all of these after reading through the content on this page. I suggest writing or typing out your answers, but if nothing else, say them out loud to yourself.
Economics 101
Think about the last time you spent money on something or considered spending money on something, even if it was something small and seemingly inconsequential. Then I want you to think about why you made the decision you did. Did you spend the money or not? What was your motivation? What factor(s) did you take into consideration? I’ll do the same.
As I write this, the last thing I thought about spending money on was a small table at a used furniture store (true story). I have been needing (okay, wanting) a small table for my front porch for a little while now. I thought this table looked nice and was kind of unique. I also liked that is was a used item, and the purchase supported a non-profit organization. I considered the fact that I was on my way somewhere else and had my dog in the car and had to be able to fit the table in the car without crowding the dog too much or making it dangerous for him to be in the car. I also considered whether or not the rest of my family would like it, in particular, my wife. Of course, I also considered how much money it would cost ($10). After taking all of this into consideration, I purchased the table.
Not the most interesting story [89], I know. But this is a small illustration of the fundamental theory behind the system of economics that we’ve been using for the past 150+ years. Namely, that people make purchases based on weighing the personal costs and benefits given the information they have available to them. In a perfect world, consumers know everything about a product, the benefits they will receive from it, and how it compares to similar products. (This is generally not a reasonable set of assumptions, but that’s another story that we will address later in this course.) All of these combined add up to the private benefit - which economists call the private utility, or simply utility - of the good. They also consider the private cost, which includes at least the price, but could also include other factors such as inconvenience. This process would appear to most people to simply be common sense, and most likely this system of thought is what led you to buy or not buy whatever it is you were considering in the thought experiment above.
There is another side to this transaction. Whoever offered to sell you the good almost certainly decided on a price based at least on how they could maximize their profit (or at least make a profit). Again, this makes sense and is how most businesses run. There is a balancing act between what consumers want, what the "going price" is, how much it costs the business to procure and sell it, and so forth. Nothing wrong with being motivated at least in part by profit – if a business does not make money, they will not be in business for very long, after all! The merchant from whom I purchased the table was able to offer a very low price because the item was donated, the business was partially staffed by volunteers, it gets tax breaks from being a non-profit, and so forth.
You’re probably wondering if there is a point to all of this. Well, can you think of anything missing from this equation? Are there any costs or benefits missing from this decision-making process? Think about it, then hold that thought and watch the video below. You are required to watch the first 3:20 of the video (intro and negative externalities), as well as 5:06 - 6:22 (positive externalities). A summary of the key points can be found below. The rest of the video is optional.
Externalities occur when costs or benefits accrue to a person, or persons, who are not involved in the decision-making process. Note that externalities can involve either third-party costs (this would be a negative externality) or third-party benefits (this would be a positive externality). Let's address each of these in turn.
Negative externalities occur when a decision or activity imposes costs on anyone not involved in making that decision. Think of it this way: every decision involves some cost to the decision-maker; that's the private cost of your choice. But sometimes the decision imposes costs on others as well, which would be the external cost. Social cost, then, is the total cost to all members of society, or the sum of the cost to the decision-maker (which is private cost), and to others (external cost). What this means is that if a decision imposes any kind of external cost, then the social cost will exceed the private cost.
Think about this: do you think that too many people use their cell phones while driving, or too few? Well, why do you think that is? The answer lies with this notion of externalities. Look at it this way: when you're deciding whether or not to get on your cell phone while you're driving, what are the private costs, i.e., the costs to you, the decision-maker? Perhaps the cost of buying a cell phone in the first place? Or maybe the minutes you'll be using, or the cost of sending a message? It might even occur to you that you're increasing the likelihood of you getting into an accident. Now, are there any costs to other people, people who have no control over your decision to use your phone while behind the wheel? What about the increased risks to them? Or even just the annoyance of you driving like an idiot because you're on the phone? These are the external costs or the costs you impose on others with your behavior.
In the end, this discrepancy between the cost to you and the cost to society (which is the sum of the private and the external cost) leads to overproduction, if you will, of people driving while on their cell phones. Why? Because we’re all rational decision-makers – using the cost to us and the benefits to us to make our decisions. Very rarely do you find someone who includes costs to others when weighing a private decision. Essentially, you make the decision to be on the phone while driving because you consider only part of the cost - the cost to you. With negative externalities, because the private decision is based on costs that are too low, from society’s standpoint, the behaviors, or products, are overproduced from society's view.
This market failure provides a role for the government to correct the market, i.e., bring the production back to the socially optimal level. In the case of cell phones, this is most often done by putting laws in place that ban such behavior while driving and have hefty fines attached if you're caught. This effectively raises the cost of engaging in such behavior, and thus decreases the amount of the behavior that occurs. The same idea would apply to, say, a steel factory. There's a certain private cost of producing steel (I’ll assume that on the benefit or demand-side, private and social are the same for now), but the production of steel also results in pollution, a cost to others in society. This means that the marginal social cost is greater than the marginal private cost. Left to its own devices, the steel market will be based on private costs and private benefits, yielding the price and quantity associated with equilibrium E1. What would society rather see? The socially optimal outcome would be based on social cost and social benefits, or equilibrium E2. Notice, this means society would like to see less production, meaning less pollution, and would be willing to pay a higher price to do so.
This is where the government comes in.
What is the government solution to a negative externality? Simple! Get the decision-maker to internalize the external effect. Since the problem arises from the decision-maker using costs that are too low, you need to somehow impose some additional cost, so the decision becomes based on level of social cost. This could be done by way of taxes, fines, regulation or cleanup fees. Or, in the case of pollution, there’s now a market for credits that allow you to pollute. If you're clean producer, you’ll have unused credits you can sell which is an incentive for cleaner production. If you create a lot of pollution, you’ll need to acquire extra credits to continue producing, which is also an incentive to cut back on pollution production.
What about positive externalities? Just as you can make choices that impose costs on others, you can also make choices that result in benefits to others. If this is the case, then social benefits equal the private benefits, or benefits to the decision-maker, plus external benefits, or benefits to others. In the case of a positive externality, social benefits exceed the private benefits. Take education, for example. YOU decided to continue your education; why is that? What are the benefits to you of making this decision? It might just be the love of learning, or because you know that education means a better, higher-paying job in the future. But what about society? Society as a whole benefits from having a better-educated populace; highly educated, highly-skilled workers tend to be innovators, which helps keep our economy moving forward. All of this is good except for the fact that, in a free market, education will be underproduced -- this is true of any positive externality.
Why? Because the private decision-maker doesn't see the full benefit of education that society sees, so not as much education is produced. For the consumer of education, there's a certain private benefit (I’ll assume private cost and social cost are going to be the same). Decision-making based solely on private costs and benefits results in equilibrium at E1. Society as a whole sees a greater benefit; if the equilibrium were based on social costs and social benefits, equilibrium would occur at E2. Society desires a greater level of education, and is willing to pay more to achieve it. From a social standpoint, in a free-market, education will be underproduced. What's the government solution to a positive externality? Well, get the decision-maker to internalize the external effect. Sounds familiar, doesn't it? Except that with the negative externality, we had to try to get the decision-maker to see higher costs; with a positive externality, the government needs to somehow make the decision more beneficial to the private decision-maker. In the case of education, the government may provide grant money, low-interest loans, or tax credits in order to provide added incentive to get more education.
To Read Now
Please also read this very short reading from the Organization for Economic Co-operation and Development (OECD). The OECD [92]is an organization with representatives from 36 of the wealthier countries in the world [93], but also with some lower-income countries. You may see the term “OECD countries” in future courses and elsewhere, so this is useful to know. The OECD is also a good source of information and data.
- Externalities [94], by OECD
Externalities
The OECD offers a reasonably good, concise definition of externalities:
Externalities refers to situations when the effect of production or consumption of goods and services imposes costs or benefits on others which are not reflected in the prices charged for the goods and services being provided
As noted in the video, there are usually external costs and/or external benefits to transactions. External costs and benefits are borne by people or other entities that had no input on the transaction and were not fully included in the price. A negative externality occurs when an external cost occurs, and a positive externality occurs when an external benefit occurs.
Pollution is a classic example of a negative externality, as noted in the reading (and later in the video). Most pollution - particularly air pollution - is emitted without the emitter paying for any negative consequences of the pollution. These costs could be in the form of respiratory problems caused by power plant particulates, loss of beautiful vistas because of smog from car exhaust, the climate change impact of carbon dioxide from a home furnace, or any number of problems. The reading from the OECD notes that roads may have positive externalities (making it easier to get to work or school, etc.), but keep in mind that they usually have some negative externalities as well, such as air pollution, noise pollution, possibly extra traffic, and more. The point is that many of these costs and benefits happen to actors that were not involved in the decision to emit the pollutants, but that they were not compensated for (or did not have to pay for them, in the case of benefits), and were not included in the price of the good (e.g., the cost to build the road), thus making them externalities.
Dr. Paul M. Johnson of Auburn University provides a little more specificity [95] to this definition:
An externality is "a situation in which the private costs or benefits to the producers or purchasers of a good or service differs from the total social costs or benefits entailed in its production and consumption."
The narrator in the video also points this out when she says that a negative externality occurs when social cost exceeds private cost, and a positive externality occurs when the social benefit exceeds the private benefit. If an external cost is incurred by someone outside of the transaction, and that cost is fully integrated into the cost of the product, then by definition no positive or negative externality occurs. (Note that it is nearly, if not completely, impossible to fully integrate all costs and benefits into an action. But if they could be integrated, some economists still consider them externalities because they are "external" to the transaction. They would just be neither positive nor negative.)
Air pollution from a factory is considered an externality because certain costs to others that may be incurred - such as people getting sick from the pollution and missing work and paying for doctor's bills - are not paid by the factory. Even if the factory owner gets a small fine, if that fine is less than the external cost, then it is still an externality. It's difficult to imagine an external benefit to air pollution, but maybe there are people out there that enjoy asthma attacks and diminished lung capacity. (Who am I to judge?) If a state builds a road, neither all of the negative (e.g., noise and air pollution) nor the positive (e.g., decreased commute time, increased economic activity) are fully integrated into the cost of the road, and externalities abound.
Good to Know: Externalities without a Price
Economists tend to think of externalities in dollars and cents, even if an externality does not have a direct cost. For example, let's say I play in an outdoor basketball league. I love playing basketball, but don't get a direct monetary benefit from it. What if air pollution fouls the air and makes it impossible for me to play basketball? What is the externality in dollars and cents?
In order to figure this out, my "Willingness to Pay" (WTP) would have to be determined. If it were just my teammates and me, they would ask us something to the effect of: "How much would you be willing to pay to play basketball tonight?" Of course, if you scale this up and want to know how much 1,000 people or 10,000 people would be willing to pay, you would need to perform statistical analysis. You could do the same thing for many externalities, such as political freedom, beautiful views, safe neighborhoods, etc. At any rate, it is not necessary for our purposes to always think of externalities in financial terms, but it would be if we wanted to figure out the true cost of transactions. Here is one study [96] that analyzes Willingness to Pay for environmental externalities in Spain. (Full disclosure: This is a random study that I found through a Google search. But it is a peer-reviewed study, so is legitimate research.)
Back to my table. Can you think of any externalities that may have resulted from it? It is probable that the steel, which is mostly iron [97], was mined somewhere. There may have been some chemical runoff from the mine that affected local people or wildlife. Manufacturing steel requires a lot of energy, usually from coal. This causes emissions, including carbon dioxide, that can affect local people and wildlife, and likely contributing to climate change. Even if there is a small effect on climate change, it is still an externality. Perhaps the coal mine acidified the local water supply, compromising the local fish supply. The table was probably shipped somewhere, which would have caused emissions. There are more, but you get the point. It is very important to remember that for purposes of this course, these costs are negative externalities if they are not fully integrated into the cost of making, and therefore buying the product. For example, if the company that mined the steel paid a fine equivalent to the damage from the pollution, then it was likely included in the cost. That is possible, though unlikely. If nothing else, the emissions that resulted from this whole process are almost certainly not integrated into the cost (more on this later), and so there are some externalities involved.
There are likely positive externalities as well. Perhaps the iron mining company brought jobs to the local economy, and the people earning wages spent the money on other businesses. These other businesses indirectly benefited from the mining of the iron. Perhaps the mining company built some local roads that facilitated business and allowed people to more easily visit family. Closer to home, my beautiful table is sitting on my front porch and makes my neighbors happy when they see it (I might have made that up), which is a positive externality. But if it makes them jealous, that is a negative externality (also not likely).

One more thing: As mentioned in the video, goods/actions with negative externalities are usually overproduced. This means that more of it is produced/done than is socially optimal. In other words, if there were no externalities, every impact would be reflected in the price, and less of the good/action would happen because it would be more expensive than it would be otherwise. For example, if all of the negative impacts from pollution were added to the cost of generating the pollution, then it would be more expensive to pollute, and less of it would occur. Conversely, things with positive externalities tend to be underproduced. An example of each follows:
- If the producer of the steel for the table was forced to pay the external costs associated with pollution, then the cost to manufacture them would go up and they would probably sell fewer tables. But, if they do not have to pay the external costs, they could produce and sell more, because they would be cheaper. Thus, the table is overproduced (more are made than is best for society) if external costs are not accounted for. In short, society is forced to endure these external costs because they are essentially free to the steel producer.
- Education is the classic example of an underproduced good. There are many societal benefits to having an educated populace - lower crime rates, better economic competitiveness, more innovation, etc. (The External Benefits of Education [98] is one study that provides a description of these and more.) Often, these benefits are not fully included in the cost of education. If all of these benefits were included in the cost, the cost of education would be lower than it is, and more people would pursue it. Thus, less education is provided than would be best for society.
Good to Know: The True Cost of Fossil Fuel Combustion
The climate benefits of reducing fossil fuel combustion are essential sustainability considerations. However, there are many other negative externalities associated with fossil fuel use. There is increasing awareness of the negative health impacts of fossil fuel use, in particular due to PM 2.5 (particulate matter less than 2.5 microns in diameter) because they are small enough to get into lung sacs and even the bloodstream. The following are examples of recent research related to this. These are negative externalities because the costs are not included in the price of fossil fuels:
- "...researchers from Harvard University and the Universities of Birmingham and Leicester in the U.K., found that, worldwide, 8 million premature deaths were linked to pollution from fossil fuel combustion, with 350,000 in the U.S. alone." They found impacts on rates of "cancer, heart attacks, asthma, and dementia, as well as higher death rates from COVID-19." (Source: Harvard T.H. Chan School of Public Health [99].)
- The Energy Policy Institute of Chicago estimates that air pollution "take 2.2. years off of global life expectancy." Most of this pollution comes from fossil fuels. This reduces more life expectancy than smoking, alcohol use, HIV/AIDS, and malaria. See image below for specifics. (Source: CNBC [100])
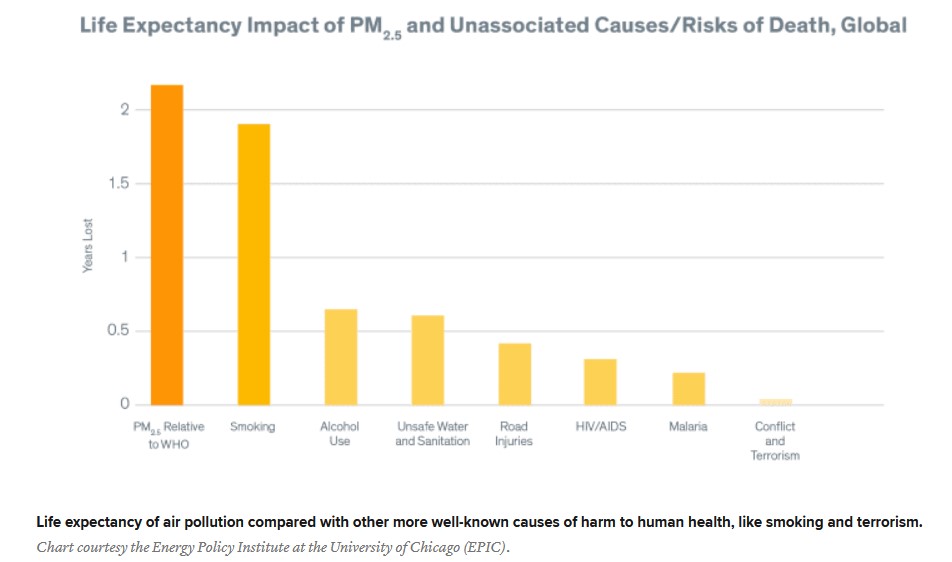
Quantifying Externalities
Hopefully, this makes sense to this point. Most, if not all, economic transactions have externalities, which may be positive or negative. These externalities may have a direct economic cost/benefit associated with them (e.g., hospital bill from an asthma attack that occurred because of car exhaust fumes [101]) or a non-economic cost/benefit (e.g., the sense of freedom I got while driving the car [88] that contributed to the asthma attack). These are real impacts on real people that are not included in the cost of the transactions that led to the externalities. You could probably list a few more externalities from driving, but that's really the easy part. Think about this for a minute: How would you go about quantifying the externalities? More specifically from the example above, how would you quantify the external costs of one gallon of gasoline burned in a car engine? How about the total external cost of generating electricity with a coal-fired power plant? Think about all of the complex calculations you would need to perform, and also how many assumptions you would have to make. Fortunately, I will not ask you to do that, because it goes well beyond the scope of this course. Also, this is actually a major avenue of research, and so numbers are available.
Suggested Reading
The reading below is a pretty well-balanced assessment of externalities from electricity generation. This reading is not required, but it will be very helpful to at least read the sections called "Indirect Subsidies" and "Conclusion."
- "On Energy Subsidies and Externalities [102]," by Schalk Cloete
There are a few important points to be gleaned from this article.
- First, he notes a few peer-reviewed studies that have been done to calculate the external cost of coal-based electricity. The Epstein et al. study he mentions is cited frequently and calculates the external cost at 9.3¢ per kWh. This is near the average price per kWh in the U.S. He mentions another study that found a range between 10.3 €cent - 28.4 €cent (€cent refers to Eurocents). These are "short-term local" externalities, meaning they are experienced directly from the emissions (e.g., sickness from pollution). Further, he notes that the latter study found that these costs can be significantly reduced by installing technologies to reduce pollution. These numbers are always controversial and require assumptions, but they are important to figure out if we are to know the true cost of energy.
- Second, that these costs may not tell the whole story. He does not disagree that those costs are real, or even that the numbers are wrong. What he does point out is that the benefits may outweigh the costs, but it depends on where you are. In countries like China and India, the short-term economic benefits from increased access to electricity are likely significantly higher than the economic costs. If there are no other energy sources available, then this is probably a valid point. But it should be noted that there are a lot of opportunities for renewable energy in both of those countries and elsewhere.
- However, all of the above does NOT account for the long-term global externalities, which mostly consists of the costs of climate change. For climate change, no legitimate study purports that the benefits outweigh the costs. We'll address this below.
- One last thing that I'd like to point out is that he intimates that the benefits of coal-based electricity in the U.S. outweigh even the short-term costs, but this assumes that the alternative (e.g., wind) are not viable. This argument should be approached with caution, because there are strong indications that the U.S. could get all (or at least most) of its electricity from renewable sources in the relatively near future, at least in certain areas of the country [103]. Many European countries are well on their way to a high percentage of renewables [104]. This, too, should be taken with caution, because a lot has to change in the next 15-20 years for all of this to happen, but it is technologically feasible. Plus, natural gas is much less polluting than coal. All of this would negate the benefits of coal.
The Social Cost of Carbon
Without getting into the specifics about the causes of climate change (that will be covered in the next lesson), let's take a look at climate change as an externality. As you will see in the next lesson, if the climate continues to change, the impacts will be overwhelmingly negative. Quantifying these costs is an active area of research, but many countries - including the U.S. - have placed an "official" cost on the emission of carbon dioxide (this is used to calculate the cost of new legislation). Under the Obama administration, the U.S. federal government used a social cost of carbon (SCC) of $39 per ton [105]of carbon dioxide. (Not surprisingly, the Trump administration has proposed to lower this significantly, and the Biden Administration is proposing to increase it to $51/ton.) A 2015 study out of Stanford University [106] found that the U.S. grossly underestimated the SCC and that it should be closer to 220 dollars/ton. In 2013, major corporations integrated the cost of carbon emissions into their projects [107] (between 6 dollars and 60 dollars/ton), though they use some different considerations than SCC, and by early 2021, over 500 companies [108] worldwide had integrated SCC internally, with almost as many more planning on integrating one within the following two years.
Calculating the Social Cost of Carbon
Please note that you are not required to fully understand the calculation below, but you do need to understand how assumptions regarding SCC could impact the cost of electricity in general, as well as the implications for using natural gas vs. coal to generate electricity. This technique could be applied to anything that causes carbon dioxide emissions.
Are you wondering how much CO2 is emitted by various energy sources, so you can calculate the SCC? For example, how much would each kilowatt hour of electricity cost if the cost to society (read: externalities) were included? If you have, you've come to the right place! The carbon dioxide emissions that result from electricity generation vary significantly by energy source, so we'll start there, then apply the assumptions for actual financial cost of carbon as outlined by the two sources referred to above. Note that the information in the table below takes into consideration the average efficiency of each type of power plant (the same power plant efficiencies from Lesson 1, by the way):
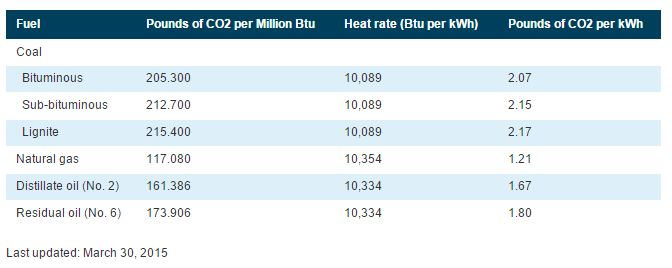
| Fuel | Pounds of CO2 per Million Btu | Heat rate (Btu per kWh) | Pounds of Co2 per kWh |
|---|---|---|---|
| Bituminous Coal | 205.300 | 10,089 | 2.07 |
| Sub-bituminous Coal | 212.700 | 10,089 | 2.15 |
| Lignite Coal | 215.400 | 10,089 | 2.17 |
| Natural Gas | 117.080 | 10,354 | 1.21 |
| Distillate Oil (No. 2) | 161.386 | 10,334 | 1.67 |
| Residual Oil (No. 6) | 173.906 | 10,334 | 1.80 |
What is the SCC of a kWh of bituminous coal vs. natural gas at different SCC rates (37 dollars/ton vs. 220 dollars/ton)? In other words, based on the number of pounds of CO2 are emitted when burning coal and natural gas, and assuming that the total cost to society of one ton of CO2 is either $37 or $220, how much more would we pay per kWh if these external costs were integrated into the price of that kWh?
As you can see, there is a huge difference in the social cost of electricity, based on the social cost of carbon assumption used. And also note that less carbon-intensive fuel sources would cost less than higher-intensity sources. (This is the basis of a carbon tax, by the way!)
The point of all of this discussion of different social costs of carbon is not that one calculation is better than the other, but that climate change is increasingly being recognized as having a real cost, but much of that cost will be borne in the future and is thus an externality. Even current external costs are largely borne by people that did not make the decision to pollute. This all, of course, ignores the noneconomic costs of climate change, which could be substantial.
Suggested Reading
Here is a summary of the Stanford study referred to above. It is very short and describes some of the rationale and science behind Social Cost of Carbon calculations.
- "Estimated social cost of climate change not accurate, Stanford scientists say [106]." Ker Than, Stanford News.
Summary
Almost everything that is bought and sold has externalities. Some are more impactful than others. Externalities – negative externalities in particular – are very important considerations in sustainability. By definition, they are not included in the cost of goods. The cost of goods drives our economy, and our economy is a (and many would argue the) dominant force in society. It’s easy to see that if the dominant force in society is not accounting for all costs to society, we might have some problems. Many of the issues discussed in this and the next lesson are the results of externalities - climate change included.
There is a lot of material on this page, so here is a summary of the key points:
- An externality is a cost or benefit of the production or consumption of a good or service that is not included in the private cost/benefit of that good or service.
- An external cost (e.g., damage from pollution) not included in the price is a negative externality. An external benefit (e.g., social benefits of education) that is not included in the price is a positive externality.
- If all external costs and/or benefits are included in the price, then most economists believe that no externality has taken place. Everyone that is impacted is properly compensated. (This is very rare!)
- Goods and services with negative externalities tend to be overproduced, meaning that more are produced than is socially optimal. This is because the private cost of the good/service is less than the total (social) cost, i.e., it is cheaper than it should be.
- Goods/services with positive externalities tend to be underproduced because the total (social) benefit is higher than the private cost, i.e., it is more expensive than it should be.
- The direct short-term external costs of energy generation can be significant, due to health problems and other issues. In other words, if external costs were included in the price of fossil fuels, they would be more expensive. However, in some emerging economies, these external costs may be overcome by the positive benefits of having more energy.
- Climate change is considered a negative externality, because the impacts of emissions are felt by people that did not cause the emissions. Most of these costs are in the future.
- The social cost of carbon (SCC) is an attempt to quantify the external cost of emitting CO2. This is very difficult to do but has been quantified in terms of dollars per ton of emissions. By using dollar per ton, the cost of a kWh of electricity, gallon of gasoline, ccf of natural gas, etc. can be calculated.
- The intent of using SCC is to integrate the external cost of carbon emissions into the price of things that cause these emissions. This would make them more expensive but could more accurately reflect the true cost.
Check Your Understanding - SCC and Externalities
If the Social Cost of Carbon were included in the cost of current carbon emissions, is human-induced climate change no longer a negative externality? Would it be an externality at all?
Optional (But Strongly Suggested)
Now that you have completed the content, I suggest going through the Learning Objectives Self-Check list at the top of the page.
Ecological Footprint
Learning Objectives Self-Check
Read through the following statements/questions. You should be able to answer all of these after reading through the content on this page. I suggest writing or typing out your answers, but if nothing else, say them out loud to yourself.
Speaking of costs and benefits, in simple terms, there are two fundamental quantities a business (or individual) needs to know to determine if they are making or losing money: how much money is going into the budget (revenue) and how much is going out (expenses). If revenue exceeds expenses, then the business makes money. If costs exceed expenses, the business loses money. A business cannot lose money forever. Eventually, it will not be able to sustain itself.
The same principle applies to most natural resources in two fundamental ways:
- I think we can all agree that the earth has a limited ability to produce natural resources such as trees, fish, crops, meat, fresh water, and so forth. If we harvest resources faster than they are replenished, the populations will diminish. You've probably seen images of clear-cut forests, read about places that are running out of fresh water, and heard about crop shortages, as well as other symptoms of overuse of resources.
- The earth also has a limited capacity to absorb carbon dioxide and other wastes/emissions. We can see the immediate result of exceeding that limit because we know that the concentration of CO2 in the atmosphere is increasing. But the bottom line is that if we emit wastes faster than they can be reabsorbed, they will accumulate in the environment.
Lesson 3 provides a lot of examples of the symptoms of overuse of natural resources, but for now, I'd like you to reiterate these two following basic truths:
- When a resource has a limited capacity to be replenished, if it is harvested faster than it is replenished, it will diminish.
- When waste is emitted faster than it can be absorbed, it will accumulate in the environment.
 [110]
[110]
A chart showing global carbon dioxide increase since 1958. The line gradually increases from 315 parts per million (ppm) in 1958 to over 419 ppm in August of 2019. Seasonal fluctuations occur, but only a few ppm each year. The graph shows a steadily increasing rate from 1958 to 2021.
Just as a business that loses more money than it makes runs a deficit, when humans overuse the capacity of the earth to replenish resources, it could be said that these places are running an ecological deficit. It stands to reason that if we could figure out our planetary capacity to generate natural resources (aka our "budget" or "revenue" of natural resources) and compare it to how much of that capacity we use (aka our "costs"), we could determine if we are losing or gaining ecological capacity. Luckily for us, some people have been working on this for the last decade or so and have come up with the concept of ecological footprint.
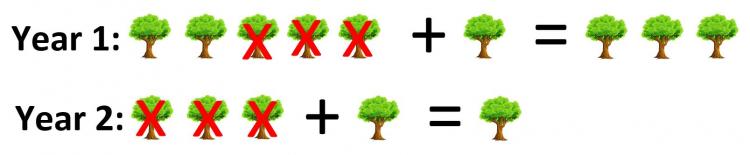
To Watch Now
Watch this short (2:58 minute) video from Mathis Wackernagel, who originated the concept of ecological footprint. He is currently Executive Director of the Global Footprint Network [113], which specializes in calculating ecological footprints.
We have been the most successful species on this planet. Two hundred years ago, nobody could have imagined the kind of lives we are living today: the cities we have been able to construct, and the technologies we have been able to create. And so, we are asking ourselves, how will we be able to maintain success in the future? Since the end of World War Two, we have more than doubled our population, and we are consuming far more per capita. In the last century alone, we are now consuming tenfold the energy that we did hundreds of years ago, and we are recognizing that the planet is getting awfully small.
If we just compare, you know, how successful we have become as a species. We as a species, together with our cows and pigs, are about 97 percent of the biomass of all vertebrate species. But only about three percent are wild species, so we have been able to dominate the whole ecosystem of the planet. Now that may be a success, but its success also had its cost: that the planet is getting awfully small. That’s why we have developed the ecological footprint to start to measure how big are we compared to the biosphere; how can we actually use our ecological assets more effectively to live well on this planet? Now the ecological footprint is a very simple tool. It's a tool like a bank statement that tells us on the one hand how many resources do we have that renew itself, thanks to the biosphere that is powered by the sun, and how many do we use, and then you can see to what extent we are actually dipping into the overall capital or to what extent we're really living within that interest that nature provides us.
If you want a real simple and effective model of how the economy operates, just take the cow. Because everything that enters the cow as food will leave again. Very similar to an economy, a cow also produces a value-added, the milk. The milk, too, whether you consume it or not, becomes waste.
So, a farmer knows how much area, how much pasture, how much cropland, and how big of a farm is necessary to maintain his or her cow herd. Now the same way we can see how much area is necessary to support me or to support our cities, to support our economies, to support the world as a whole, all humanity - to maintain all the resources we consume and to absorb the waste - that's what the ecological footprint measures for you.
Suggested Reading
For some deeper insight into ecological footprint, read Chapter 4 of Is Sustainability Still Possible?: "Getting to One-Planet Living," by Jennie Moore and William E. Rees. (See the Modules tab for a digital copy.)
"Ecological Footprints estimate the productive ecosystem area required, on a continuous basis, by any specified population to produce the renewable resources it consumes and to assimilate its (mostly carbon) wastes."
~Jennie Moore and William Rees, "Getting to One-Planet Living", p. 40
Dr. Wackernagel sums up the goal of ecological footprint analysis by asking a simple question: "How will we be able to maintain the success (of our society) in the future?" The ecological footprint is based on the recognition that humans depend on the earth's natural resources for survival, and that our "success" is predicated on the ability of the earth to replenish natural resources through time. In the simplest terms, the question we need to answer is:
- "How many resources do we have that renew itself...and how many do we use?" as Dr. Wackernegel mentions.
We only have one earth, and this one earth can only regenerate so many resources in a given year (produce food, filter water, pull carbon dioxide out of the atmosphere, etc.) - this is our stock of resources. How can we use this information to determine whether or not we are overusing natural resources? In principle, it's relatively simple: If we compare the number of resources that are provided each year by the earth (one "earth") to the amount we use (our global ecological footprint), we can determine whether or not we are living within our ecological budget.
There are many implications of this, but there are two fundamental ones:
- If our global ecological footprint is one earth or less, we are living sustainably from the perspective of ecological footprint (note that this says nothing about the quality of life of people on the planet or the survival of specific species).
- If the global ecological footprint is greater than one earth, then the stock of biocapacity will diminish over time.
If biocapacity diminishes, eventually ecosystem collapse will occur, and ultimately societal collapse as well. This is what scientists refer to as a "very bad thing."
The bad news is that according to the Global Footprint Network, humans have been living beyond their ecological means for about 40 years now, as the chart below shows. The good news is, uh <checking notes>, well unfortunately in terms of global ecological footprint, there is very little good news. Just about every country across the world has an increasing ecological footprint [114].

The Global Footprint Network (GFN) created another way to illustrate the same phenomenon by publishing the annual "Earth Overshoot Day [116]." Earth Overshoot Day indicates the date in a given year after which humanity starts using more than a sustainable level of natural resources. As the GFN puts it: Earth Overshoot Day is when "we began to use more from nature than our planet can renew in the whole year." So, an earlier Earth Overshoot Day means that we are using up our resources faster. In 2016, this happened on August 8th. Pretty sad, right? Well, unfortunately in 2017, this occurred on August 2nd, and in 2019 it was July 29th! This is not the kind of downward trend sustainability-types like yourselves want to see. For the first time since they've been keeping track, Overshoot Day moved back about four weeks (to August 22nd) in 2020, but it was at the cost of millions of deaths and countless lives ruined. And of course, it was back to July 19th in 2021.
Sustainable Yield Natural Resource Management
While humans are unfortunately overusing resources on a global scale, it is not all bad news. If the natural replenishment rate of a renewable resource is known, then it is possible to harvest them at a sustainable rate. How can this be done? I want you to think about this for a minute before moving on. (Maybe take a look at Figure 2.4 for some inspiration.)
Okay, here's the oh-so-elusive secret: If you want to maintain a supply of renewable natural resources, don't harvest them any faster than they can be naturally replenished. This practice is generally referred to as the principle of sustainable yield (you might also see it referred to as "maximum sustainable yield" or "sustained yield"). This is a pretty self-descriptive term, but Encyclopaedia Britannica provides a concise definition [117]:
Sustainable yield "can in principle be maintained indefinitely because it can be supported by the regenerative capacities of the underlying natural system."
This can in theory be done for any renewable natural resource in order to maintain a steady supply over time. This is most often thought of in forest management and fisheries management but can be applied to any resource (e.g., soil, water, animal populations, plant populations). There are numerous examples of this in practice. For example, most of Sweden's forests are harvested using sustainable yield practices, and in fact, the total amount of forest has been increasing [118] since at least the 1950s. Some forest areas under U.S. federal jurisdiction are required [119]to be managed using sustainable yield practices, and the Maine lobster industry has been maintained [120]for well over 100 years because of sustainable yield practices.
Please also keep in mind that - as indicated above - the same principle applies to emissions/pollution. If pollution is emitted faster than it can be safely absorbed, it will build up in the environment and/or cause damage to the environment. Rising CO2 levels are one example of this.

Unsustainable Forest Management: Illustration showing that if you cut 3 out of 5 trees down and 1 grows back, you have 3 trees left, then if you cut 3 more down and 1 grows back, you have 1 left.
Sustained Yield Forest Management: Illustration showing that if you cut down 1 of 5 trees and 1 grows back, you have 5 trees left. Then, if you cut down one more and 1 grows back, you still have 5 trees left.
It is very important to note a few caveats regarding sustained/sustainable yield management:
- It can be very difficult to determine exactly how much of a resource is regenerated in a given time period. It is particularly difficult for large, dispersed resources such as fish and wild animals.
- Even if the rate of replenishment is known, it can be very difficult to make sure everyone respects that limit. Again, open ocean fishing is a good example of this because there are thousands of fishing boats spread across the world, and not one single entity oversees them.
- Even if a given resource is harvested at a sustainable rate, there may be other problems associated with that harvest. For example, industrial fishing operations - whether or not they take out too many fish - often cause incredible damage [121] to wildlife and the ocean bottom. Here is a paper [122] that describes some of these issues in fisheries management.
Overshoot and Collapse
How much longer can we continue to live beyond our ecological means? Unfortunately, there is no way to know. As Moore and Rees put it in the optional reading: "System collapse is a complicated process...We may actually pass through a tipping point unaware because nothing much happens at first" (p. 41). There is a phenomenon, most often used in biology/ecology, called overshoot and collapse that can help us understand some of the risks involved with overusing renewable resources and passing through such "tipping points."
To Read Now
This short article describes the well-documented example of overshoot and collapse on St. Matthew Island in Alaska. The rest of the article describes how this may be an analogy for humans, specifically with regard to energy. It is good food for thought.
- St. Matthew Island - Overshoot & Collapse [123], Ned Rozell, and Dan Chay, writing for resilience.org. (By the way, resilience.org is a great website for sustainability-focused articles in a variety of fields.)
Overshoot and collapse can occur when there is insufficient immediate or short-term feedback to prevent an organism from acting against its own self-interest. If widespread human suffering occurred because of ecological overuse and it could be proven that resource overuse was the cause, it is likely that we would try to do something about it.
Of course, suffering is happening now, some of which is due to resource scarcity, but apparently not enough for us to address it. Regardless, it is possible to use more than our allotted biocapacity and survive, at least for a while. What's scary is that no one knows exactly how long we can keep using resources at this rate without reaching a tipping point. It may be 10 years, maybe 20 years, maybe even 50 years (very unlikely). It depends on a lot of factors, but one of the main problems is that by the time we realize collapse is occurring, it may already be too late to do anything about it. That is the "collapse" part of "overshoot and collapse." On St. Matthew Island, by the time the deer started running out of lichen to eat, it was too late. Humans are of course much more resourceful than reindeer (one would hope so, anyway), but there are likely tipping points that are points of no return. Chief among these are climate change and biodiversity loss, which will both be addressed in future lessons.
Check Your Understanding - Ecological Footprint
If the people in a country have a bigger ecological footprint than the physical size of the country, how can they continue to survive? For example, according to Global Footprint Network data (from overshootday.org [124]):
- The people of the U.S. collectively need an area more than twice the area of the U.S. to sustain themselves.
- South Koreans would need more than eight (8!) South Koreas to sustain themselves!
- And the population of the world as a whole would need 1.6 earths to sustain itself.
How is this possible? In other words, how can a country or the whole world use more resources than can sustainably be provided, and still survive?
Optional (But Strongly Suggested)
Now that you have completed the content, I suggest going through the Learning Objectives Self-Check list at the top of the page.
Sustainable Growth?
Learning Objectives Self-Check
Read through the following statements/questions. You should be able to answer all of these after reading through the content on this page. I suggest writing or typing out your answers, but if nothing else, say them out loud to yourself.
If you haven't done this already, the next time you hear or read an economic report, or hear a politician discuss economic policy, pay attention to how much focus is on growth. The tax cuts passed at the end of 2017 in the U.S. provide a great example of this, as do the more recent Covid relief bill. "Economic growth" was often cited as the main purpose of the tax bill, and Covid relief to a lesser extent. One of the major economic concerns expressed with regards to the Covid-19 pandemic is "contraction," i.e. negative growth. This is not an aberration! We hear the phrase "economic growth" so much that the attempt to achieve it is taken as a given. This cuts across political (Republican, Democrat, Independent, etc.) and international boundaries, by the way.
But have you ever thought about what the implications of a permanent state of economic growth are, or if it is even possible? Renowned economist Herman Daly - who, among other accolades received the prestigious Right Livelihood Award [125], aka "the alternative Nobel prize", in 1996 - provides a concise explanation of the inadequacies of the notion of "sustainable growth" in the article below.
Important Note
In general, the most acceptable type of information source is peer-reviewed research, which appears in journals. There are thousands of scholarly/academic journals [126], and to be fair not all of them are regarded with equal esteem. But, by and large, if you find information in a journal, there is good reason to believe that there is at least relatively solid scientific backing behind it, and often very solid scientific basis (again, this depends somewhat on the journal).
"Peer-reviewed" means that the article was reviewed by experts in the field of research addressed in the article, i.e., the author's peers. This is usually a very rigorous process, and it is rare to find major errors in peer-reviewed research, particularly for well-regarded journals. There are some exceptions - for example, you have to be careful who funds research. Authors are supposed to disclose who funded their research (research can be very costly, if nothing else to compensate the authors), but there are instances of this not happening. Funders are not supposed to influence research outcomes. In fact, that entirely contradicts the principle of the scientific research process. But results are often open to some interpretation, and methods are never perfect, so there is room for subtle influence. For example, you may want to take energy research funded by energy companies or energy advocacy organizations with a grain of salt (i.e., really use your critical thinking skills!). This is much more important for non-peer reviewed research. This is usually oil- and/or natural gas-related - mostly because they are some of the wealthiest corporations in the world [127] and stand to gain (or lose) significantly due to changing scientific and policy understanding - but this stands for renewables as well.
All that said, peer-reviewed research is considered the best type of information to use. The article below is from the peer-reviewed journal Development. Note that many non peer-reviewed articles use peer-reviewed information as source material, which is important to consider when analyzing the reliability of the information.
To Read Now
Before reading the article, a short note on terminology: Gross Domestic Product (GDP) is the "value of all finished goods and services produced within a country's borders in a specific time period" (source: Investopedia: gdp [128]). Gross National Product (GNP) is the same as GDP, but includes money made overseas by domestic residents, and does not include money made domestically by foreign residents (source: Investopedia: gnp [129]). I recommend at least watching the videos on the GDP a GNP Investopedia pages.
So, GDP is the dollar value of every new product and service bought and sold within a country's borders, plus things like government spending and net exports. Say a Chinese company sells products within the U.S.'s physical borders. All income counts toward the U.S.'s GDP, but not China's GDP. But that income does not count toward the U.S.'s GNP, instead, counting toward China's GNP. It used to be more common to use GNP, but now GDP is much more commonly used. For the purposes of this course, it is not important to spend time distinguishing between the two, but to understand that they are both measurements of overall economic activity.
Economists use GDP as a sign of general economic health, particularly whether it is growing (considered a good thing) or shrinking (not good). Another important term is GDP per capita (GDP/capita). This is a measure of GDP divided by the number of people living in a country.
- Read "Sustainable Growth, an Impossibility Theorem," by Herman Daly, located in the Modules tab in Canvas under Lesson 2. This is pretty dense reading. There's no shame in reading it more than once!
The Steady State Economy
There are a lot of good points made in the article, but the overarching one is:
"An economy in sustainable development...stops at a scale at which the remaining ecosystem...can continue to function and renew itself year after year" (p. 45)
This should sound very familiar! It coincides neatly with the concept of ecological footprint. (I'll leave you to think about what this means in terms of global ecological footprint, i.e. 1 earth, less than 1 earth, etc.) He describes this point (an economy in sustainable development) as the optimal scale for the economy, and that optimal scale is never addressed when discussing macroeconomics(p. 46). In other words, economists (and by extension, politicians) do not discuss the best (optimal) size of the economy, only focusing on growing it as large as possible. Think about this next time you read or hear a story regarding economic growth.
Another essential concept is that Daly is careful to point out the difference between growth (getting "bigger") and development (getting "different"). The economy and society can develop forever, but cannot grow forever. A developing economy is not stagnant, even if it is not growing. Money will change hands, services will be provided, goods will be made, etc. An economy cannot grow forever, however, because it is a subset of the earth, and is subject to the physical limitations that the earth's biocapacity provides. This is a fundamental principle that should be considered when discussing economic growth and economic sustainability, and it also aligns closely with the notion of ecological footprint.
The whole article is important, but a few other highlights I'd like to point out are:
- He states from the outset that "sustainable growth is impossible" (p. 45). Simply put, as long as the economy is based on the unsustainable use of natural resources, economic growth cannot be sustained indefinitely.
- Sustainable development is possible only if it exists within a system that is "maintained in a steady state by a throughput of matter-energy that is within the regenerative and assimilative capacities of the ecosystem" (p. 45). I.e. (again, this should sound familiar), we can only use resources at a rate no faster than they can be replenished, and cannot emit wastes any faster than they can be safely absorbed into/assimilated by the natural environment.
- He notes that growth has "almost religious connotations of ultimate goodness" (p. 45). This was addressed above. It is beyond rare to hear someone publicly state that growth is not necessary.
- On p. 46, he is clear that one of the primary goals of the economy should be to alleviate poverty, but that simply growing GDP (or GNP) will not make that happen without some guidance and/or policies.
- He offers a few relatively straightforward policy solutions on pp. 46 - 47:
- Tax resource extraction and use the money to reduce income tax, particularly at lower income levels. (Side note: This is referred to as a revenue-neutral tax because all of the revenue is given back to the people, not the government. A revenue neutral carbon tax has been proposed by more than one bipartisan group. See the link to the Citizens' Climate Lobby [130], and this one to the Climate Leadership Council [131], if you are interested in learning more.)
- "Renewable resources should be exploited in a manner such that: (1) harvesting rates do not exceed regeneration rates, and (2) waste emissions do not exceed the renewable assimilative capacity of the local environment" (p. 47). Sorry to sound like a broken record, but these should sound familiar.
- Finally, he proposes that: "Non-renewable resources should be depleted at a rate equal to the rate of creation of renewable substitutes" (p. 47). For example, for every 1,000,000 Btu's of fossil fuel used, we should find a renewable source of 1,000,000 Btu's. He suggests supporting this by taxing non-renewables and using the funding to develop renewable substitutes.
All of the above summarizes the concept of the steady state economy.
To Watch Now
Please watch a video (5:07) featuring Herman Daly, himself, discussing the steady state economy:
If we start with the total system, the Earth, then it's fairly clear that the earth is more or less a steady state - in the sense that is not increasing in aggregate mass; it is not increasing in surface area. The rate of inflow of solar energy is more or less constant. The rate of outflow of radiant heat energy is more or less constant. – at the same amount, same amount of energy.
If that weren't the case, then temperatures will be going up. The import from outer space of materials and the export to outer space of materials are roughly equal - I mean both negligible, and usually involuntary in any case. So, the Earth as a whole, in its behavior mode is a steady state. So as the economy becomes a larger and larger subsystem of the Earth, then more and more it has to conform to the behavior mode of the whole of which it is an ever-larger part.
So in the limit, I mean the economy takes over the whole earth, well then it’s got to be a steady state because that's the way the earth is. And then I think it needs to approximate a steady state long before it hits that limit. And so I think that's kinda the long run idea of steady state.
Now the idea, I think there are limits, you know, long before the macroeconomy hits that physical scale limit. Long before that happens, we experience the cost of growth rising faster than the benefit. Because we're sacrificing natural services that are more important than the production benefits that we gain.
I mean, you would expect this to be a normal consequence of classical economics - the law of diminishing marginal utility: you satisfy your most pressing wants first. So, you are going to run out of important things that you need. And the Law of increasing marginal cost: you do the easiest thing, you have access to the easiest resources first, so the cost will go up there.
So, you know, what we need is to be good economists, in the sense that we measure costs and benefits and are sensitive enough to recognize the economic limit to growth, to stop when growth becomes un-economic and not be so dumb or so insensitive that we have to crash headlong into biophysical limits and really get smashed.
As John Stuart Mill said, who was the classical economists who gave the fullest exposition and the most favorable exposition of the idea of a steady state, which they referred to as a stationary state, but it meant basically the same thing… He says it by no means implies any stationary state of human welfare. There will be as much room for moral and ethical and technical improvement as there was in a growth economy. And much more likelihood of it happening, in a way, because when you close off physical growth then the path to progress has to be moral and technological and intellectual and informational. You’ve switched the path to progress from this physical more and more stuff to a qualitative improvement of the same amount of stuff.
And, how far we can go in that direction? Uh, you know, who knows, but regardless of how far, why not, to we're gonna have to go in that direction.
So, let’s do it, and if we're lucky it won't be all that costly. It will be a great deal of moral improvement because I rather expect that we will…it will go well in that way because the material, the attempt to satisfy our wants by material growth was a little bit like scratching in the wrong place. You know, you’ve got a real itch, but you are just clawing somewhere and it doesn't help.
So at least I think this will help us to scratch in the right place if we devote our attention to moral and technical progress.
Suggested Reading
Feel free to read a description of the steady state economy, as well as a brief historical background of the concept, by the Center for the Advancement of the Steady State Economy (CASSE). One thing to note that you will see in the article: Ecological Economics is a sub-field of Economics that essentially advocates for the application of the steady state economy concept (among other things). This should not be confused with Environmental Economics, which is more of a traditional Economics sub-field. Note that the "History of the Steady State Concept" section is less important than the others, but provides some good historical context.
- Steady State Economy Definition [134], by Center for the Advancement of the Steady State Economy
There are a few important/interesting things I'd like to note from the reading and video:
- First, a steady state economy is an "economy of stable or mildly fluctuating size...[and]& entails stabilized population and per capita consumption." Also, that: "To be sustainable, a steady state economy may not exceed ecological limits."
- They note that: "GDP is not a good indicator of well-being, but is a solid indicator of economic activity and environmental impact." They recognize that GDP is limited in its usefulness. They indicate in a briefing paper [135] many of the reasons GDP is inadequate and offer alternatives. Overall, they are very skeptical of the viability of GDP as an true economic and quality of life indicator. This is something we will discuss in a future lesson.
- As Daly does, they differentiate between growth and development. "Economic growth is distinguished from economic development, which refers to qualitative change independent of quantitative growth. For example, economic development may refer to the attainment of a more equitable distribution of wealth, or a sectoral readjustment reflecting the evolution of consumer preference or newer technology."
- "Theoretically and temporarily, a steady state economy may have a growing population with declining per capita consumption, or vice versa, but neither of these scenarios are sustainable in the long run...It also has a constant rate of throughput; i.e., energy and materials used to produce goods and services." the economy and resource use are able to grow until a certain point. There is a maximum size at which a steady state economy may exist based on the capacity of the earth to supply natural resources. Once this maximum is achieved, growth must stop, lest natural resource capacity be diminished.
- They point to technology as a source of efficiency that can reduce the physical resources needed to produce goods and services. Efficiency is an essential component of steady state economics because it allows us to reduce our ecological impact. However, there are physical limits to this. As the economy converts raw natural resources into other products, some waste is generated along the way. The waste is usually difficult, if not impossible, to convert back to its original form. Think of how difficult it would be to make sawdust back into a tree; carbon dioxide, water vapor, and heat back into coal; plastic back into oil; and a silicon microchip back into grains of sand [136]. As the economy chugs along using resources faster than they can be replenished, the natural system degrades. This imposes limits on what we can do in an economy.
- As Daly says in the video, achieving a steady state economy does not mean the quality of life must decrease, or even stay the same at a certain point. Qualitative (type; character; quality) improvements can continue while quantitative (amount; quantity) increase stops. In fact, as you explore the CASSE website [137], you find out that they believe that achieving a steady state economy will improve the quality of life for current and future generations and that quality of life is a major goal of the steady state economy.
- Proponents of the steady state economy have poverty alleviation as a primary concern, as well as ecological overshoot. The three main concerns of a steady state economy are "sustainability, equity, and efficiency."
- They note that: "Neither economic growth nor economic recession are sustainable; therefore, the steady state economy remains the only sustainable prospect and the appropriate policy goal for the sake of sustainability." They view the steady state economy as the only sustainable way to organize an economy.
Some other points that are important to note about the steady state economy. (This is from a reading by CASSSE that has unfortunately disappeared from the internet, but the points are important.)
- The authors are clear that a steady state economy can only be reached by regulating of the market, which is a primary reason that many economists are critical of them. BUT they also state that "ecological economists support many market strategies to accomplish efficient allocation of resources". They recognize that markets are very good at efficient resource use, but are only useful "after achieving sustainable scale and fair distribution."
- To reiterate an earlier point, note that Daly and CASSE are not saying that economic growth has to stop now, but that it must stop at a point at which the earth is capable of renewing its natural resources indefinitely. If we can grow the economy while maintaining a steady state of natural resources, then hey, have at it! But at this point, all we have is one earth to pull resources from, so we must obey its laws.
- (Optional) The "history" section mentions more than a few well-known figures in the history of economics, including Adam Smith, John Stuart Mill, John Maynard Keynes, Nicholas Georgescu-Roegen, and E.F. Schumacher. Some of them are seen as controversial in some circles, but all of them are notable. Worth looking into if you are interested in economic history and ideas.
Make no mistake: being on record as saying that the economy must stop growing at some point is anathema to the core of mainstream thinking about how economies should work. It will not win you many friends in the policy or economic world, and certainly won't get you elected to public office (in the U.S., anyway). But the logic is hard to argue with.
Good to Know - Degrowth
There is a burgeoning belief in the sustainability movement that not only do we need to stop focusing on economic growth as a development/policy goal, but that we actively need to seek ways to have negative growth (i.e. contract) in order to achieve sustainability goals. This is most often referred to as "degrowth." There are a lot of folks researching and making proposals on this, but there is a lot of controversy about this even among sustainability advocates. Some folks believe that technology and efficiency will solve sustainability problems (they are often referred to as technological optimists/techno-optimists or cornucopians). They often point to the possibility of "decoupling" resource use from growth. The jury is out on this, but it's not looking good for the cornucopians. While many countries have reduced emissions while growing GDP, most scientists believe it is not possibly to fully decouple environmental impact from economic growth.
This is an essential debate! The exact solution is not clear, and it will take years if not decades to figure out the best approach. But as burgeoning sustainability experts, it is helpful for you to know that degrowth may be necessary to achieve a sustainable future.
There is a lot of literature on this, but the following article provides a good overview of the current debate. They synopsize Degrowth thus: "The degrowth movement, as it’s called, argues that humanity can’t keep growing without driving humanity into climate catastrophe. The only solution, the argument goes, is an extreme transformation of our way of life — a transition away from treating economic growth as a policy priority to an acceptance of shrinking GDP as a prerequisite to saving the planet." While I strongly disagree with the phrase "save the planet" - the planet will survive, but the people and other organisms may not - the rest of the article is very good.
- Suggested reading: Can we save the planet by shrinking the economy? [138], by Vox
- Other possible readings: World Scientists’ Warning of a Climate Emergency [139], Ripple, W.J., Wolf, C., Nwsome, T.M., Barnard, P., & Moomaw, W.R. (2020), Bioscience, 15(1), 8-12; The decoupling delusion: rethinking growth and sustainability [140], The Conversation; Is Decoupling GDP Growth from Environmental Impact Possible?, [141]Ward, J.D., Sutton, P.C., Werner, A.D., Costanza, R., MOhr, S.H., & Simmons, C.T. (2016), PLoS One, 11(10).
Free Market Environmentalism
It should not be difficult to recognize that humans are subject to the physical constraints of planet earth. But how we make sure that we do not exceed our limit to the point of collapse (e.g., overshoot and collapse mentioned previously) is something that is debated, even by people with seemingly the same end goals. There is a branch of environmental (well, it's primarily economic) thought that is based on the power of free markets to most efficiently manage resources. This is often called free market environmentalism (FME). Those who advocate for FME believe that free markets (economic systems that are free from government regulation) are the best way to solve environmental problems. And, just as important, they believe that the government is much worse at managing resources than the market. This article from the Library of Economics and Liberty [142] (a free-market think tank) summarizes the school of thought pretty well.
As outlined in this article, this school of thought rests on three assumptions in order for markets to work for any environmental good (e.g., a forest, clean water, clean air, etc.): "Rights to each important resource must be clearly defined, easily defended against invasion, and divestible (transferable) by owners on terms agreeable to buyer and seller" (source: Library of Economics and Liberty [142]). In other words, if a piece of property has:
- clear ownership, and
- those ownership rights are defensible in court (or elsewhere), and
- it can be bought and sold freely, it will be preserved.
I would add that (4) the author (and this is typical of FME) also assumes that the owner of the property is motivated to protect the property in anticipation of future profits.
For example, if I own a lake and someone pollutes it, if the courts are just, the polluter will end up paying me because (s)he compromised my ability to enjoy my property. If these conditions are known, then the polluter, in theory, will decide not to pollute in order to avoid the extra cost. As you can see, all of this relies on using money as the motivating factor.
This is a very sound argument as long as those conditions are met, at least in terms of environmental protection. This situation, and variations of it, have been proven effective in a wide array of applications. It worked for water conservation in the Western U.S. [143] And here are a number of case studies [144] demonstrating that these principles can work.
But what if those four conditions are not met? With climate change, a fundamental question is: "Who owns the atmosphere?" (The answer: no one does.) If there is no clear ownership, the system may not work. Let's go back to my lake that got polluted, and think about a few plausible scenarios.
- What if it was impossible to prove where the pollution came from? If it was airborne pollution that is impossible to trace, I am out of luck. I have no one to sue. This is, unfortunately, the case for a lot of types of pollution.
- Even if I had a pretty solid case that the pollution came from a specific source, the owner of that source can probably afford better lawyers than me and could win a case.
- What if I can make more money destroying my lake than preserving it? I could fill it in and build an apartment on it. Or sell it to a chemical company to use as a dumping ground. If I place a certain economic value on my lake, then it stands to reason that I would be willing to destroy it if I could make more money by doing so. I could use the money to move on and buy more property. The case studies noted above hinge on a party or parties agreeing that conservation is necessary.
- This type of system is based on perceived value being real value, which can also cause problems. Biodiversity (which we will go over in the coming lessons) is something that very few people place value on, but is essential for human survival. Also, there are certain goods that are nearly impossible to accurately price, even using Willingness to Pay analysis. Negative impacts on future generations is one that is particularly sticky in this regard. (Remember intergenerational equity?)
- Finally, by basing everything on money, those without money will have less access to the resource. If you recall from Lesson 1, this fits squarely with one of the fundamental sustainability principles (social equity). If I charge people a lot of money to fish in my lake, that may help preserve the lake, but at the expense of equity.
This article from the Property and Environment Research Center [145] - also an advocate for free market environmentalism - goes over a few of these and other examples where the system breaks down.
What is the Solution?
This is a really dense, complicated topic that would take a very long time to fully flesh out. But determining the solutions to critical energy and sustainability problems is not one of the goals of this course, however, recognizing the planet's ability to support life is. One of the main points that I want you to walk away with from this page is that our economy has physical limitations that we must adhere to. The steady state economy is a precondition for environmental sustainability. But it is useful for you to know - especially in terms of critical analysis - that there are multiple possible ways to address this goal. Many - Herman Daly among them - advocate for government policy to solve this problem. Many - like the free market environmentalists - believe that markets and private property are the answer. I am not here to say which school of thought is correct, but my belief based on the evidence is that it is somewhere in between. Perhaps this could be done by having the government cap consumption at sustainable levels and allowing the market to work from there ("cap and trade"), or by using some of Daly's suggestions regarding subsidies and taxes. Cap and trade worked well for the acid rain problem in the early 1990s, for example, and is often cited as a solution to carbon emissions [146].
There are pros and cons to each approach. Markets are really great at efficiently managing resources that can have economic value attached to them (e.g., copper, oil) but even the most devout free market believers realize that they don't always work. Externalities are a good example of this (e.g., environmental destruction from copper and oil mining, air pollution from burning gasoline). And placing an economic value on something is a double-edged sword - it can, and often does, lead to preservation because of its expense (e.g., private nature parks), but it can lead to destruction if it is not perceived as worth enough (e.g., converting rainforest into pasture land). Private ownership often leads to inequity as well, as those without means are priced out of the access to goods (private education being a prime example of this). But government is generally not good at efficiently managing resources (e.g., the federal government of the U.S.). Overall, it is very difficult to believe that the market, left to its own devices, will achieve the Steady State Economy, especially if history is any guide. This is evidenced by the fact that the global ecological footprint is already at unsustainable levels.
One of the goals of this course is to help you think critically about these issues, so my hope is that when thinking about the information presented here you do so with "clarity, accuracy, precision, consistency, relevance, sound evidence, good reasons, depth, breadth, and fairness" as you will read in the critical thinking section at the beginning of the next lesson (source: The Foundation for Critical Thinking [147]). To do this, you must look at the evidence and use sound logic, minimizing the influence of ideology as much as possible. But as we will also go over in the critical thinking lesson, the more you know about these topics, the better you are able to make a sound critical analysis.
Optional Reading
The following short article and web page describe somewhat competing views on this.
- "How Sad; George Monbiot Does Not Realize That a Steady State Economy Is Not A No Growth Economy [148]." Tim Worstall, Forbes Magazine. Please read through the comments on the second page.
- Briefing Papers [149]. Center for the Advancement of a Steady State Economy.
Check Your Understanding - Free Market Environmentalism
Optional (But Strongly Suggested)
Now that you have completed the content, I suggest going through the Learning Objectives Self-Check list at the top of the page.
Development and Quality of Life
Learning Objectives Self-Check
Read through the following statements/questions. You should be able to answer all of these after reading through the content on this page. I suggest writing or typing out your answers, but if nothing else, say them out loud to yourself.
Clearly, there are a lot of ways to think about and measure whether or not we are living sustainably, and we've only scratched the surface in this course. So far, we've primarily examined how to be environmentally sustainable. But what about the other two "E's" of sustainability that were discussed in Lesson 1? If you can't remember what they are, I suggest clicking back to Lesson 1 [150] to refresh your memory.
Remember that one of the overarching goals of this course is to address issues from a humanistic perspective, which, among other things, means that we are concerned about the plight of all human life. And the discussion of equity made it clear that access to resources is an essential component of sustainability. Achieving environmental sustainability is a precondition for establishing this - humans live on the earth and need its resources to survive - but if we fail to address the quality of life of the people living on the planet, we've only won a partial victory. What good is a nice planet if all of the people on it are miserable?
Please Fill This Out
If someone gave you a choice between a high or low quality of life, chances are about 100% that you'd say "high." But what actually constitutes a high quality of life?
- Please indicate what you think is required to have a high quality of life [151].
- Once you submit, you can view recent real-time results. [152]
- If you are so inclined, view some past responses here. [153]
The Inadequacy of GDP
GDP is the most oft-used metric to indicate how a country's economy is doing. But it is also widely used as a general indicator of how a country's people are doing. There is some usefulness to this, as you will see below. But GDP obscures a lot of possible problems (economic, social, environmental, etc.), and does not indicate all of the good things about a society. In short, there are some things that are good for GDP that are bad for people, and there are some things that are good for people that are not necessarily good for GDP. This problem was eloquently described by Robert F. Kennedy in 1968. It is as relevant today as it was 45 years ago. Hopefully, this will give you some pause when you hear the latest GDP numbers as an indicator of how well a country is doing. Watch his speech below (2:11 minutes)
[Text on screen: It's been 40 years since Robert F. Kennedy gave a speech warning us about how poorly we measure the success of our nation. His words are as important today as they were then.]
Too much and for too long, we seemed to have surrendered personal excellence and community values in the mere accumulation of material things. Our Gross National Product, now, is over $800 billion dollars a year, but that Gross National Product - if we judge the United States of America by that - that Gross National Product counts air pollution and cigarette advertising, and ambulances to clear our highways of carnage.
It counts special locks for our doors and the jails for the people who break them. It counts the destruction of the redwood and the loss of our natural wonder in chaotic sprawl. It counts napalm and counts nuclear warheads and armored cars for the police to fight the riots in our cities. It counts Whitman's rifle and Speck's knife, and the television programs which glorify violence in order to sell toys to our children.
Yet the gross national product does not allow for the health of our children, the quality of their education or the joy of their play. It does not include the beauty of our poetry or the strength of our marriages, the intelligence of our public debate or the integrity of our public officials. It measures neither our wit nor our courage, neither our wisdom nor our learning, neither our compassion nor our devotion to our country, it measures everything in short, except that which makes life worthwhile. And it can tell us everything about America except why we are proud that we are Americans.
[Text on screen: Senator Kennedy's warning to the nation in 1968 is even more urgent today. A new debate is beginning, including hearings in the U.S. Congress. Get involved. To learn more, go to: http://www.glaserprogress.org/ [154]Good to Know: The Invisibility of Household Labor
One of the major inadequacies of GDP as an indicator of how society is doing is the invisibility of household labor, which is primarily done by women. According to the OECD [157], men in the U.S. spend an average of 17.5 hours per week doing unpaid household labor, while women spend (wait for it) 28.4 hours per week! None of this is counted towards GDP. (Related note: If any parent or spouse is a "stay-at-home" mom or dad, please never say that they "don't work." They just don't get paid to work.)
This article [158] from the New York Times provides some interesting visualizations of the gender-based household labor gap across the world, and found that even at minimum wage women across the world would have made 10.9 trillion (!) dollars in 2019 alone. To provide some context, the total global GDP in 2020 was a little under 85 trillion, according to [159] the World Bank. A few other problems with GDP include:
- GDP/cap says nothing about the distribution of income in country.
- GDP/cap ignores the informal economy. (Even Craig's List doesn't count!)
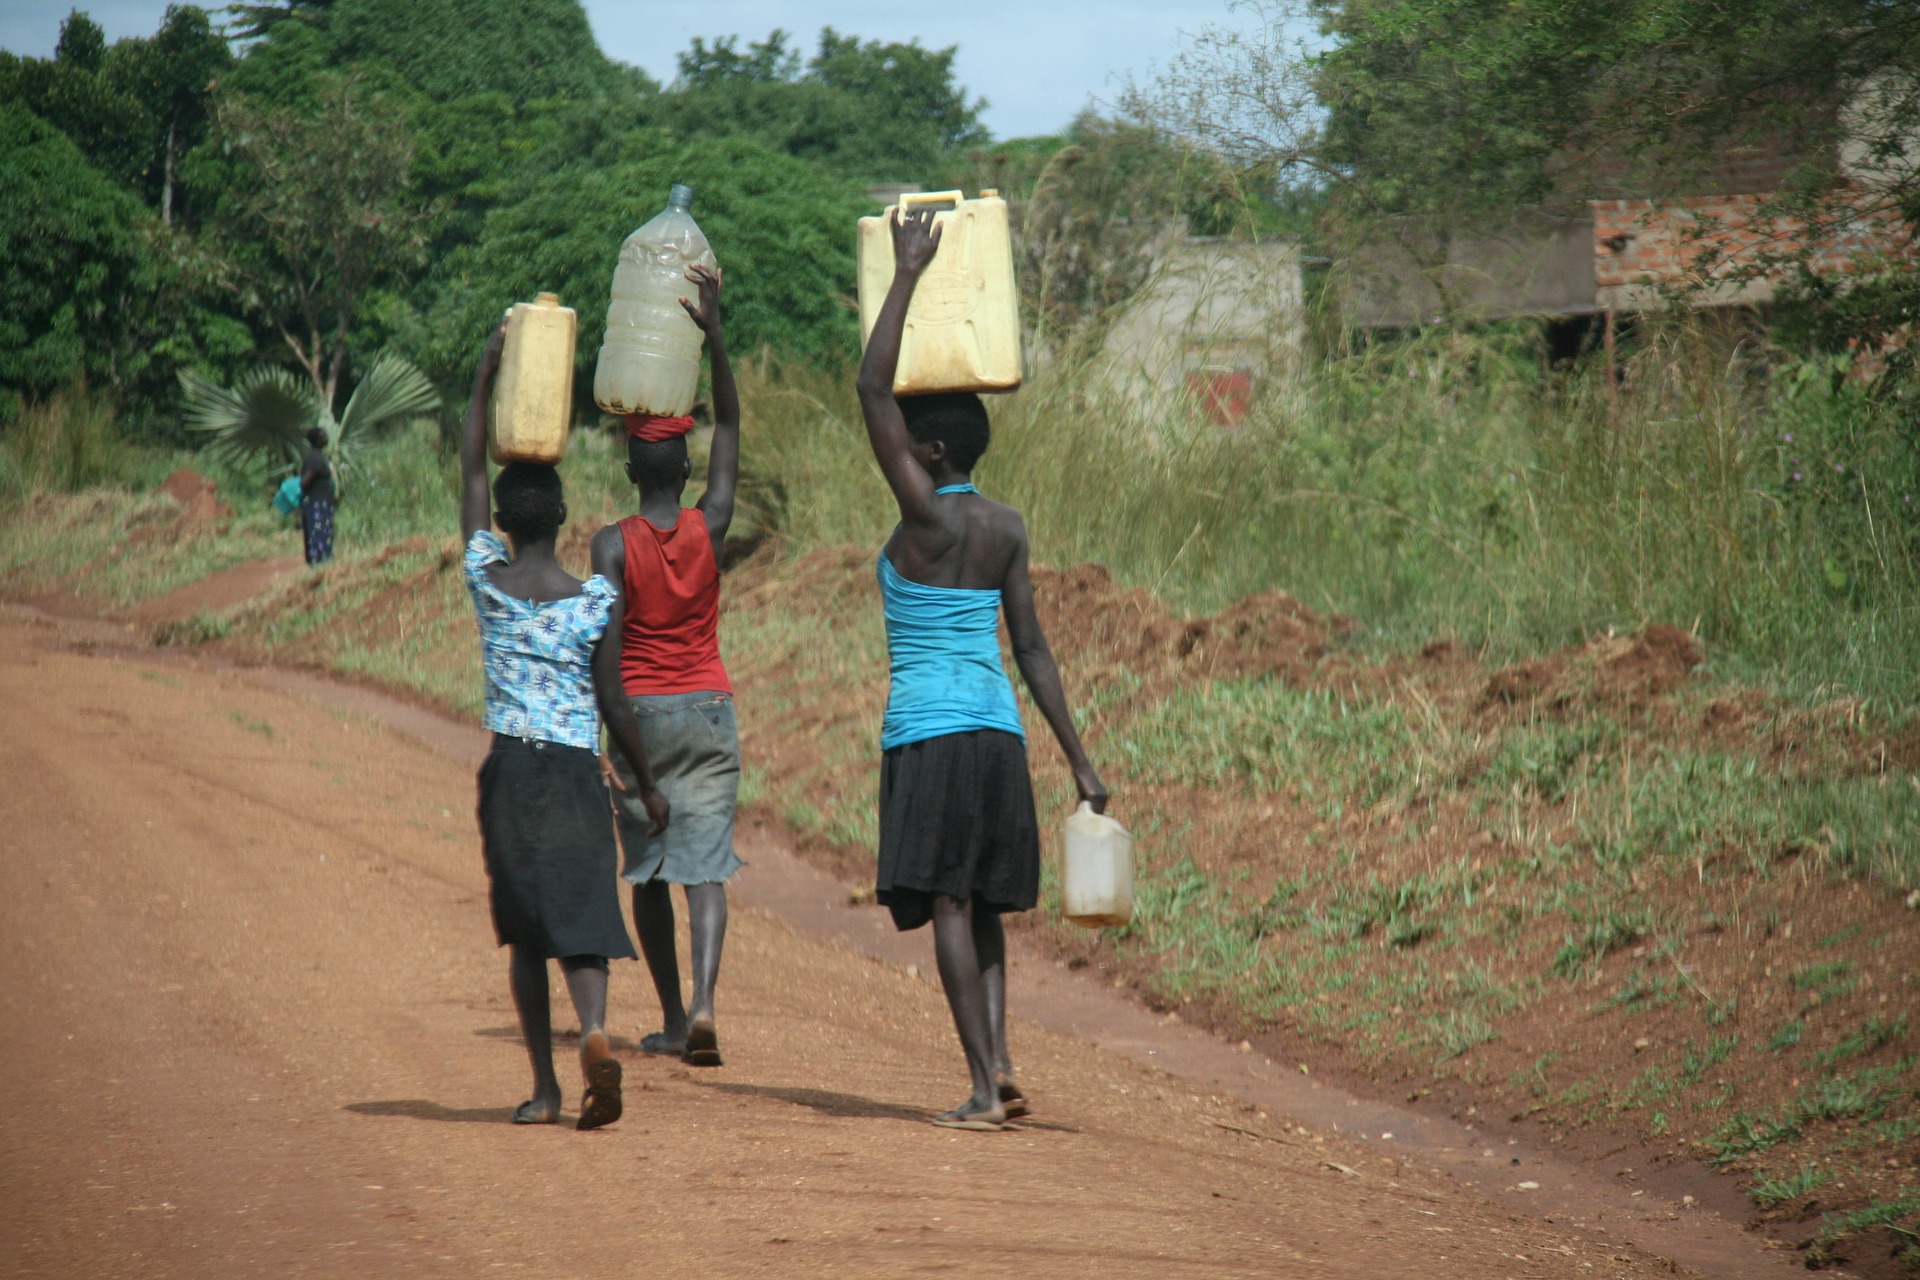
Quality of Life
Quality of life is another one of those terms that is thrown around liberally but has no specific definition. We all want a high quality of life, but what does that mean exactly? I am not here to settle the debate, but I do like the definition from this website [163]: Quality of life is "the extent to which people's 'happiness requirements' are met." I'd add the term "satisfaction" in there as well, as in "are people's 'satisfaction' requirements met?" The same site also notes that "[Quality of life] may be defined as subjective well-being." Nothing is universally regarded as necessary for happiness, life satisfaction, or well-being. For example, I have friends who LOVE to hunt for deer and will sit for hours in a tree stand in the freezing cold, silently waiting for one to walk by. I can think of 1,000 things that I'd rather do than that (all numbers approximate). But to them, that is an important part of their quality of life. Nothing wrong at all with that, by the way - it's just not for me.
Hunting is something that is obviously not universally required for a high quality of life. But I'm sure there are thousands, if not millions, of people who count it as important. But if you think about it, there is nothing that everybody loves to do, so it wouldn't matter which activity I used as an example. So, if we want to measure the quality of life, how do we do it?
Let's go through a quick thought experiment.
- If you could ask everyone in the world up to 3 questions and were guaranteed a response for each one, what would you ask them? All that you want to know is whether or not they have a high quality of life.
- Now, assume you can get up to 5 pieces of data for everyone in the world (e.g., income, how many meals a day they eat, what living conditions they have, etc.). What 5 data points would you obtain?
Fill This Out
Please click on this link to fill out a short questionnaire. The answers are anonymous.
- Survey Link [164]
- See real-time results [165]
- (Optional) see some past results [166]
Development
We have used the word "development" solely with respect to "sustainable development" so far, though Herman Daly addressed development to some degree. The word development is used a LOT in economics, politics, and particularly in international studies. "Development Studies" is considered its own discipline and many schools offer Development Studies degrees [167].
But how do we know if a society or country is "developed?" Or better yet, how can we compare how well "developed" one country is relative to another? You probably have heard the term "undeveloped countries" or "underdeveloped countries" used in political or economic discourse. But have you ever stopped to think what that actually means? Clearly being "undeveloped" is a bad thing, so by using that term judgment is being passed. Most commonly, it is indicative of the relative income of a country and whether or not they've embraced the modern economic system. But as RFK pointed out (and as I'm sure your surveys will attest) income is not the only thing required to make life worth living.
To Read Now
The World Bank [168] is an international organization whose stated goals [169] are to 1) "End extreme poverty" and 2) "Promote shared prosperity." Historically, they have done this primarily by offering loans to governments and organizations.
The World Bank figures very prominently in global economics, but their reputation is mixed, especially among sustainable development advocates. They have a tendency to provide loans with conditions that push economies in the direction they want them to go, sometimes at the expense of the people in that country. That said, they have a lot of expertise, and are a good place for economic and other data. The document below provides a good explanation of what development is and is not. Frankly, it is surprising to see such a document from the World Bank, given their historical focus on economic growth alone. But they bring up some very good points. (Note that I summarize the key points below.)
- What is Development? [170] - The World Bank
A few important points from this reading:
- They state from the outset that "indicators of wealth...provide no information about the allocation of...resources" and that "countries with similar average incomes can differ substantially when comes to people's quality of life." They are clearly indicating that GDP is not the best way to measure development, which is particularly striking coming from an organization that so strongly advocates for economic growth.
- That stated, the World Bank understands that money is usually an important factor in achieving quality of life ("economic growth, by increasing a nation's total wealth, also enhances its potential for reducing poverty and solving other social problems"), but that there are many other factors as well. They mention income distribution, access to education and healthcare, environmental quality, employment opportunities, lack of crime, literacy rate, political freedom, and more.
- They quote the United Nations as saying that "human development is the end - economic growth a means." It is important to note that they say "a" means, not "the" means. Again, having at least a reasonably high income is an important factor in achieving some quality of life, but human development is the true goal.
- They note that not only can economic growth be good for development, but that development is good for economic growth. It is notable that they state that economic growth is "sustainable," if it comes with human development. Unlike Daly, they believe that sustainable growth is possible.
- They also mention the notion of social justice, which they define as "equality of opportunities for well-being, both within and among generations of people." This is not the only definition but is an important way to think about it. We'll delve more deeply into social justice in a minute. As noted previously, the term intergenerational equity is often used to describe the equity impacts between generations. This is a key consideration with regards to climate change and many other issues that will impact future generations.
- They advocate for systems thinking when they state that part of social justice is to consider how "the economic activities of some groups of people continue to jeopardize the well-being of people belonging to other groups or living in other parts of the world." Remember that systems thinking involves thinking about connections between one action and others.
Quality of Life Metrics
It should be clear by now that there are many possible factors that contribute to quality of life, or lack thereof. Back to our original question: How do we measure quality of life? For that, we need a quality of life metric. These are often referred to as development indices. Recall from Lesson 1 that it is important to be able to measure aspects of sustainability? Development indices are one aspect of this.
There are two approaches to this:
- on the one hand, we could try to directly measure quality of life itself;
- conversely, we could try to quantify the conditions that lead to a high quality of life.
There have been many attempts to do the latter and a few that have tried to do the former. It would be impossible to research all of these, but some of the most-used and/or most useful ones are listed below. The first two (HDI and Inequality-Adjusted HDI) measure things that lead to a high quality of life, the third one (Happiness Index) attempts to measure it directly, and the fourth (Multidimensional Poverty Index) measures things that indicate a lack of quality of life. The last one(Happy Planet Index) - which is optional - is a mixture of the two plus ecological footprint.
Please note that even the best metric cannot create a full picture of development, however it is measured. Even the most "developed" country - regardless of how you define development - will have people who are living in poor conditions. Also keep in mind that this is not a comprehensive list of development indices.
Human Development Index (HDI)
The Human Development Index is the most well-known quality of life metric. It was created by the United Nations (UN), who assesses it every year. It measures three things to determine quality of life, as you will see below: living a "long and healthy life, being knowledgeable, and hav(ing) a decent standard of living." The HDI scale goes from 0 (the worst possible) to 1 (the best possible).
Suggested Reading
I suggest reading the following short description and browsing the most recent HDI rankings by country.
- Human Development Index [171], United Nations Development Programme
HDI combines three indicators to evaluate the level of development in a country:
- Life expectancy
- Education (mean years of schooling, expected years of schooling)
- Income per capita
This is intended to provide a fuller picture of human development. They do recognize some inadequacies of HDI, though, as they state: "The HDI simplifies and captures only part of what human development entails. It does not reflect on inequalities, poverty, human security, empowerment, etc." Some of this is addressed in the Inequality-Adjusted HDI, which is addressed below.
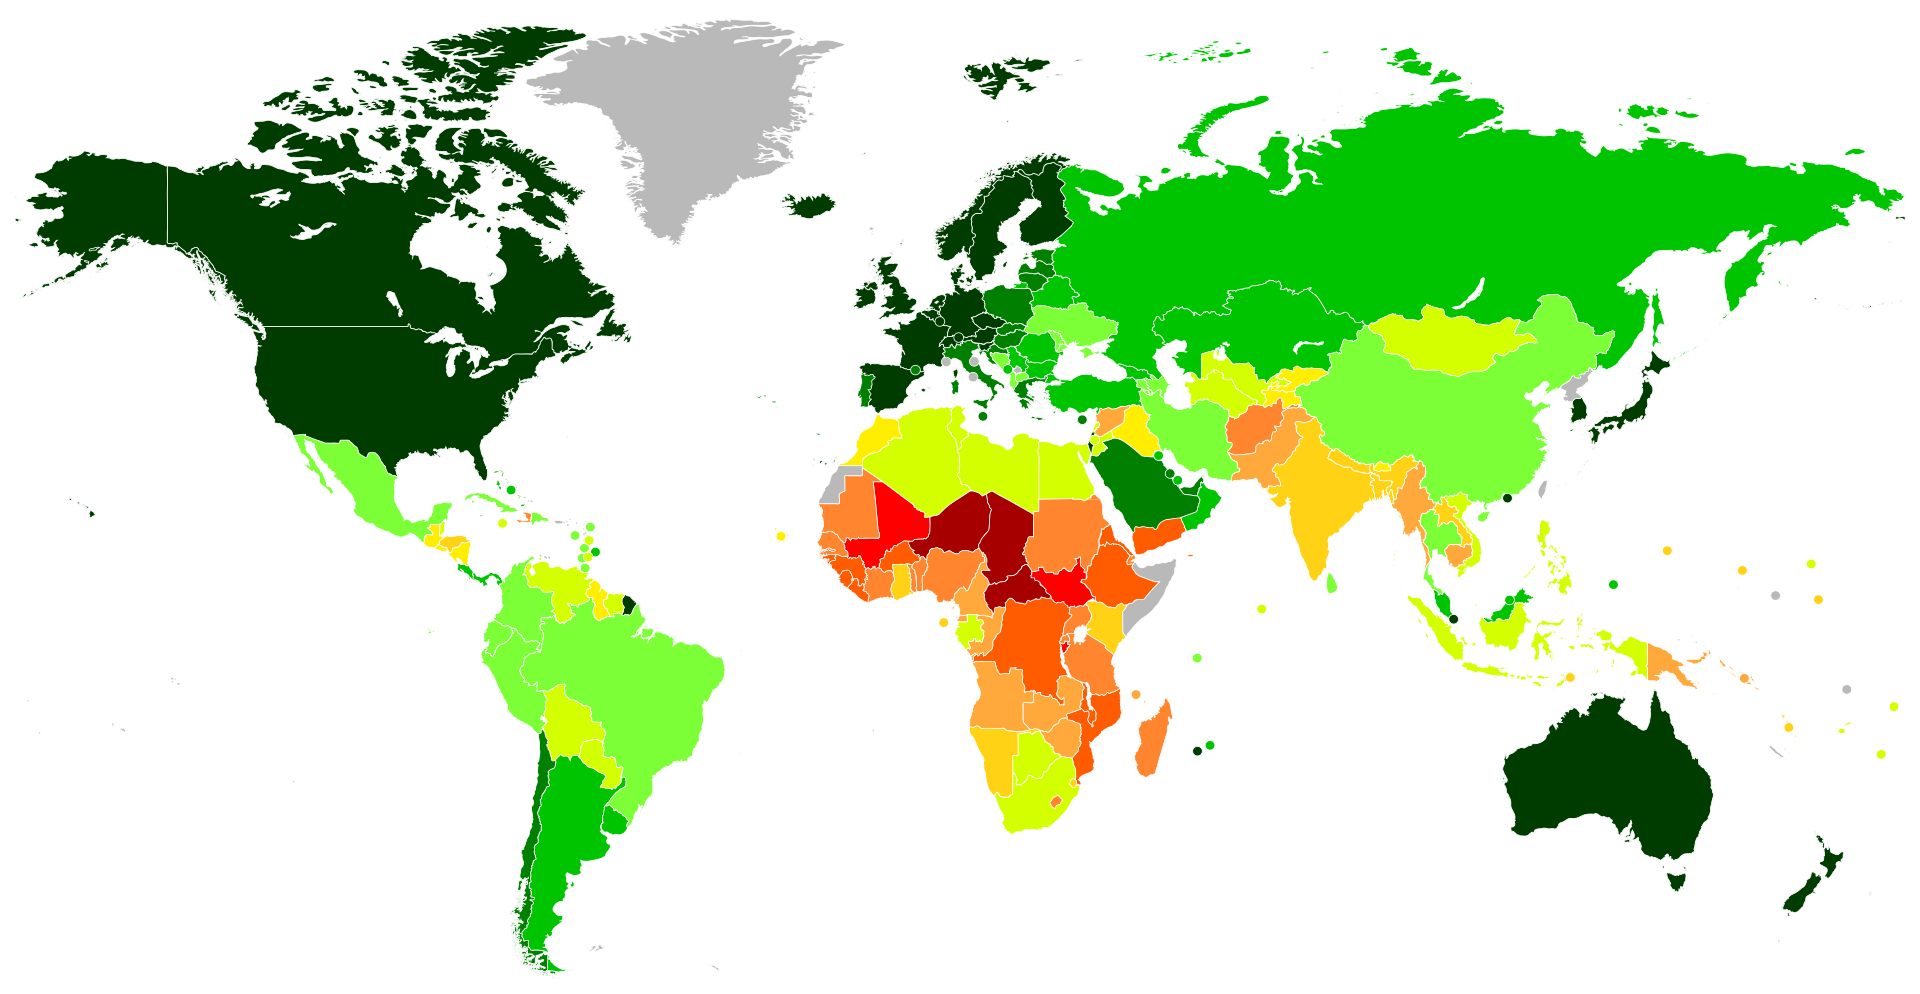
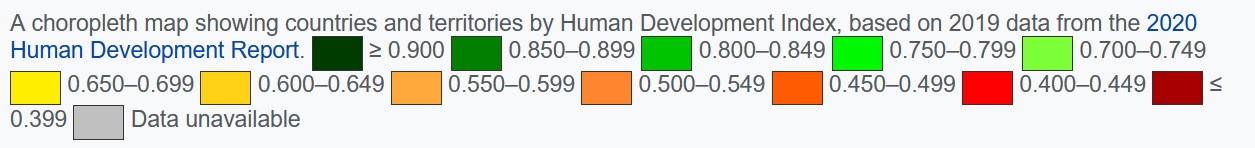
Inequality Adjusted HDI
The UN also publishes Inequality-Adjusted HDI (IHDI), which takes HDI and discounts it according to how equally the individual development metrics are spread across the population. If the Inequality-Adjusted HDI is lower than a country's HDI, then there is some inequality. For example, let's say two countries both have an average life expectancy of 74 years, which means life expectancy would be the same in the HDI rankings. But if in country A the wealthy people are living much longer than the low-income folks, and in country B pretty much everyone has the same average lifespan regardless of wealth, country B would be higher on the Inequality-Adjusted HDI rankings.
The Inequality-Adjusted HDI also uses a scale of 0 to 1, with 1 being the highest. Note that all countries have some inequality, so all IHDI scores are at least a little bit lower than the HDI score for that country.
As noted by the UN, the IHDI represents "the loss to human development due to inequality." The more inequality, the more the HDI score drops when adjusted for inequality. Note that the pattern in the map below is similar to the HDI map above, but the raw values are a little bit lower.
Suggested Reading
The short reading below from the UN provides a description of IHDI.
- Inequality-Adjusted HDI [174], United Nations Development Programme
 [175]
[175]
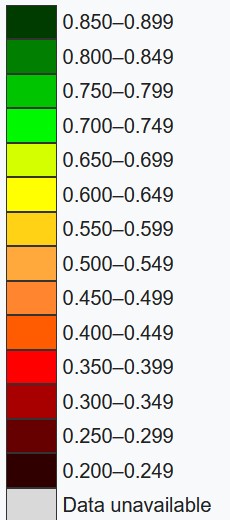
World Happiness Index/Report
The Sustainable Development Solutions Network [177], an organization with esteemed members from throughout the world, has published the World Happiness Report since 2012 (the 2023 version of the World Happiness Report is available [178]). This reporting effort is led in part by renowned International Development expert Jeffrey Sachs of Columbia University.
The World Happiness Report asks people to indicate on a scale of 0 - 10 their quality of life now and their expected quality of life in the future (see World Happiness Report details here [179], if you'd like). The basic premise behind this is that if you would like to determine how happy or satisfied someone is with their life, just ask them. This is a type of self-reported quality of life and results in a score of 0 - 10. This is sometimes referred to as the Happiness Index.
Pretty simple, right? Though it does beg some important questions. For example, if someone lives a short life with little education, but they are happy, does it matter? What about someone that has very little freedom, but is happy? What if they have almost no money, but are happy? What if others in their country lead much "better" lives, but they do not know it? I do not have the answers, but they are important questions to think about.
Suggested Readings
- It’s a Three-Peat, Finland Keeps Top Spot as Happiest Country in World [180], World Happiness Report (You can stop at "The World Happiness Report 2020 includes the following chapters:")
You may want to read the following as well.
- These are the happiest countries in the world [181], World Economic Forum.
- Browse Figure 2.1 on pp. 17-19 of the 2022 World Happiness Report [182].
A few things worth noting from the first reading:
- Since the first World Happiness Report in 2012, four countries have earned the top spot: Denmark, Norway, Finland, and Switzerland.
- The top end of the list is dominated by Nordic and Central European countries (all of whom are characterized by progressive political ideology, not coincidentally). The top 10 countries, in order, are: Finland, Denmark, Switzerland, Iceland, Norway, the Netherlands, Sweden, New Zealand, Luxemborg, Austria. The U.S. is currently #18.
- Social factors are very important. From the article: "Time and again we see the reasons for wellbeing include good social support networks, social trust, honest governments, safe environments, and healthy lives.'"
- They provide some explanation for the previous point: "A happy social environment, whether urban or rural, is one where people feel a sense of belonging, where they trust and enjoy each other and their shared institutions,” said John Helliwell. “There is also more resilience, because shared trust reduces the burden of hardships, and thereby lessens the inequality of well-being.'"
- Inequality plays a role as well: "Happiness inequality significantly reduces average life evaluations,” said Richard Layard, “This means that people are happier to live in societies without extreme disparity in the quality of life.'"
Multidimensional Poverty Index
The Multidimensional Poverty Index (MPI) is another UN metric. The premise of the MPI based on the recognition that (lack of) income is not the only way to measure poverty. For example, if a family is above the income-based poverty level but does not have access to adequate health care or education, they are stilll "poor" in quality of life terms.
The United Nations Development Programme(UNDP) summarizes the MPI [183]thusly: "The MPI looks beyond income to understand how people experience poverty in multiple and simultaneous ways. It identifies how people are being left behind across three key dimensions: health, education and standard of living, comprising 10 indicators. People who experience deprivation in at least one third of these weighted indicators fall into the category of multidimensionally poor."
As you can see below, the MPI provides a weighted list of measurable indicators. If someone experiences at least one third (1/3) of these factors, they are considered "multidimensionally poor." For example, if a family has a child that died in the last five years(1/6 weight) and one child does not attend school up to class eight (1/6 weight), they would be multidimensionally poor (1/6 + 1/6 = 1/3). But if someone was undernourished (1/6) and they don't have electricity (1/18) and cook with wood (1/18) they would not be considered multidimensionally poor (1/6 + 1/18 + 1/18 = less than 1/3). You may be thinking that it is pretty callous to consider undernourishment alone as not enough to be poor. To be fair to the UN, they spend a lot of time helping undernourished people. (As you may remember, "zero hunger [184]" is one of the UN's Sustainable Development Goals.) Just because they are not "multidimensionally" poor does not mean that they are not considered worthy of assistance! It is merely an imperfect but helpful attempt to identify the most underserved populations in the world.
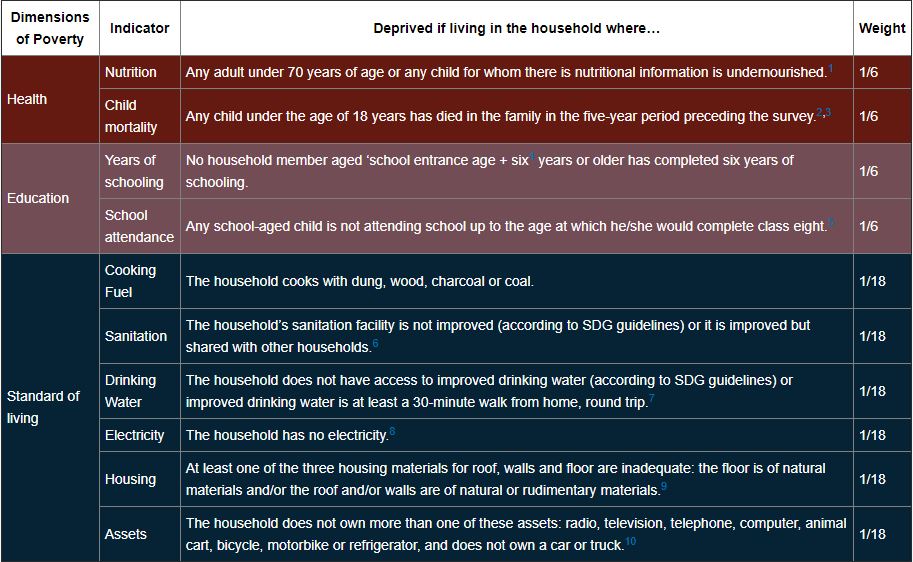 [183]
[183]
Optional Reading
The reading below from the UNDP outlines findings from a recent report on MPI.
- The 2020 Global Multidimensional Poverty Index (MPI) [183], United Nations Development Programme
OPTIONAL - Happy Planet Index
The Happy Planet index takes into account both well-being (they use the same metric as the Happiness Index), life expectancy (like the HDI), and inequality of outcomes. The higher your well-being and life expectancy, the higher your score. Inequality is expressed as a percentage, with a higher percentage meaning more equal outcomes. But what is unique about the Happy Planet Index is that it divides by the ecological footprint, so a higher ecological footprint will result in a lower score, and vice-versa. Nic Marks created this index. He describes it in the short (1:54) video below.
To View Now
Everybody wants to live a good life and I presume we want people in the future to live good lives. We created that the happy planet index really to highlight the tension between creating good lives now and good lives in the future.
Because we think people should be happy and the planet should be happy, why don't we create a measure of progress that shows that? And what we do is we say that the ultimate outcome of a nation is how successful is it at creating happy and healthy lives for its citizens? Economic activity tends to be taken as a sign of the sort of strength and power of a nation and yet all it is, is just economic turnover.
What the happy planet index does is, it takes two things, really: it's looking at the well-being of citizens in countries and then is looking at how many resources they use.
It creates what we'll call an efficiency measure: it says how much well-being do you get for your resources? It's like a miles per gallon, bang per buck indicator.
Running horizontally on the graph, ecological footprint is how much pressure we put on the planet. More is bad. Running vertically upwards is a measure called happy life years. It’s like a happiness adjusted life expectancy, and the yellow dot there you see is the global average.
The challenge really is to pull the global average up here. That's what we need to do. And if we're going to do that, we need to pull countries from the bottom, and we need to pull countries from the right of the graph, and then we're starting to create a Happy Planet.
You can download the report, you can check out your own personal HPI score. That’s the first global index of sustainable well-being.
To Read Now
Read about the Happy Planet Index [187] here, including how it is calculated and its limitations. You may want to browse the data here [188]. You are welcome, but not required, to watch the TED talk.
Optional (But Strongly Suggested)
Now that you have completed the content, I suggest going through the Learning Objectives Self-Check list at the top of the page.
Social and Environmental Justice
Learning Objectives Self-Check
Read through the following statements/questions. You should be able to answer all of these after reading through the content on this page. I suggest writing or typing out your answers, but if nothing else, say them out loud to yourself.
What do the following terms mean, and how do they relate to social justice?: political rights/opportunities, social rights/opportunities, economic rights/opportunities.Social justice is considered by many to be a controversial topic. Go ahead and Google "social justice" and you'll probably see as many negative than positive stories and videos. However, the concept itself is actually not very controversial - it is the application (or at least proposed application) that is. There is no single definition for social justice, but take a moment to think about the definition of social justice from the National Association of Social Workers [189], who provide a good, concise definition:
Social justice is the view that everyone deserves equal economic, political and social rights and opportunities.
Ultimately then, social justice is about equal rights and opportunities, which is a near-universal ideal of democratic and moral societies. Not so bad, right? But let's unpack that definition a little before we move on.
First, it is important to point out that they use the word everyone. This seemingly innocuous word actually lies at the core of social justice! I'm sure you can think of many historical and contemporary examples of unequal rights being granted to groups of people. Examples abound of discrimination against people of certain ethnicities, races, religious beliefs, sexual orientations, income levels, genders, and more. Social justice requires such characteristics and qualities have no bearing on rights and opportunities.
Political Rights and Opportunities
Alright, so let's start with the easiest of the three components: political rights and opportunities. The most obvious aspect of this is having the right to vote. In the U.S., almost every citizen has the right to vote. There are exceptions to this, such as some states not allowing convicted felons to vote [190]. However, keep in mind that black American men were only granted the right in 1869 [191] (though things such as poll taxes prevented them from fully participating for decades), and women were not afforded this right until 1920 [192] (seriously!).
But just because you have the right to vote does not mean you have an equal opportunity to vote. This is an important distinction to make. A prominent example is that black Americans were not fully given the legal opportunity to vote until the Voting Rights Act of 1964. And even now there is a lot of controversy surrounding what many think are efforts to suppress votes in the U.S. [193], particularly in low-income and minority communities, and particularly since the 2020 election season. Even the fact that the U.S. presidential election is held on a Tuesday (early voting notwithstanding) is pointed to as unfair to people who don't have the job flexibility to miss work. In short, if people are not given reasonably good opportunities to vote, then social injustice may be occurring.
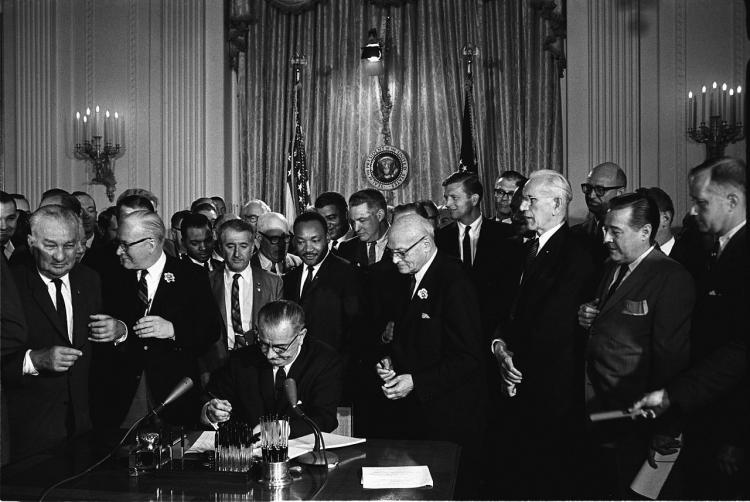
But this is only voting! What about political power and influence in general? Perhaps the most obvious example is that the U.S. has never had a woman president and the first black (or any person of color) president was elected in 2008. Obviously, this has not occurred due to complete absence of qualified female or non-white candidates. Again, they had the right to be president but it would be hard to argue that they had an equalopportunity to do so as a white male. The influence of money in politics is an important social justice issue because generally speaking those with more money are generally granted more political power. The money spent on political lobbying alone has been more than 2 billion (yes folks, that's billion with a "b"!) dollars every year since 2003 [195]. And that does not include the money spent on advertisements and other political activity. Nowadays it costs on the order of 1 billion dollars to get elected president of the U.S., and thousands or hundreds of thousands for even local offices. All of this results in political power being at least partially tied to how much money one has. Again, this is socially unjust.
Please keep in mind that lack of political rights and opportunities is an important international issue as well. Some extreme examples include the fact that 99.7% of all eligible voters [196] voted for the North Korean Communist Party in 2015, that the 2013 elections in Zimbabwe were considered a total sham [197], and the 2017 election in Venezuela was essentially rigged [198]. Voter intimidation can be a major problem in many parts of the world, and minorities and women are barred from voting in some areas of the world.
Economic and Social Rights and Opportunities
So what is meant by having equal economic rights and opportunities? This is a little more difficult to define, but essentially it means that everyone has reasonable access to rights and opportunities that can result in economic security and stability. This does NOT mean that everyone should have equal income! But what it does mean is that who and where you are should have no bearing on your ability to achieve at least a reasonable level of economic security. It is difficult to disentangle this from social rights and opportunities because they heavily influence each other. Social rights include things like education, safe neighborhoods, health care, legal protection, access to transportation, access to healthy food, freedom to practice religion, and more.
Economic and social rights often overlap. Without adequate education, it can be difficult to obtain a good job. But if your parents don't have a good job, then it may be difficult to access good education. In the U.S. health care is obviously a big issue, as nearly 29 million Americans lacked insurance in 2019 [199], and one of the major concerns about the Covid-19 pandemic (well, in the U.S., anyway, since we are one of the few industrialized countries that ties health insurance to employment) is that tens of millions of people will lose their health insurance because of unemployment. Being unhealthy or sick can make it difficult to find and/or maintain a job, and not having a good job can reduce access to good health care (in the U.S. anyway). Job opportunities are usually more difficult to come by in low-income areas, as is access to healthy food.
Disparities in policing tactics have become an important topic recently in the U.S., and studies like this one from the Center for Policing Equity [200] indicate that statistically speaking minorities are often treated differently than others. The authors note that this supports previous research. A study in 2013 [201] found that sentences of black men were around 20% longer than those given to white men for the same crimes, and another study was done in 2017 [202] that found it was still 20%. The U.S. (and many other countries) have very fair laws on the books, yet access to high-priced lawyers often impacts outcomes.
Please note that this is in no way an indictment of individual law enforcement or legal officials, or on their professions in general. But it does indicate that social rights and opportunities are not equal across racial and socioeconomic divisions.
 [203]
[203]
| Group | Percentage 1980 | Percentage 2015 |
|---|---|---|
| All | 12.2 | 15.6 |
| White | 8.7 | 10.8 |
| Black | 29.4 | 27.1 |
| Latino | 23.2 | 24.5 |
| Asian or Pacific Islander | 12.6 | 12.7 |
| Native American | 27.4 | 28.4 |
| Mixed/Other | 18.6 | 19.5 |
| People of Color | 26.0 | 23.4 |
Of course, this is a problem in many parts of the world, some examples more blatant than others. The Economist Magazine [205] points out that women in Saudi Arabia were only allowed to become lawyers in 2012, and only in December of 2015 were they allowed to run for local office. Despite these recent rights being granted, it is still frowned upon for women to drive. They point out that banks have separate entrances for men and women, and that women are barred from certain public locations. In Russia, peaceful protesters are often intimidated [206]and/or arrested [207]. The Chinese government is known to discriminate against ethnic minorities, imprison political dissidents, and detain and harass other activists [208]. And minorities are disproportionately affected by poverty throughout the world.
This is of course not meant to be a comprehensive list, but hopefully, it provides a "feel" for what social justice and injustice entail.
Environmental Justice
Environmental justice is very closely related to social justice. It can be thought of as "the fair treatment and meaningful involvement of all people, regardless of race, color, national origin, or income, with respect to the development, implementation, and enforcement of environmental laws, regulations, and policies" (source: U.S. Department of Energy [209]). Things like clean air, a safe water supply, and natural areas to enjoy are not available to all. In short, environmental benefits ("goods") and burdens ("bads") are unevenly distributed. And like almost all inequality-related issues, it is the least powerful among us that are disproportionately burdened. In the U.S. the most often happens to communities of color and low income members of society in general. The short video below does a great job of illustrating this phenomenon.
To Watch Now
Environmental Justice (4:32 minutes)
Where we live in society plays a huge role in the environmental benefits and risks that we're exposed to. And, I'm gonna actually draw in different parts of society by using this line which represents a spectrum of society. On the right hand side I'm gonna draw part of society that experiences higher poverty and also incorporates the often disadvantaged racial and minority groups. On the left hand side I'm gonna draw a much wealthier part of society. One of the things that we know is that living areas that experience high poverty and have a lot of racial minorities often have few environmental benefits compared to the wealthier part of society. What do I mean by environmental benefits? I mean green spaces, parks, recreational areas. What does that look like? Well let me draw it for you, using this triangle. This is supposed to represent environmental benefits. And one of the things we can see is that the wealthier part of society has much higher benefits than the high poverty and racial minority part of society. And as I mentioned, those benefits include things like parks, bike paths, and other green spaces. So one part of society seems to be getting a lot of benefit while another part of society seems to not be getting as much benefit. But what the high poverty and racial minority part of society does get, it does get something, and what it does get, it gets a lot of environmental burden.
So what does that look like? This line is actually supposed to represent increasing burden. So compared to the high income part of society the high poverty and racial minorities get increasing burden. And this includes things like waste facilities, manufacturing and factories, energy production, and transportation facilities such as airports. And one of the things we have to consider is that these are disadvantaged populations, they are really at risk because they're disadvantaged in many ways. They often have few alternatives in terms of where they work and where they live. They may have little awareness of the risks they may face being exposed to various environmental risks or pollutants or chemicals. They may also have other pressing issues, meaning that environmental issues are low on their agenda and let us contrast that to the wealthier population. The wealthier population may very well be more politically powerful, they can also be economically powerful, literally being able to demand that the environmental beneficial facilities are placed close to them, and the burdensome facilities are placed far away. And being able to control things like laws and regulations to benefit them more so than the other communities. And they can also be better represented in environmental groups or lobbying groups. Now this is all of significance when we consider that the high poverty groups and racial minorities may have health problems such as asthma or obesity, because we know conditions like asthma have got strong correlations to environmental issues such as pollutants, particles and ozones, and these are part of the environmental burdens that these populations face. And also when we consider obesity, obesity can be thought of as a lack of access to safe recreational facilities where people can exercise. So a lack of access to environmental benefits, and lack of access to affordable grocery and shopping facilities. The big concept here, that I want to write down is the concept of environmental justice. And what this concept really looks at is that there is a fair distribution of the benefits and burdens, of the environmental benefits and burdens within society, across all groups. And as we can see here, that is clearly not happening at the moment, and much action still needs to be taken.
You may have caught the narrator's definition of environmental justice:
A fair distribution of environmental benefits and burdens across all groups.
This sums it up quite well, though it does leave the door open for some wiggle room in what it specifically means. Take another look at the definition. Do you see anything that might be open to interpretation? How about the word "fair"? This is most definitely open to interpretation, but perhaps that is done on purpose. Similar to the economic aspect of social justice, it is not reasonable to think that everyone will have the equal access to all environmental goods and equal exposure to all environmental bads. But what we can strive for is to try to provide equal opportunities to access for everyone. The goal should be to make sure that everyone has an equal share of the environmental benefits and burdens in society. Many in the Environmental Justice movement believe that we should try to eliminate all environmental burdens, but at least they should not be dispropotionately forced upon disempowered communities
To Watch Now
The video below, China - World's dumping ground for electronic waste (4:02 minutes) illustrates one concept related to environmental justice.
KRISTIE LU STOUT: In 2010 China became the largest exporter in the world, but with the increased popularity of smartphones, tablets, and other gadgets, China also become a major importer of electronic waste. Much of the world's old electronics end up and family run workshops in China, but as the country's wealth grows it's not just foreigners adding to the stockpile of e-waste.
IVAN WATSON: Did you ever wonder what happens to your old computer or TV when you throw it away? Chances are some of your electronic junk ends up here in China, the world's biggest dumping ground for electronic waste. Electronic waste or e-waste arrives by the truckload to a southeastern Chinese town called Guiyu where locals are experts at ripping apart electronic trash. There are e-waste disposal businesses here on nearly every street and in mom-and-pop operations like this workers rip apart the appliances and pull out the most valuable elements and components for resale to future manufacturers. They worked fast identifying and sorting plastic with the help of a flame. The women here tell us all the trash is foreign even though Chinese law bans the import of electronic waste. The most valuable electronic guts like circuit boards are separated and the rest treated like some giant plastic harvest. Workers take piles of plastic chips and mix them into what looks like a synthetic stew. The men here say this plastic will be resold to the company Foxconn which makes parts for Apple's iPhone. Guiyu be one of the world's largest informal recycling operations through e-waste, but it is dirty, dangerous work.
MA TIANJIE (CAMPAIGN MANAGER OF GREENPEACE): When recycling is done in primitive ways like what we have seen here in China with the electronic waste it, it, is hugely devastating for the local environment.
IVAN WATSON: Greenpeace says the water and air in Guiyu is terribly polluted. I am walking on flat screams these come from laptops or from computer monitors or, or video TV screens and they can contain a highly toxic chemical, Mercury, and you can see how those chemicals could then seep into the environment and even into the food supply of nearby livestock. Locals insist it's cleaner here than it used to be.
GUIYU LOCAL: When my family moved here six years ago this place was flooded with trash, but now it's much better. The authorities crack down pretty hard and ban people from burning plastic.
IVAN WATSON: But talk to someone who doesn't rely on e-waste to make a living and you get a very different story. Do you guys drink the water here? These migrant farmers say they don't dare drink the water and one of them has a shocking admission.
MIGRANT FARMER: It may not sound nice, but we refuse to eat this rice that we plant because of all the pollution. We don't know who ends up eating this rice.
IVAN WATSON: Workers here complain their business has been hurt by a crackdown on e-garbage smuggled in from the US, Europe, and other Asian countries, but as Chinese consumers become more wealthy the country is increasingly generating its own electronic waste. That puts new pressure on China as well as the rest of the world to figure out a cleaner, safer way to dispose of all this electronic junk.
As indicated in the video, electronic waste (e-waste) contains toxic chemicals such as mercury, but can also contain dangerous chemicals such as lead and chromium, as well as fire retardants and other carcinogens. So what makes e-waste an environmental justice issue? It is not made explicit in the video, but as pointed out by the National Institutes for Health in a 2015 study: [213] "Communities with primitive, informal recycling operations tend to be populated by poor people with scarce job possibilities who are desperate to feed themselves and their families, and this primary concern overrides that for personal health and safety" (emphasis added). And this is not just a problem for China! The same authors indicate that this is also a major problem in India, Pakistan, Malaysia, Thailand, the Philippines, Vietnam, Ghana, and Nigeria. Think of it this way: Can you imagine a wealthy suburb allowing toxic chemicals to be released in open fields, and next to food growing operations?
Final Note
Social and environmental justice issues are present all over the world, including in the U.S. It appears that some progress has been made, but that there is still some work to be done. Circling back to the beginning of this section, can you think of any reasons why social justice is a controversial issue? Recall that I indicated that the application of social justice is the main problem. Take a minute to review the injustices described, and think about how they could be remedied. It is important to point out that by their very nature, fixing social justice issues requires altering the power structure of a given area or society. When women and black Americans were given the right and opportunity to vote, it reduced the power of white males. If lobbying activity is restricted, the companies they work for would have less influence. If women are granted equal rights in Saudi Arabia, men have less influence. Additionally, most solutions require new government regulations. All of the solutions in the examples above require(d) new laws/regulations to be passed. The most likely solution to e-waste, for example, is a ban on the export of e-waste or the required (by law) responsible recycling of e-waste. And the list goes on.
There are other reasons that social and environmental justice solutions can be controversial, but these two lie at the core of the opposition.
- First and foremost, it is difficult to alter power structures. Those with power tend to try to hold onto it, and because they are already powerful, it can be difficult to stop them.
- To a lesser degree, there is often a strong ideological resistance to new regulations.
Further complicating matters is that the root cause of many of these problems cannot easily be fixed, even with the best-intended policies. For example, urban and rural poverty - both in the U.S. and abroad - is a complex, deep-seated problem that does not have an easy solution. There is no "magic bullet" to fix them. It's difficult to blame businesses for wanting to locate in wealthier areas where people have more money to spend. And it's hard to blame people desperate for income for engaging in dangerous work like e-waste recycling. And what would happen if the e-waste was banned? What would the people who rely on those jobs do?
Finally, it is very important to note that providing equal opportunity sometimes requires what some would consider "unequal" treatment. For example, many social and environmental justice organizations provide more resources to low-income individuals than those with higher incomes. This can seem unfair to those not eligible for benefits. ("Why won't the government subsidize my housing and childcare?" "Why do I pay more taxes, just because I've made more money through my hard work?") This is a complicated issue, and I don't claim to have THE answer. I can understand why people feel that way, in particular, becaue of the (oversimplified and generally incorrect) political and social narratives they may be fed (e.g. people are poor because they don't work hard enough). But, the goal of those concerned with social/environmental justice is to provide equal opportunity for all people, and there is wide recognition that many people are born at a disadvantage through no fault of their own. In general, social justice advocates err on the side of providing extra assistance and/or helping empower all who might need help, regardless of how they got into their circumstances. We live in a VERY unequal world, and those concerned with social justice want to change that.
Charles L. Robbins said in his TEDx talk [214] that "social justice is a place where everybody's free to achieve everything that they are capable of doing...where there's an even playing field for everybody." I think it's difficult to argue against this concept, even if the application is fraught with difficulty. There are a lot of difficult questions to answer when social and environmental justice solutions are posed. But striving to achieve this justice is an important aspect of sustainability. And please keep in mind that we have barely scratched the surface regarding these issues. I recommend exploring them further, as they are prominent topics in sustainability.
Check Your Understanding
Which of the 3 E's does social and environmental justice most strongly address and why?
Optional (But Strongly Suggested)
Now that you have completed the content, I suggest going through the Learning Objectives Self-Check list at the top of the page.
OPTIONAL EXTRA CREDIT - Energy Return on Energy Invested
Learning Objectives Self-Check
Read through the following statements/questions. You should be able to answer all of these after reading through the content on this page. I suggest writing or typing out your answers, but if nothing else, say them out loud to yourself.
Net Energy and Embodied Energy
We're on a roll [215], so let's continue with the "budget" theme. In Lesson 1, you learned that energy sources contain a certain amount of energy. In Lesson 1, you also learned that there are 3412 Btu in a kilowatt hour and ~125,000 Btu in a gallon of gasoline. But that only tells part of the story. Almost all energy sources require energy inputs in order to get them to the end user. Let's take that gallon of gas as an example. How was energy used to get that gallon of gas to you and your car? Think about where it came from and how it got there, and what happened in between, then read on.
Gas is a product of petroleum (oil). Most oil comes from the rocks in the ground (tar sands [216] notwithstanding), and this oil is accessed by drilling. Drilling requires energy, as does transporting the oil to a refinery, refining the oil to make gas, and transporting the gas to the gas station. Every step in this process requires energy. The important thing to consider is that if you can determine the amount of energy required to get that gallon of gas to you, and subtract that from the energy you get from the gas, you will have net energy.
It is important to note that it does not matter which form energy is used in this process (electricity, natural gas, oil, etc.), only how much is used. (Remember that we can calculate total energy used by converting to common units!) This "invisible" energy used prior to the end use is usually referred to as embodied energy.
Embodied energy is used for most energy sources, even renewables. For example, wind turbines and solar panels must be manufactured, their components mined or otherwise processed, then they must be installed using energy, etc. Note that embodied energy can actually be stated for just about anything - remember from Lesson 1 that most food required energy to be planted, grown, shipped, and/or processed. All of this represents embodied energy.
Net energy can be calculated as follows:
- net energy = end use energy - embodied energy
Net energy is a good start, but it can get confusing if you analyze different quantities of energy. This is because the net energy depends significantly on the end use energy amount, but that is not the whole story. Let's look at an example. On average you get about 20 times more energy out of gasoline (end use) than was put in (embodied). In other words, the embodied energy in a gallon of gas is about one-twentieth (1/20) of the end use energy (source: Hall, Lambert, and Balogh, 2014 [217]). The net energy for 1 gallon of gas would be (Math alert!):
- Since a gallon of gas is ~125,000 Btu, the average embodied energy is 20 times less:
- 125,000 Btu/20 = 6,250 Btu.
- The net energy for one gallon of gas, using these assumptions, would be:
- end use energy - embodied energy = net energy
- 125,000 Btu - 6,250 Btu = 118,750 Btu.
But what if you get 10 gallons of gas?
- The end use energy is:
- 125,000 Btu x 10 = 1,250,000 Btu.
- The embodied energy is:
- 1,250,000 Btu/20 = 62,500 Btu.
- The net energy for 10 gallons of gas would be:
- 1,250,000 Btu - 62,500 Btu = 1,187,500 Btu.
As you can see, net energy is highly dependent upon the end use energy amount being considered. There is a huge difference between 118,750 Btu and 1,187,500 Btu, but those numbers are actually telling the same story.
Energy Return on Energy Invested (EROI)
You can avoid this confusion by calculating the energy return on energy invested, or EROI. EROI is defined by the Encyclopedia of Earth thusly:
Energy return on investment (EROI) is the ratio of the energy delivered by a process to the energy used directly and indirectly in that process.
Credit: Encyclopedia of Earth [218]
Here is the equation. (Note that "Quantity of energy supplied" is the same as end-use energy and "Quantity of energy used in supply process " is the same as embodied energy.):
Credit: Encyclopedia of Earth [218], CC BY-SA 2.5
Because it is a ratio, the end use amount does not matter, because it all balances out in the end. Let's look at the gasoline example from above using this equation:
- EROI of 1 gallon of gas: 125,000 Btu/6,250 Btu = 20
- EROI of 10 gallons of gas: 1,250,000 Btu/62,500 Btu = 20
No matter how much gasoline you analyze, you will come up with the same EROI if the assumptions are the same. As noted above, EROI is relevant to almost every energy source. The higher the EROI, the more energy you get out for every energy unit you put in. Calculating EROI often requires using a lot of assumptions, but since this is an important issue, many attempts have been made to calculate it. The article below indicates some of the complexities and uncertainty in calculating EROI, but the authors are able to arrive at general conclusions since they analyzed a number of peer-reviewed research papers on the topic.
Suggested Reading
The article below is from Energy Policy, which is a highly regarded journal. I suggest reading the sections indicated below. You are welcome to read the full article, but that is not necessary. Please note that you do not need to spend a lot of time thinking deeply about the content. Just read through the indicated sections to at least get the gist. The questions at the end of the lesson are designed to highlight key elements.- Highlights
- Abstract
- Section 1: Introduction
- Section 2: Meta Analysis of EROI for various fuel sources
- Section 7: Policy Implications
Link to article: EROI for different fuels and the implications for society. Hall, C.A.S, Lambert, J.G., and Balogh, S.B. Energy Policy, 64, pp. 141-152 [219].
When a Barrel of Oil is Not Really a Barrel of Oil
If you read the article, you should clearly see that not all barrels of oil are created equally. The figures below (from the article) indicate the average EROIs of different energy sources. Note that oil and natural gas are lumped together, because they are often extracted together. The authors are careful to point out that these values should not be taken at "face value," but that they are a good indication of the relative EROIs of different sources.


- Above 75 EROI: Hydroelectric
- Near 50 EROI: Coal
- Near 25 EROI: Oil and Gas (World), Wind
- Approximately 10-12 EROI: Oil Shale, Coal, Nuclear, Geothermal, Solar (PV)
- Near 0 EROI: Tar Sands, Ethanol from Biomass, Diesel from Biomass, Natural Gas
Why is EROI important? One of the main reasons is that EROI is more indicative of the true net energy benefit of various fuels than the end use. It takes about the energy from 1 barrel of oil to extract 20 actual barrels of "traditional" oil (it has an EROI of about 20:1), but the same amount of energy, when used to extract tar sands oil, results in only about 4 actual barrels. In other words, EROI indicates that you get about 5 times the amount of energy from traditional oil than from tar sand oil given the same amount of input.
A very interesting finding in the Hall, Lambert, and Balogh article is that oil discovery in the U.S. has decreased from 1000:1 in 1919 to only 5:1 in the 2010s, meaning we get 100 times less energy now than 90 years ago! (Essentially, we have extracted most of the "easy to get" oil, and do things like deep sea drilling now.) Getting ethanol from corn (recall from Lesson 1 that this is the U.S.'s primary source of biofuel) can require almost as much energy in as energy you get out, depending on how it is grown and processed.
EROI can help policymakers and others decide which energy source is a more efficient use of energy resources. In the context of this course, it is a particularly important consideration for non-renewable resources, because it indicates the net energy benefit of the sources.
One extremely important final thing to note: EROI only describes energy use. It says nothing about the other important impacts and factors. For example:
- Total energy available is an important consideration - if we can get something really efficiently (high EROI), but there is not a lot of it, then that may not help very much.
- Coal has a relatively high EROI but is the most polluting energy source we use.
- Hydroelectricity has a very high EROI, but if done the wrong way can have negative impacts as well.
- Tar sands, on the other hand, have both a low EROI and a very negative impact on the environment.
- Coal (like oil, natural gas, and nuclear) are non-renewable, and thus limited. (Though we are unlikely to run out any time soon for most of these, as you'll see in a future lesson.)
- All resources are available in limited locations and can be difficult to transport efficiently. Local/native resources may be more logical to use, even if they have a relatively low EROI.
In short, EROI is only one consideration to be made.
Optional (But Strongly Suggested)
Now that you have completed the content, I suggest going through the Learning Objectives Self-Check list at the top of the page.
Summary and Final Tasks
Summary
Another week of content in the books! Before you relax, make sure you complete the two required assignments listed at the beginning of this lesson. This week, we went over some of the fundamental considerations that underlie sustainability. You should be able to do the following after completing the Lesson 2 activities:
- differentiate between positive externalities, negative externalities, and non-external impacts;
- explain how externalities impact sustainability;
- analyze the impact of the social cost of carbon on economic decisions;
- identify elements of the ecological footprint;
- compare the impacts of various lifestyle choices on ecological footprint;
- analyze how ecological footprint relates to sustainability;
- differentiate between the different quality of life metrics;
- differentiate between energy return on energy invested (EROI), embodied energy, and net energy;
- examine benefits and limitations of EROI values;
- characterize the difference between growth and development;
- define steady state economy;
- analyze how establishing a steady state economy can impact sustainability;
- identify approaches to achieving a steady state economy;
- explain how Gross Domestic Product relates to development;
- identify the relationship between sustainability and various quality of life metrics;
- theorize what factors lead to a high quality of life;
- define social and environmental justice; and
- identify examples of social and environmental injustice.
The Language of Sustainability
We went over a lot of fairly heavy concepts this week. Hopefully, this list will help spark some memories of the content, both now and as we move forward:
- externalities, positive externality, negative externality, private utility, private cost, price, profit, OECD, the social cost of carbon
- ecological footprint, ecological deficit, biocapacity, overshoot, and collapse
- energy return on energy invested, net energy, embodied energy, peer-reviewed research
- sustainable growth, GDP, GNP, GDP/capita, growth, development, Herman Daly, Steady State Economy, qualitative vs. quantitative, free market environmentalism
- development, quality of life, World Bank, quality of life metrics, development indices, Human Development Index (HDI), Inequality-Adjusted HDI, United Nations, Happiness Index, Multidimensional Poverty Index, Happy Planet Index
- social justice, environmental justice, economic rights and opportunities, political rights and opportunities, social rights and opportunities
Reminder - Complete all of the lesson tasks!
You have finished Lesson 2. Check the list of requirements on the first page of this lesson and the syllabus to make sure you have completed all of the activities listed before the due date. Once you've ensured that you've completed everything, you can begin reviewing Lesson 3 (or take a break!).
Complete all activities in Lesson 2. The quiz may include a variety of question types, such as multiple choice, multiple select, ordering, matching, true/false and "essay" (in some cases these require independent research and may be quantitative). Be sure to read each question carefully.
Unless specifically instructed otherwise, the answers to all questions come from the material presented in the course lesson. Do NOT go "Googling around" to find an answer. To complete the Activity successfully, you will need to read the lesson, and all required readings, fully and carefully.
Each week, a few questions may involve research beyond the material presented in the course lesson. This "research" requirement will be made clear in the question instructions. Be sure to allow yourself time for this! You will be graded on the correctness and quality of your answers. Make your answers as orderly and clear as possible. Help me understand what you are thinking and include data where relevant.
For any other assignments (e.g., journal or discussion board), it will be helpful to look at the rubric before answering. You will see a button that allows you to view it below the assignment.
These activities are to be done individually and are to represent YOUR OWN WORK. (See Academic Integrity and Research Ethics [221] for a full description of the College's policy related to Academic Integrity and penalties for violation.)
The activities are not timed but do close at 11:59 pm EST on the due date as shown on the Course Calendar.
If you have questions about the assignment, please post them to the "HAVE A QUESTION?" Discussion Forum. I am happy to provide clarification and guidance to help you understand the material and questions. Of course, it is best to ask early.
Lesson 3: Critical Thinking and Specific Sustainability Issues
Overview
The material covered in this lesson applies a lot of the concepts introduced in Lessons 1 and 2 to specific issues related to sustainability. We could spend a whole semester on just this content, so the focus has been reduced to three areas of consideration: climate change, freshwater availability, and biodiversity. In addition, the beginning of the lesson provides some insight into critical analysis, and how to investigate the credibility of sources of information, a key concern in critical analysis.
Lesson Objectives
By the end of this lesson, you should be able to:
- utilize characteristics of critical thinking;
- analyze the credibility of information sources;
- identify characteristics of the Anthropocene;
- explain how the greenhouse effect increases the average surface temperature of the earth;
- identify evidence for anthropogenic climate change;
- analyze equity impacts of sustainability considerations, such as climate change and water scarcity;
- identify characteristics of the 6th Mass Extinction;
- explain the benefits of biodiversity;
- analyze sustainability impacts of freshwater availability;
- identify equity implications of access to fresh water; and
- apply the precautionary principle to sustainability considerations.
What is due this lesson?
Please note that the quiz can only be taken once. You have unlimited time to complete it prior to the deadline, and can save your progress and pick up where you left off at a later time. See the Assignments and Grading section of the syllabus [1] for tips on how to do this. Once you submit the quiz, you cannot change answers. All saved answers will automatically be submitted at the deadline if you have not submitted them.
| Requirement | Submission Location |
|---|---|
| Lesson 3 Quiz | Canvas - Modules tab > Lesson 3 |
| Continue posting to the Yellowdig discussion board. | Canvas - Modules tab > Lesson 3 |
| (Optional) Lesson 3 Extra credit quiz | Canvas - Modules tab > Lesson 3 |
Questions?
If you have any general course questions, please post them to our HAVE A QUESTION? discussion forum located under the Discussions tab. I will check that discussion forum regularly to respond as appropriate. While you are there, feel free to post your own responses and comments if you are able to help out a classmate. If you have a question but would like to remain anonymous to the other students, email me.
If you have something related to the material that you'd like to share, feel free to post to the Coffee Shop forum, also under the Discussions tab.
Critical Thinking
Learning Objectives Self-Check
Read through the following statements/questions. You should be able to answer all of these after reading through the content on this page. I suggest writing or typing out your answers, but if nothing else, say them out loud to yourself.
How many times have you been asked to "think critically" about an issue? Have you ever stopped to think what that really means? I think most of us innately understand what it entails, but it is difficult to put into words. I must admit that I am guilty of asking that of students without clearly outlining what I expect, but that ends today for this course! Please take a minute or two to fill out the poll below before continuing.
Fill out the poll below
- Click to respond to the following: "Define critical thinking." [222]
- After you enter your answer, click here to see the real-time results [223]. [224] You can go back to this page at a later time to see results as well. All answers are anonymous to the other students.
- See results [225]from past course sections.
Suggested Reading
What better source to look to for critical thinking advice than the Foundation for Critical Thinking? This is hands-down the best summary of critical thinking that I have seen. You are welcome to read the following, but I summarize the key points below.
- "Defining Critical Thinking [147]." The Foundation for Critical Thinking.
There is a lot to unpack here. Let's take a look at it again, with key elements indicated in bold. It is all important, really, but a few things stand out. I have numbered the paragraphs to assist in the analysis below.
Critical Thinking as Defined by the National Council for Excellence in Critical Thinking, 1987A statement by Michael Scriven & Richard Paul, presented at the 8th Annual International Conference on Critical Thinking and Education Reform, Summer 1987.
(1) Critical thinking is the intellectually disciplined process of actively and skillfully conceptualizing, applying, analyzing, synthesizing, and/or evaluating information gathered from, or generated by, observation, experience, reflection, reasoning, or communication, as a guide to belief and action. In its exemplary form, it is based on universal intellectual values that transcend subject matter divisions: clarity, accuracy, precision, consistency, relevance, sound evidence, good reasons, depth, breadth, and fairness.
(2) It entails the examination of those structures or elements of thought implicit in all reasoning: purpose, problem, or question-at-issue; assumptions; concepts; empirical grounding; reasoning leading to conclusions; implications and consequences; objections from alternative viewpoints; and frame of reference. Critical thinking — in being responsive to variable subject matter, issues, and purposes — is incorporated in a family of interwoven modes of thinking, among them: scientific thinking, mathematical thinking, historical thinking, anthropological thinking, economic thinking, moral thinking, and philosophical thinking.
(3) Critical thinking can be seen as having two components: 1) a set of information and belief generating and processing skills, and 2) the habit, based on intellectual commitment, of using those skills to guide behavior. It is thus to be contrasted with: 1) the mere acquisition and retention of information alone, because it involves a particular way in which information is sought and treated; 2) the mere possession of a set of skills, because it involves the continual use of them; and 3) the mere use of those skills ("as an exercise") without acceptance of their results.
(4) Critical thinking varies according to the motivation underlying it. When grounded in selfish motives, it is often manifested in the skillful manipulation of ideas in service of one’s own, or one's groups’, vested interest. As such it is typically intellectually flawed, however pragmatically successful it might be. When grounded in fair-mindedness and intellectual integrity, it is typically of a higher order intellectually, though subject to the charge of "idealism" by those habituated to its selfish use.
(5) Critical thinking of any kind is never universal in any individual; everyone is subject to episodes of undisciplined or irrational thought. Its quality is therefore typically a matter of degree and dependent on, among other things, the quality and depth of experience in a given domain of thinking or with respect to a particular class of questions. No one is a critical thinker through-and-through, but only to such-and-such a degree, with such-and-such insights and blind spots, subject to such-and-such tendencies towards self-delusion. For this reason, the development of critical thinking skills and dispositions is a life-long endeavor.
Source: The Foundation for Critical Thinking [147]
Let's look at these paragraphs one at a time:
- Critical thinking requires skilled evaluation of information using all manner of analytical and observational tools at your disposal. Regardless of what you are analyzing, you should use the same or similar set of skills. Critical thinking transcends the subject material.
- Critical thinking requires self-evaluation of what you know and do not know, your assumptions, the scientific basis of the problem at hand, and an analysis of the results. One aspect of this is looking at issues from viewpoints different than your own, to the extent possible.
- Critical thinking requires more than just "knowing things" and having information processing skills. You must apply this knowledge and these skills, and accept the results, whether they are the results you had hoped/expected or not.
- If you are seeking selfish (subjective) motives, you may be able to think critically, but the results will usually be flawed. You must approach the issue with "intellectual integrity," which really refers to the above three points (thorough analysis and acceptance of the results).
- No one knows everything, and everyone is subject to bias by virtue of being limited in knowledge and experience. You can be an extremely skilled critical thinker but are limited by your knowledge and experience in the topic at hand. The best critical analysis may arrive at an incorrect conclusion due to this. The flip side of this is that the more you know about, experience, and objectively analyze a piece or type of information, the more likely you are to arrive at a sound conclusion. As stated in the article: "The development of critical thinking skills and dispositions is a life-long endeavor."
They also provide a good approach to critical thinking:
A well cultivated critical thinker:
- raises vital questions and problems, formulating them clearly and precisely;
- gathers and assesses relevant information, using abstract ideas to interpret it effectively;
- comes to well-reasoned conclusions and solutions, testing them against relevant criteria and standards;
- thinks open mindedly within alternative systems of thought, recognizing and assessing, as need be, their assumptions, implications, and practical consequences; and
- communicates effectively with others in figuring out solutions to complex problems.
Source: The Foundation for Critical Thinking [147]
The following is a brief explanation of each aspect:
- raises vital questions and problems, formulating them clearly and precisely; (Did you deeply contemplate the information and ask relevant questions that help you verify it? This aspect really puts the "critical" in "critical thinking" - you should think like a scientist and question everything, even if the information reinforces your existing beliefs.)
- gathers and assesses relevant information, using abstract ideas to interpret it effectively; (Pretty self-explanatory. Search for information from reliable outside sources that helps you evaluate the information. Consider hypotheticals that test the validity of the information.)
- comes to well-reasoned conclusions and solutions, testing them against relevant criteria and standards; (Use logic to arrive at conclusions, based on the information that you have gathered and considerations you contemplated. As you did above, test these conclusions with reliable sources and standards.)
- thinks open mindedly within alternative systems of thought, recognizing and assessing, as need be, their assumptions, implications, and practical consequences; (Think about the information and your conclusion from the perspective of someone who thinks the information is wrong and/or approaches it from a different perspective. The more alternative perspectives, the better.)
- communicates effectively with others in figuring out solutions to complex problems. (Self-explanatory. If possible, do not just arrive at the conclusion on your own! Talk through it with others.)
This is all very good advice when reading through the material in this course. I am asking you to apply these principles as much as possible. Keep an open mind, and try to analyze information using evidence, logic, reason, and with an eye on alternative viewpoints. Try to recognize the limitations of your knowledge, and attempt to be self-critical with regards to biases and limited worldviews that you have. Embrace discussion with others, and try to approach discussions with the intent of learning from each other to come to a reasonable conclusion, not to convince the other person that you are correct. This is particularly important because some of the material that follows is considered controversial in some circles, largely because it does not fit with certain worldviews and social/political modes of thinking. Please do your best to look at things as objectively as possible.
To be clear, I do not claim to know all of the answers and recognize that I have limitations in knowledge. The ideas presented in this course are based on reliable evidence, but many of the issues are not clear-cut and are thus open to substantive discussion. As noted in the Orientation, respectful dialogue is encouraged, and often the best way to learn is to discuss things with someone that does not agree with you. I hope that we can have good, substantive discussions throughout this course.
One last thing and this probably goes without saying but I'll say it anyway: critical thinking should be "systematically cultivated," as stated in the reading, and applied constantly. It is useful for every human endeavor, and certainly, can and should be applied beyond this course.
Optional (But Strongly Suggested)
Now that you have completed the content, I suggest going through the Learning Objectives Self-Check list at the top of the page.
Critiquing Information Sources
Learning Objectives Self-Check
Read through the following statements/questions. You should be able to answer all of these after reading through the content on this page. I suggest writing or typing out your answers, but if nothing else, say them out loud to yourself.
As I'm sure you know, there is no shortage of information sources available to us, especially those of us with an Internet connection. We live in a unique moment in human history [226] - never before has it been so easy for so many to access so much information so quickly. But having so much available can make it difficult to determine whether or not information sources can be trusted. Engaging in critical thinking requires (among other things) knowing credible sources of information. This is an imperfect science, but there are many ways to evaluate sources. Harvard University provides a good, straightforward guide to doing this.
Suggested Reading
- "Harvard Guide to Using Sources [227]." Read through the "Questions to Ask About All Sources," "Evaluating Journal Articles," and "Evaluating Web Sources." You are welcome to read the rest of the website - there is a lot of good, relevant information there. I summarize the key points below.
I will ask you to analyze the reliability of information sources throughout the semester, so please take the time to read this thoroughly. Here are some general and additional tips:
- Always check sources! This can't be stressed enough. Any information critique that does not include this is incomplete. As indicated in a previous lesson, peer-reviewed journals are generally the most reliable information sources, but there are many reliable sources that are not peer-reveiwed. (Note that often, non-peer reviewed articles use data from peer-reviewed sources.) Consider the expertise of the author and the organization they are providing content for, especially if no outside sources are used. Keep in mind that reliable outside information can be misconstrued, purposefully or not, so it is a best practice to refer to the original soruce of information if possible.
- Always consider the author's credentials. All else being equal, someone who has spent many years analyzing a subject or has advanced training is more likely to be reliable than someone with thin credentials.
- Consider the objectivity of the language used. Does the author use language that is clearly designed to sway you one way or the other? Is it designed to elicit an emotional reaction? Or do they use objective, analytical, academica language?
- Be careful when using a source that is expressly opinion-based, e.g., in the Opinion pages of the newspaper (hard copy or online). An opinion is not necessarily wrong - there are certainly such things as "well-informed" opinions - but you should not use this as an academic reference. Opinions from people you trust are a great way to learn things, but you should not use them as unvarnished truth. Always seek to corroborate the information provided.
- As indicated by the Harvard articles, I strongly suggest corroborating factual information presented in the article elsewhere (in general, not just for opinions).
- Currency is important for some sources (especially for things like technology), but for others, it is less important (e.g., historical events, foundational theories). Use your best judgment.
- If you don't know already, do some research about the author of the article. Use Google to your advantage! You can search "<author or organization's name> bias" or "is <name> biased," etc. I strongly suggest searching for other articles/websites published by the author/organization. Oftentimes, you can click on the author's name on the website and it will link you to other articles written by them. Scan through them and see if a consistent bias (or at least worldview) is presented. It will often become obvious if someone holds a certain political/social viewpoint. There are some sites that provide bias charts and evaluations, such as the Ad Fontes Media Bias Chart [228] and All Sides Medi [229]a.
- The same advice as the previous point goes for the site owner - look through articles published on the website, and try to figure out if a one-sided viewpoint is presented. All that said, keep in mind that just because someone holds a certain worldview does not mean that the information is unusable (complicated, I know!). There are many reliable information sources (people and organizations) that hold a certain worldview. You should consider the other aspects of the information, particularly the objectivity. Also, keep a look out for consistently extreme viewpoints.
- Do NOT take a website's self-description as proof of its objectivity. I wish it were that easy! Even the most biased of sources want you to believe that they are unbiased.
- Just because a website is a ".org" and not a ".com" does not mean it is unbiased. In fact, the type of organization is pretty meaningless. There are a lot of biased non-profits out there.
Overall, understanding the reliability of sources gets easier with time. The keys are a) to keep reading and paying attention to other information sources, b) to constantly investigate the reliability of sources, and most importantly c) learn as much as you can! The more you do this, the more you will develop a "bias detector," so to speak.
This can be complicated, so here are a few scenarios that might help you as you evaluate sources throughout the course. This is not comprehensive, but provides some common scenarios you may encounter.
| Information source details | Evaluation |
|---|---|
| The information is pulled directly from a peer-reviewed journal. |
It's a good idea to google the journal to see if it's reputable or not, and you should google the author(s) as well. This is the best source of information you can use. |
| The information is NOT an opinion and is from a known reputable source (e.g., NPR, New York Times, Wall Street Journal). | Note that the source is reliable (make sure you know this for a fact), but suggested to look to verify the information elsewhere to be certain. |
| An article provides a summary of peer-reviewed research, but you are not familiar with the source and/or author. |
|
| An article seems reliable, but you are not familiar with the source and/or author. |
Follow all of the steps listed in the box above. |
| The website is a non-profit (.org). | As stated above, this is basically meaningless! There are many objective non-profits, but many biased ones. Perform the research indicated above. |
| The information comes from an academic institution. |
|
| You click on the "about" link on the organization's website, and they state that: "<name of organization> provides research-based, unbiased information about..." |
|
| The information seems reliable, but is on a site that has a known bias (e.g. Fox News or MSNBC) or is from an advocacy organization or company that might seek to promote their own interest. |
|
| The information is from a government website. |
|
| The information is on Wikipedia. | NEVER cite Wikipedia! It is absolutely fine to use it as an initial source, but ALWAYS use another, reputable source to verify the information. Wikipedia does a good job of citing their sources, so click on the citation/footnote link to find the original source, and proceed from there. I love looking up things on Wikipedia as much as the next person, but I never assume that it is accurate unless I can verify it elsewhere. |
Final Thought
Please know that you are not expected to memorize all of this! I will try to be as clear as possible when I ask you how to analyze a source. But moving forward you should always at least investigate the following when analyzing a specific information source:
- If it is an article from a peer-reviewed journal, mention that specifically. Then at least look at the credentials of the author(s) and make sure they provide citations for information that they use.
For any other article, evaluate the following:
-
Author's credentials (e.g. Do they appear to be an authority on the subject? Is their expertise relevant?)
-
Objectivity of the way the information is presented in the article (e.g. is it matter-of-fact/objective or does it use sensational/emotional language?)
-
Objectivity of the site the information is on (Investigate other articles on the website to see if their appears to be an agenda.) For example, is the article on Fox News? New York Times? Etc. Does that site have an agenda?
-
Reliability of original source material (Does the author use reliable sources? Can you find other reliable sources that have the same information? Do they cite all sources?)
Keep in mind that this is as much an art as a science! Use your best judgment based on the factors above to evaluate the source. Remember that a source can be totally reliable, totally unreliable, or all points between.
Optional (But Strongly Suggested)
Now that you have completed the content, I suggest going through the Learning Objectives Self-Check list at the top of the page.
Respecting Planetary Boundaries - Life in the Anthropocene
Learning Objectives Self-Check
Read through the following statements/questions. You should be able to answer all of these after reading through the content on this page. I suggest writing or typing out your answers, but if nothing else, say them out loud to yourself.
Before diving into specific sustainability issues, we'll get an overview of some of the key "planetary boundaries," as outlined by Carl Folke In Chapter 2 ofIs Sustainability Still Possible? As you'll see, we'll go over some of these in more detail in this lesson. One important term that Folke does not define, but is important to understand, is ecosystem services. The National Wildlife Federation [230] defines an ecosystem service as:
"any positive benefit that wildlife or ecosystems provide to people."
Examples include plants that convert carbon dioxide into oxygen, fisheries that naturally replenish themselves and feed humans, wetlands that filter toxins and mitigate storm impacts, soil organisms that foster plant growth, and bees that pollinate food crops and other plants. We could cite innumerable examples, but without ecosystem services, life on earth would not be possible. Further, much of what we depend on for survival is offered for free by nature. Most ecosystem services are performed by the biosphere, which "includes all living organisms on earth, together with the dead organic matter produced by them." (Credit: Encyclopedia of Earth [231]).
To Read Now
- Read pp. 19 - 22 of chapter 2 of Sustainability Still Possible?. "Respecting Planetary Boundaries and Reconnecting to the Biosphere." This is located in the Module tab under Lesson 3. Note that I summarize key content below.
- Skim through the most up-to-date status of the 9 Planetary Boundaries [232] and a description of each of the 9 boundaries [233]. This link takes you to the Stockholm Resilience Center, which is where the 9 Planetary Boundaries concept originated. (Not required, but you can access a downloadable, resizeable image of the Planetary Boundaries here [234].)
- "Ecosystem Services [235]." National Wildlife Federation.
The following is a summary of some key points from the readings:
- Folke starts out with a brief discussion of the biosphere, which is "the living part" of the area on and near the earth's surface.
- He points out that humans have become "a dominant force in the operation of the biosphere."
The time that we find ourselves in now is what he terms the "Anthropocene," which he defines as "the age in which human actions are a powerful planetary force shaping the biosphere."
- Note that the term "Anthropocene" is well-known in scientific circles - Folke is nowhere near alone in using it! Regardless, the unprecedented success of the human species during this time has "to a large extent...been enabled by the human ability to draw on the functioning of the biosphere." He notes that ecosystem services (e.g., "fertile soils, storm protection, and sinks for greenhouse gases and other wastes") have played an essential role in humanity's success.
- He points out that there have been many positive benefits to people, but that we are overburdening the biosphere and risk "undermin(ing) the capacity of life [236]-supporting ecosystems to...provide the essential ecosystem services that human well-being ultimately depends on."
- If we humans are to continue the success that we have realized in the past few thousand years, he believes that we need to work on reducing our ecological impact to the point that ecosystems can continue to thrive and provide essential services. In order to do this, he points to the need to measure our impact in "critical biophysical processes in the Earth's system." These are termed the "nine planetary boundaries."
- The nine planetary boundaries provide metrics that can be analyzed to determine if humans are overusing ecological capacity. They are called "boundaries" because they represent indicators of when we have crossed into dangerous territory. He is careful to point out that there is some uncertainty with some of the boundaries, but that they provide the best scientific analysis of whether or not humanity is operating within safe ecological limits.
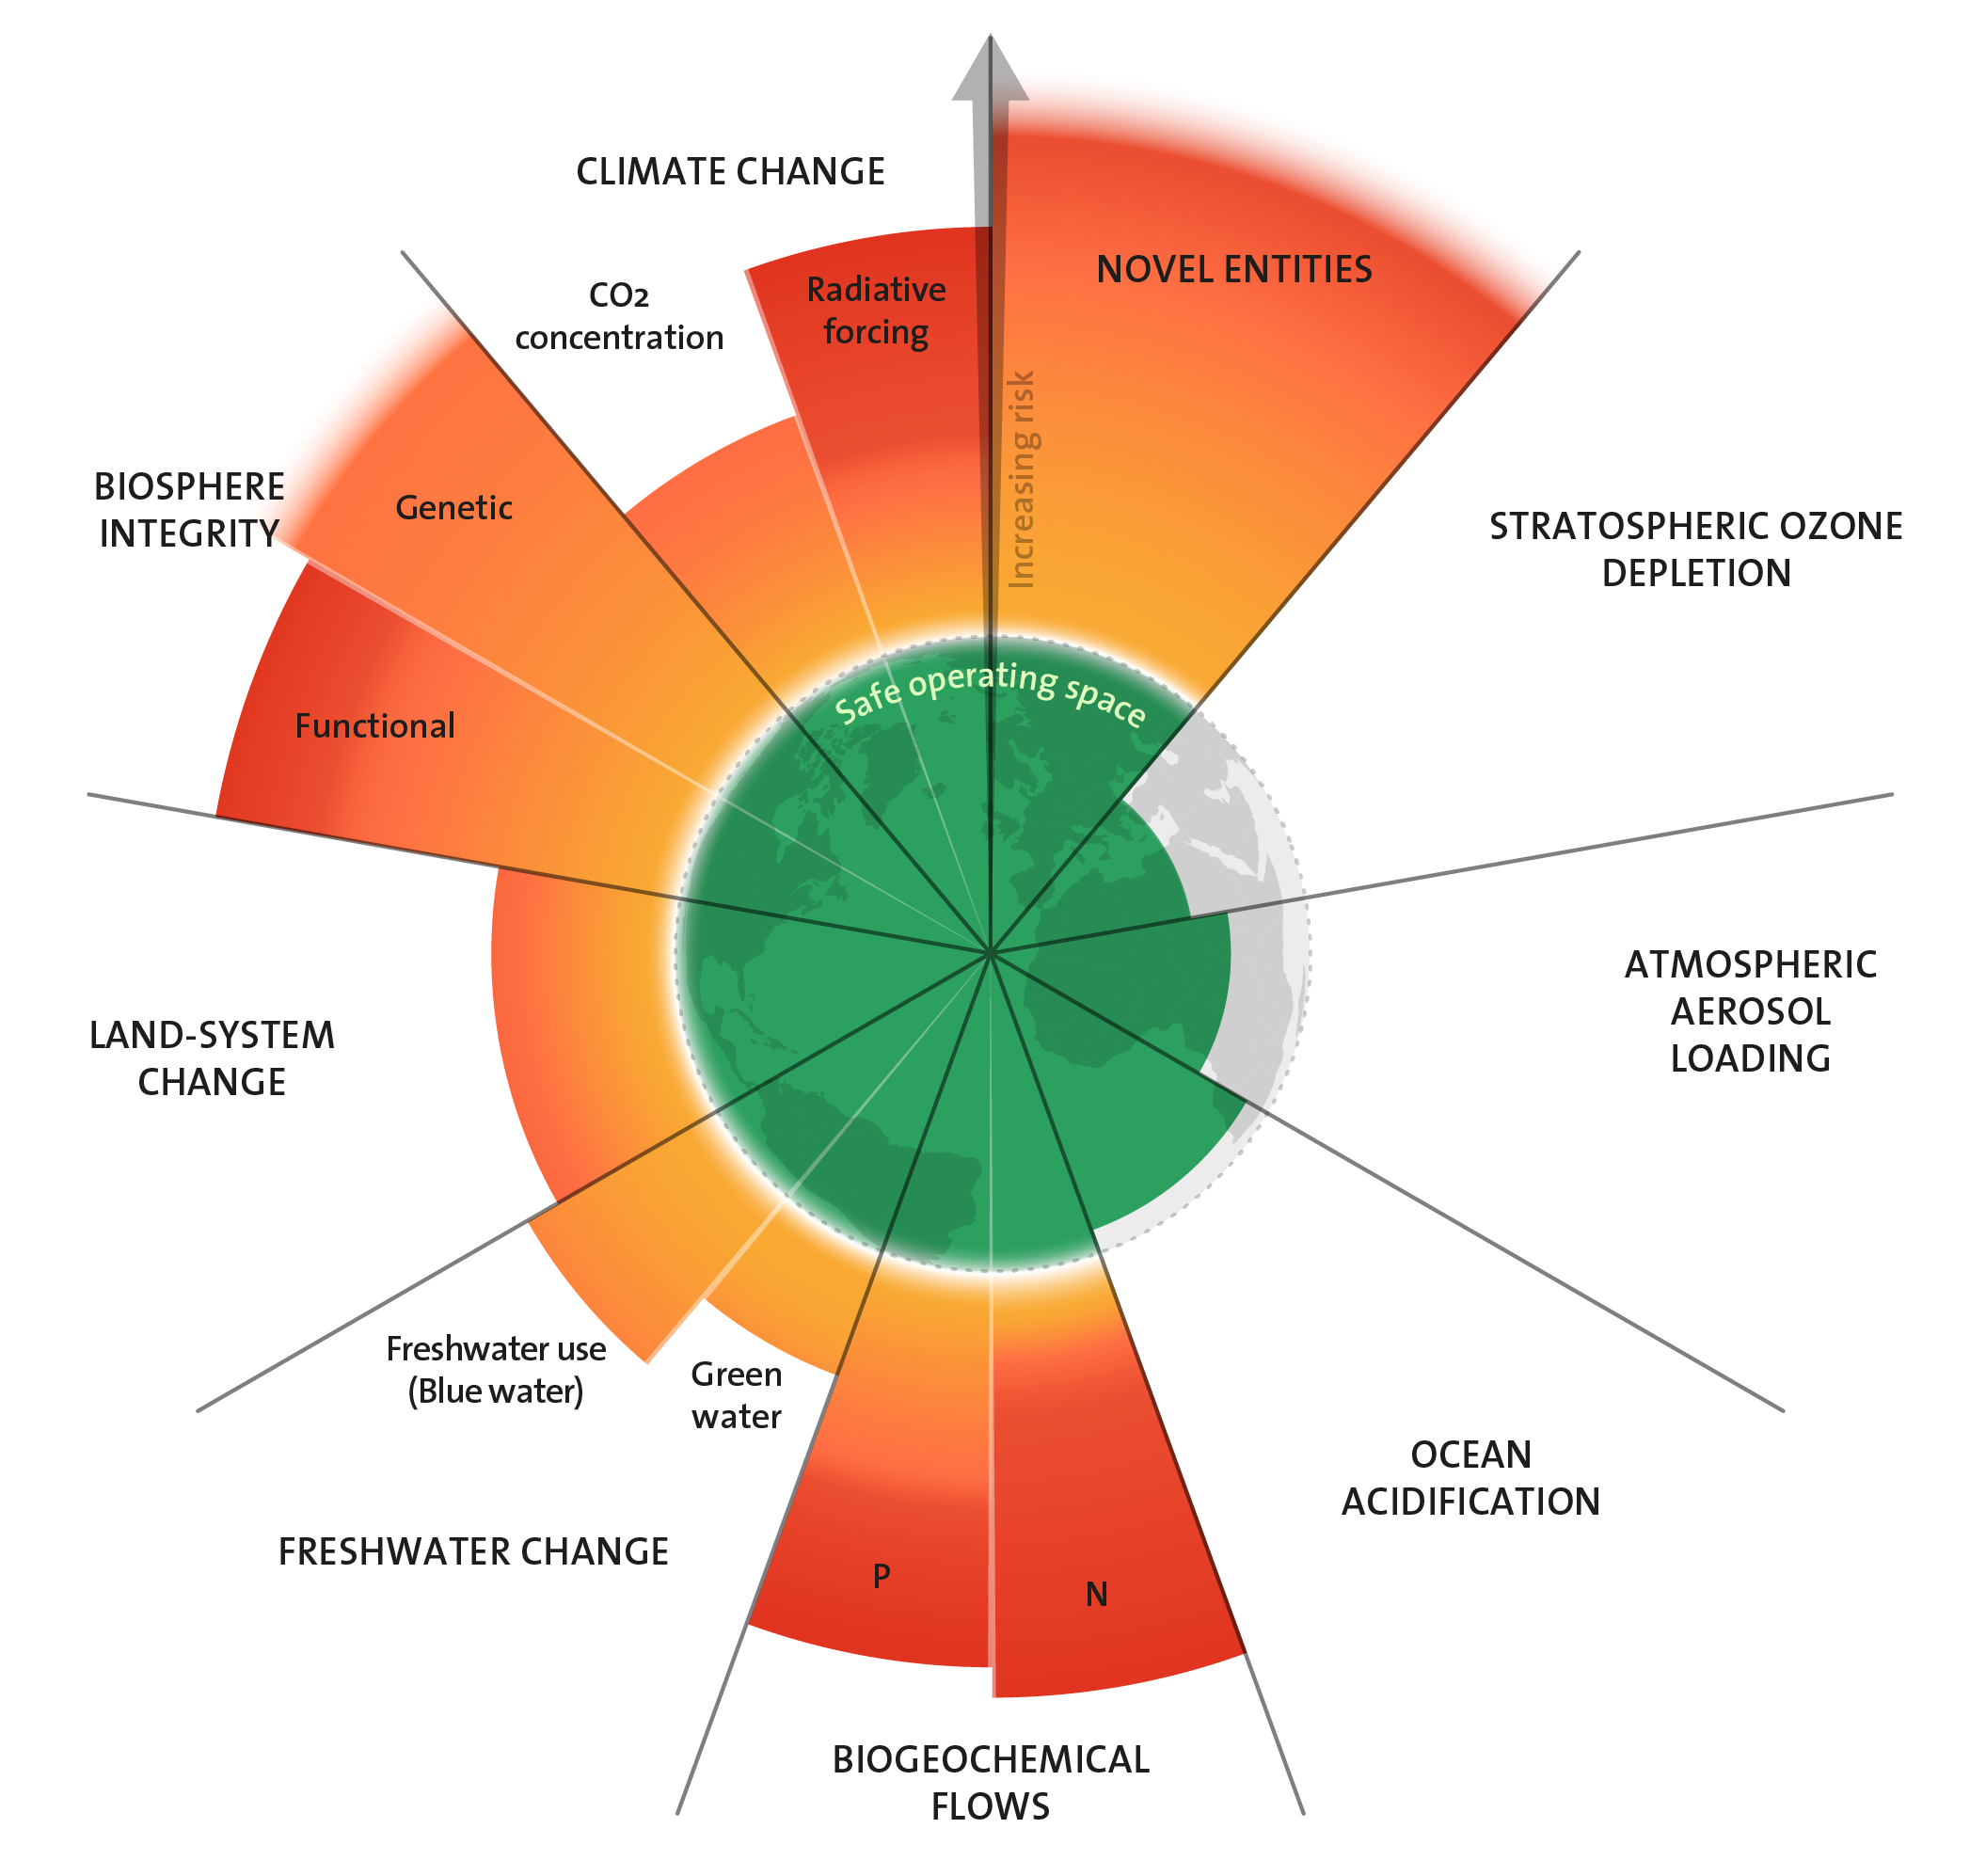
Why call it the Anthropocene?
So where does the term Anthropocene come from? You may remember the concept of the geologic time scale [238] from Geology or Environmental Science class, which is how the earth's history is separated into different time periods called eons, eras, periods, epochs, and ages. (Refer to this chart from the Geological Society of America [239] for details.)
The Holocene epoch began around 10,000 years ago, and saw the beginning of agriculture and thus permanent human settlements. The term "Anthropocene" is a deliberate reference to the fact that humans have become such a dominant force in the world that many scientists consider it to be a new geologic epoch. "Anthro" refers to "humans" (remember anthropocentric from an earlier lesson?), which is why it is referred to as the Anthropocene.
The Great Acceleration
By now you should have a sense that humans are using resources at an unsustainable rate. As we have seen previously, it is important to look at specific metrics when possible. The International Geosphere-Bioshpere Programme (IGBP) did just that when they looked at what they consider key socio-economic and earth system trends. What they found is frequently referred to as the Great Acceleration. (See the full original report here [240], if you are interested.)
Here is how they described what they found (emphasis added in bold): "The second half of the 20th Century is unique in the history of human existence. Many human activities reached take-off points sometime in the 20th Century and sharply accelerated towards the end of the century...The last 60 years have without doubt seen the most profound transformation of the human relationship with the natural world in the history of humankind." (Source: International Geosphere-Biosphere Programme [241])
The charts below provide a stark illustration of the Great Acceleration. Every indicator - world population, real GDP, foreign direct investment, urban population, primary energy use, fertilizer consumption, large dams, water use, paper production, transportation, telecommunications, international tourism, carbon dioxide, nitrous oxide, methane, stratospheric ozone, surface temperature, ocean acidification, marine fish capture, shrimp aquaculture, coastal nitrogen, tropical forest loss, domesticated land, and terrestrial biosphere degradation - took a sharp upward (upward is bad) turn sometime around the mid-20th century. Because of this, some scientists point to the mid-20th century as the beginning of the Anthropocene.
For more detailed information, see IGBP [241]. If you have trouble seeing the image, click on itfor a resizable version. You can also see each one up close in the slideshow below the image.
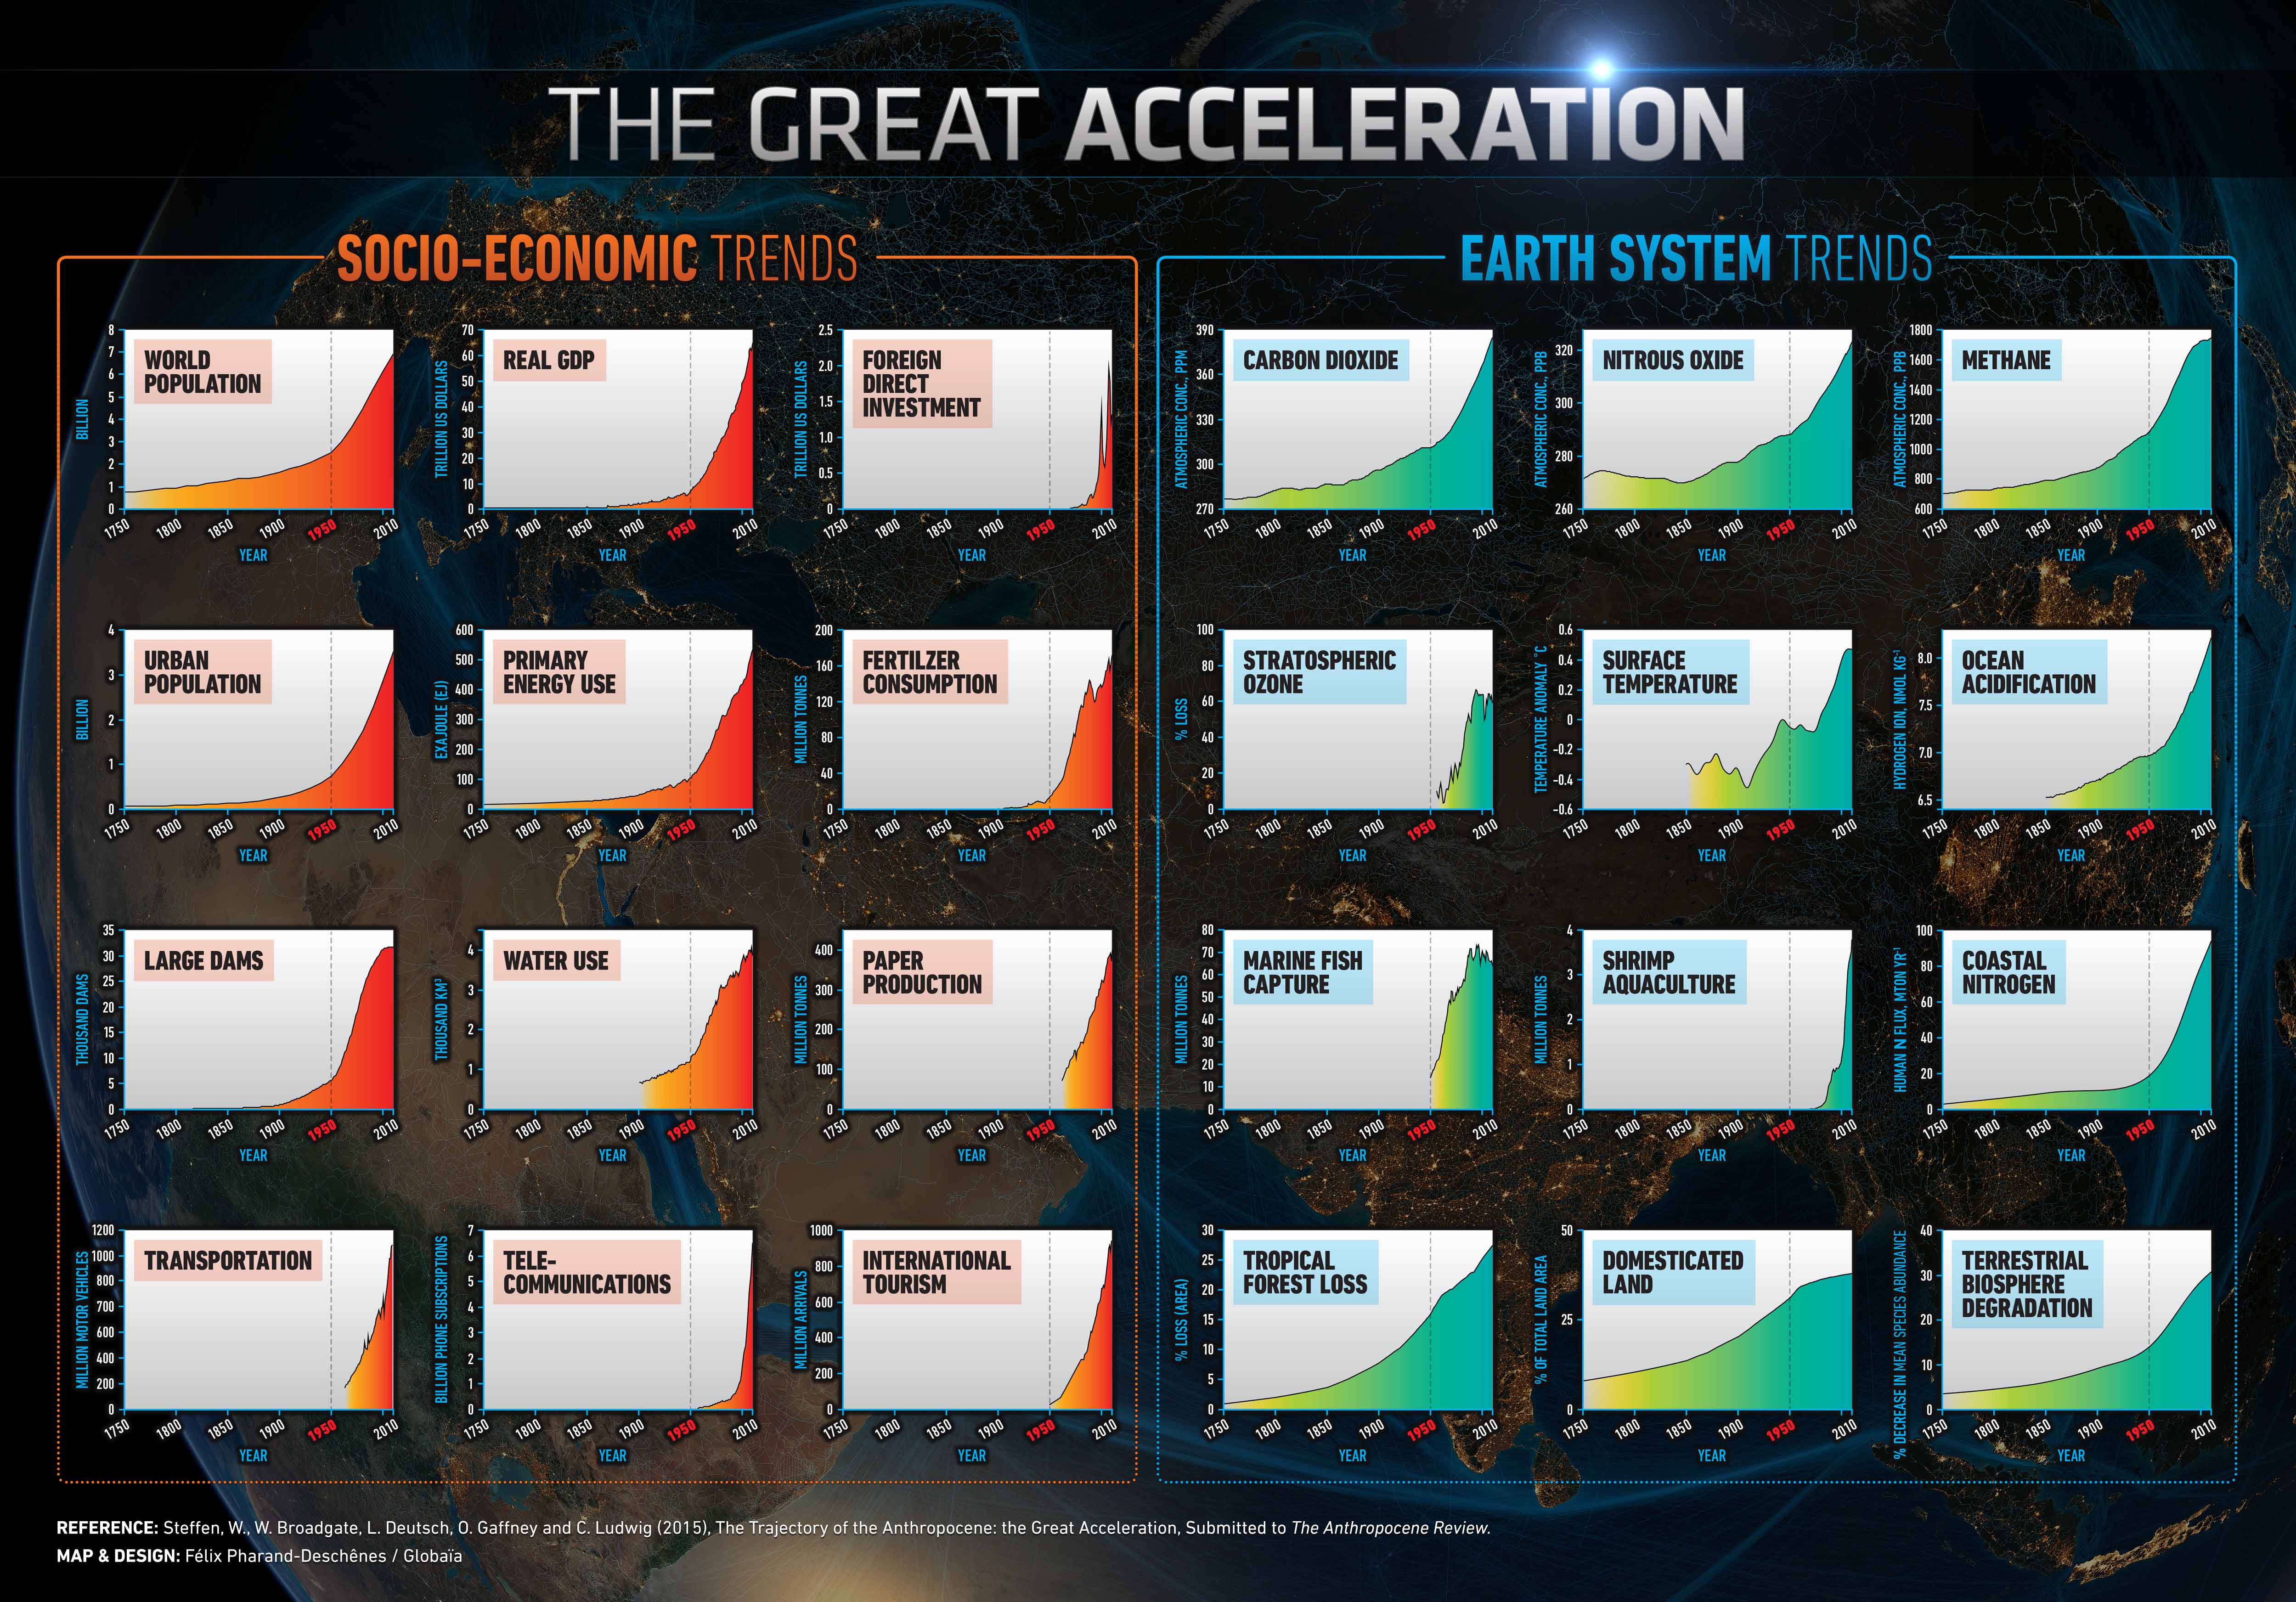
Check Your Understanding
How important are humans to the Anthropocene? Do they play a large role?
Optional (But Strongly Suggested)
Now that you have completed the content, I suggest going through the Learning Objectives Self-Check list at the top of the page.
Climate Change
Learning Objectives Self-Check
Read through the following statements/questions. You should be able to answer all of these after reading through the content on this page. I suggest writing or typing out your answers, but if nothing else, say them out loud to yourself.
We'll start with climate change for two reasons. First, of all of the specific issues in this lesson, this is the one that potentially has the most devastating impact because of the scale of the problem. If the climate continues to change, the impacts will likely be catastrophic and on a global scale. Second, climate change will likely impact all of the other sectors of sustainability and society, including all of those listed in this section. It is absolutely essential to understand climate change if you want to address sustainability. The following is a short list of facts that indicate why we should be concerned about the human influence on the climate.
First, a few important terms:
- Greenhouse effect: the term used to describe the phenomenon whereby infrared heat warms the lower atmosphere of the earth or another planet due to the gaseous content of the atmosphere.
- Enhanced greenhouse effect: This occurs when the magnitude of the greenhouse effect is enhanced by human activity, due to the emission of greenhouse gases at an unnaturally high level.
- Greenhouse gas: a gas that absorbs infrared radiation and contributes to the greenhouse effect.
- Anthropogenic: caused by humans.
- Anthropogenic climate change: the component of climate change that is believed to be caused by humans.
The following article from the U.S. National Aeronautics and Space Administration (NASA) explains a lot of the basics regarding the terms listed above.
To Read Now
Nota Bene - Climate Change is a Massive Topic
As I hope you know, climate change is a massive, complex topic. This short lesson is meant to provide an overview of some key concepts. We could spend all semester - and dozens of semesters afterward - focusing on the ins and outs of climate change and still have more to analyze. Hopefully, this will provide a good introduction to those of you who are not well-versed and some helpful reminders and deeper information for others.
There are many sources of information about different aspects of problems, solutions, myths, etc. related to climate change, and I encourage you to explore them. A few of my favorites are as follows. Feel free to share your own sources in the Coffee Shop!
- NASA climate change site [247]
- Our World in Data [248] (great visualizations)
- Intergovernmental Panel on Climate Change (IPCC) [249]
- U.S. Environmental Protection Agency [250]
- Climate Central [251]
- Center for Climate and Energy Solutions [252](C2ES)
- Yale Climate Connections [253]
- Skeptical Science [254]
Fact 1: The Greenhouse Effect is Settled Science
The greenhouse effect is a universally accepted natural phenomenon, and carbon dioxide (CO2) is one of the primary greenhouse gases. Without it, life on earth would not be possible. The video below from Stile Education provides a good succinct explanation of the basic physics behind the greenhouse effect.
Watch "What is the greenhouse effect and how does it work?" by Stile Education (3:14 minutes)
The greenhouse effect. When you see a beautiful fat full moon, do you ever imagine what it'd be like to be up there standing on its surface? Well for one thing, hot. About 120 degrees Celsius hot! But 14 days later at new moon you'd be in the middle of the long lunar night and the temperature would have plummeted to around -170 degrees.
On average the moon and earth are the same distance from the sun, so they get the same amount of solar energy. But here the average temperature is 16 degrees Celsius while on the moon it's more like minus 80. The earth has a much smaller range of temperatures too. Minus 88 and plus 57 are the lowest and highest on record. So why the difference? The answer is the atmosphere. It protects us from a lot of the sun's energy but also traps some that gets through so that, for example, at night temperatures don't fall that much. Especially if it's cloudy.
The energy that comes from the sun is electromagnetic radiation in a broad range of wavelengths. The upper atmosphere absorbs most of these wavelengths. Visible light gets through but a third of this reflects straight back out again, mainly of clouds and ice. So only half of the energy heading for earth gets to warm its land and oceans. Rock, soil, and water heated by visible light re-emit the energy as low-energy infrared radiation - heat. This can pass through the oxygen and nitrogen in the air but some gases - the so-called greenhouse gases - carbon dioxide, methane, nitrous oxide, and water vapor - have molecules with structures that make them absorb the radiation. Struck by an infrared wave they vibrate strongly before releasing the energy as a new infrared wave. This can shoot out in any direction - towards space, down to earth, or out sideways. But in every case there's a good chance that the wave will strike another greenhouse gas molecule and change course again.
Although greenhouse gases typically make up less than one percent of the atmosphere, six kilometers deep, not much escaping radiation makes it through without encountering at least one greenhouse gas molecule Over the entire planet the result of this giant pinball game is that heat stays close to the earth's surface for longer than it otherwise would, keeping it warmer this is the greenhouse effect. Without it earth would have an average temperature of minus 18 degrees Celsius. Which is better than the moon but I, think you'll agree not as good as what we've got.
In a nutshell:
- Greenhouse gases (GHGs) allow visible light (shortwave radiation) to pass through them but absorb infrared (longwave radiation) and re-radiate it in all directions after they absorb it. This is simply a physical property of certain gases. Nature just doing its thing.
- Sunlight is mostly shortwave radiation, so passes through the GHGs on its way toward the earth's surface.
- If the shortwave radiation is reflected on or near the earth's surface (e.g., clouds, water, physical objects), it passes back through the GHGs, because it is still shortwave. It goes back out to space.
- If the shortwave radiation is absorbed on or near the earth's surface (e.g, by your skin, water, soil, other surfaces) then it is radiated as longwave radiation. (This is radiant/electromagnetic heat transfer that was mentioned in Lesson 1, by the way!)
- If this longwave radiation hits a GHG molecule on its way out, it is absorbed and re-radiated in all directions.
- Some of that longwave radiation (about 50%) heads back toward the earth's surface. This results in warming that would not occur if the GHGs were not in the atmosphere.
The following gases contribute to the greenhouse effect: water vapor (H2O), carbon dioxide (CO2), methane (CH4), nitrous oxide (N2O), and chlorofluorocarbons (CFCs). There are a lot of details about each, but the main focus of anthropocentric climate change are carbon dioxide and methane, because they play the largest role in the climate impact that most scientists believe humans are having.
Note that methane is considered approximately 30 times as powerful [257] as carbon dioxide in terms of causing increased warming (over a 100-year period). Methane is the primary component of natural gas and is what gives natural gas its energy. If natural gas is burned, it releases about half as much CO2 as if you burn an equivalent amount of coal. But if natural gas leaks or is otherwise emitted, it is about 30 times more potent than carbon dioxide. Despite this, carbon dioxide reduction is the main focus because it is far and away the biggest contributor to anthropogenic greenhouse gas emissions impact.
Good to Know: Why does the sun emit mostly visible light?
It was mentioned in the video above that the sun emits most of its radiation in the visible spectrum. This is due entirely to its surface temperature. Every object with any temperature above absolute zero emits electromagnetic radiation in a range of wavelengths. (Wavelengths are the distance between the peaks of the electromagnetic waves.) The hotter the temperature, the shorter the wavelengths emitted. See the image below for an illustration of wavelengths. Note that the magnitude of the wavelengths is in meters, e.g. the distance between peaks of visible light is approximately 0.5 x 10⁻⁶ m, or 500 nanometers. (Visible light actually ranges from around 380 nm for violet to around 700 nm for red, according to NASA [258].)
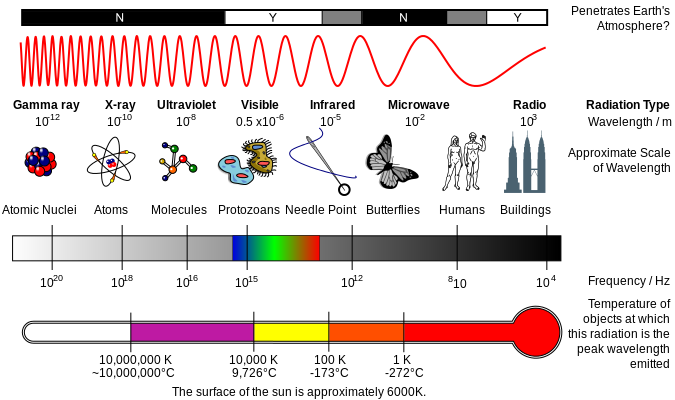
The sun's surface temperature averages between around 5,500 to 6,000 degrees C, which is pretty darn hot. Because it's so hot, the peak radiation is shortwave. More specifically, it peaks in the visible spectrum. The idealized amount of each type of radiation that is emitted by an object can be described using a blackbody radiation curve. Humboldt State University provided a good description [260] of a blackbody radiation curve, now provided on answersmore.com: "The intensity and distribution (and peak) of the radiation depends only on its temperature. The graphical representation of this is commonly known as a Blackbody Radiation Curve. For example, our Sun has an approximate temperature of 5800K and emits peak radiation in the visible portion of the spectrum. The Earth on the other hand is significantly cooler and emits a fraction of the energy and peaks in much longer wavelengths in what's known as the thermal infrared portion of the spectrum."
The image below provides an illustration of the blackbody radiation curve of the sun. Note the peak in the visible portion of the electromagnetic spectrum, but that the sun emits other wavelengths as well. To the left of the visible spectrum (shorter wavelength) is ultraviolet radiation, much of which is absorbed by ozone in the stratosphere. To the right of the visible spectrum on the chart is longwave radiation, much of which is absorbed by greenhouse gases.
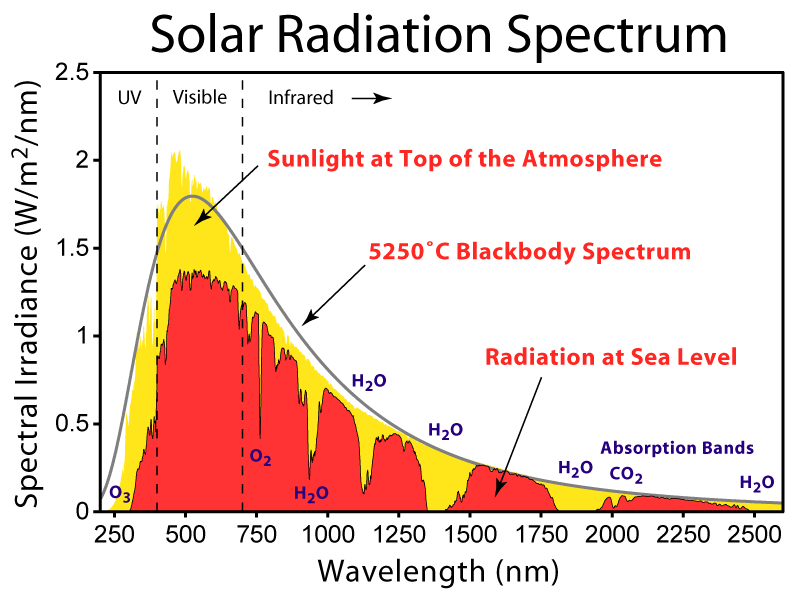
Fact 2: Carbon Dioxide Levels are Increasing Due to Human Activity
There are a few fundamental things to know in regards to the carbon dioxide content of the atmosphere.
- First, the amount of CO2 in the atmosphere is measured in parts per million (ppm). A concentration of 1 ppm means that there is one unit of mass of fluid for every million units of mass of the enveloping fluid. The current concentration of carbon dioxide is a little more than 400 ppm [262]. (FYI, this means that if you took 1 kg of air, there would be about 400/1,000,000 kg, which is 0.0004 kg or 0.4 g of CO2 in that kg of air.)
- Second, when measuring concentration, the atmosphere is considered effectively the same everywhere you go on earth. Localized variations occur, but the current CO2 concentration is considered to be effectively the same no matter where you are on the earth.
We have been directly measuring the atmospheric concentration of CO2 since 1958 in the Mauna Loa Observatory [263] in Hawaii and have seen it increase steadily since then (see Figure 3.5 below). This is known as the Keeling curve, and is named after Andrew Keeling, who initiated the measurements.
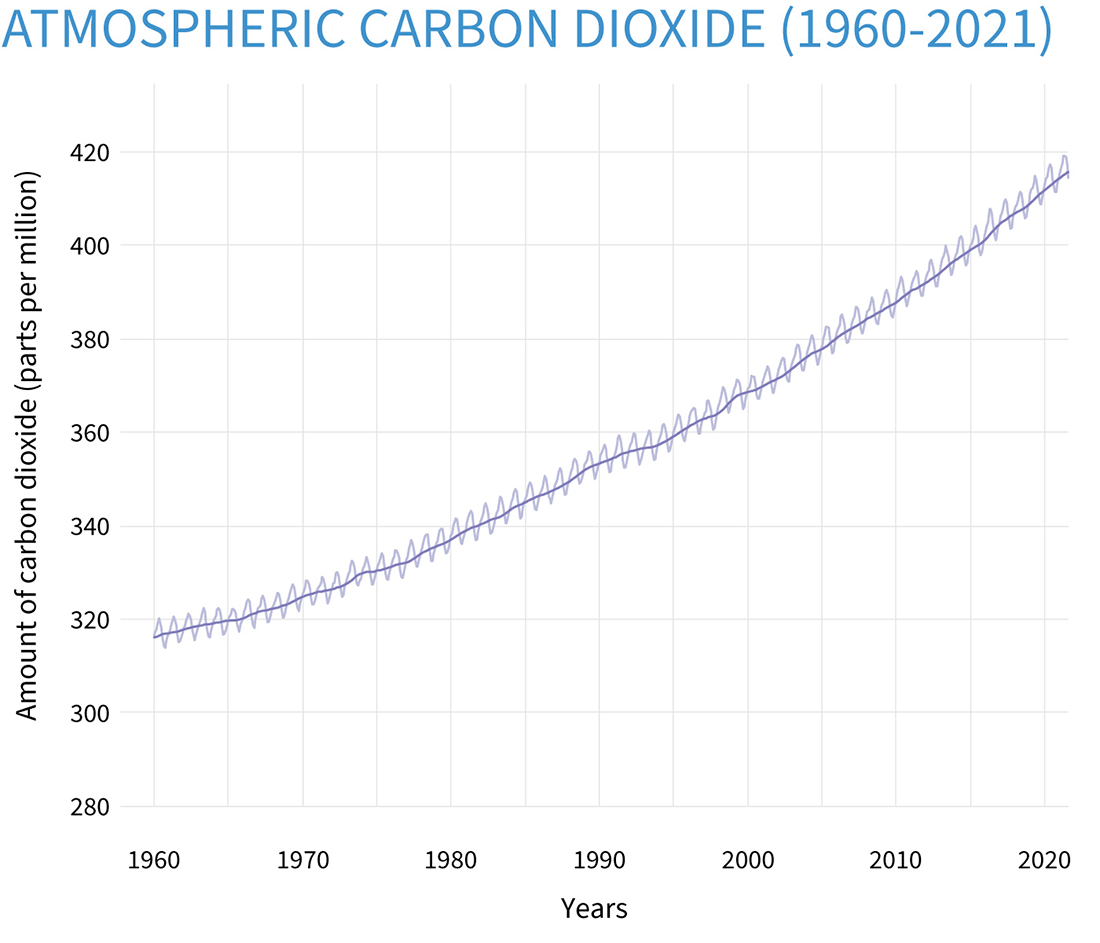
We also know with a very high level of certainty the concentration of the ancient atmosphere through time as well through proxy measures such as ice core samples from ancient ice (click here for some links to explanations of how this is done [265]- click on CO2 Past at the top of the page). The current levels of CO2 are almost certainly unprecedented in the past 800,000 years. The chart below depicts the carbon dioxide levels in the atmosphere for the past 400,000 years.
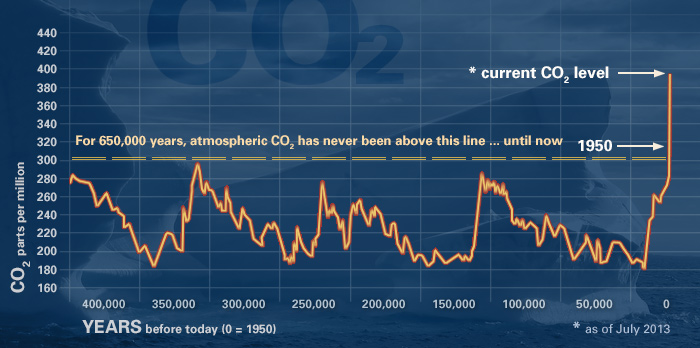
It is an established fact that the burning of fossil fuels releases carbon dioxide and that the concentration of carbon dioxide has been increasing rapidly since around the beginning of the Industrial Revolution in the late 1700s. The Industrial Revolution is characterized by the increased use of fossil fuels - first coal, then oil, then natural gas. All of these non-renewable energy sources release CO2 when burned, and aside from minor natural occurrences like volcanic eruptions, are what has primarily caused the increased carbon dioxide concentration over the past 200+ years.
In short, energy is the primary culprit in anthropogenic greenhouse gas emissions. In fact, according to the International Energy Agency, two-thirds of global anthropogenic greenhouse gas emissions are due to energy use and production (source: IEA, "Energy and Climate Change [267]," World Energy Outlook 2015). This boils down to the fact that:
- We are emitting carbon dioxide and other greenhouse gases at rates faster than can naturally be absorbed.
This causes an imbalance, and thus the concentration increases. This is one of the fundamental things to understand about sustainability that has been addressed a few times in this course: As noted last lesson, and as Herman Daly stated in regards to the steady state economy, we simply cannot emit wastes faster than they can be naturally reabsorbed.
Mythbusting: The Earth Emits More CO2 Than People Do, So We Don't Make An Impact
You may hear something like the following as a reason to be skeptical of anthropogenic climate change: "The earth naturally emits WAY more CO2 than humans do. The emissions are so relatively small that they cannot have an impact on CO2 concentrations, never mind climate change."
The earth does, in fact, emit significantly more CO2 than humans do! The image below is from the Intergovernmental Panel on Climate Change's (IPCC) most recent report, called the Fifth Assessment Report or simply AR5. This is an illustration of the global carbon cycle. Carbon, like most other elements, is constantly moving around the earth, e.g. being emitted and absorbed by oceans, being taken up by plants, being released by decaying plants, being released by volcanoes, etc. The carbon cycle illustrates this process. (Don't worry about analyzing this image if you don't want to - it's pretty dense, and you do not need to know any of the numbers.)
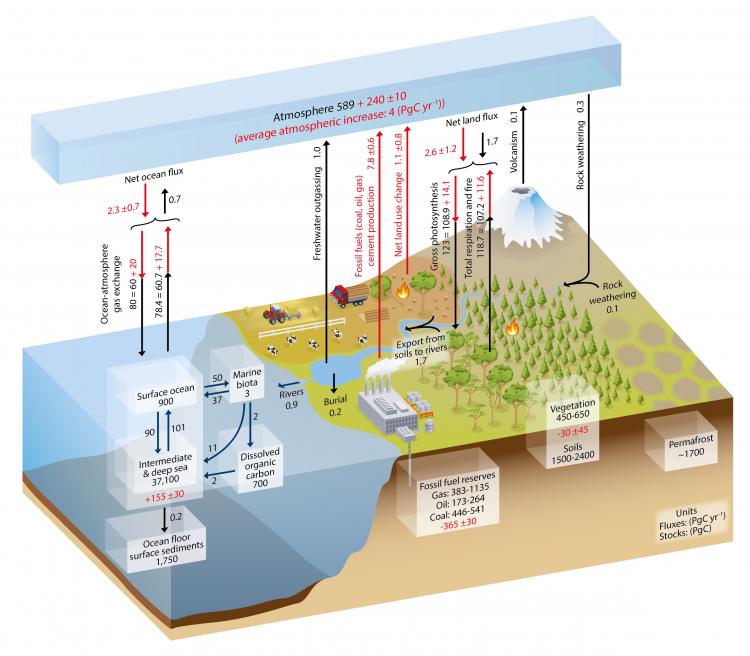
This is a pretty busy image, so I'll summarize it for you:
- Humans directly cause about 9 billion tons (Gt) of carbon to enter the atmosphere each year.
- Natural emissions are on the order of 170 Gt per year.
Hmm, okay, so there are way more natural than anthropogenic emissions. So why care so much about the measly 9 billion anthropogenic ton? As it turns out, if there were no anthropogenic emissions, the carbon cycle would likely even out, or perhaps even cause a reduction in carbon in the atmosphere. There are many natural processes that absorb carbon, mostly oceans, and vegetation. According to the IPCC, the total increase in carbon in the atmosphere is only about 4 Gt per year (including anthropogenic emissions). If you do a little math it becomes apparent: if those 9 Gt of emissions caused by humans were not there, then there would likely be no increase in overall concentration. Even though the relative contribution is small, anthropogenic emissions throw the global carbon cycle out of whack.
One good analogy of this process is weight gain. Let's say you average around 2,000 calories of food intake each day, and on average you burn off the same amount each day. If this continues over time, you will not gain weight. But if you add one extra 100 calorie snack each day, it will throw this balance out of whack. Even though you are only increasing your calorie intake by a measly 5%, over time this will cause weight gain. Well, it appears that the earth has put on some serious carbon weight in the past ~200 years, and it is almost entirely due to the extra human emissions!
Fact 3: The Climate Is Warming
Humans have been taking direct temperature measurements since about 1880. There has been an upward trend in global temperature since around 1900, and the increase has become very sharp since about 1980.
Optional Reading
According to the National Oceanic and Atmospheric Administration (NOAA) (via NASA [272]):
"Nineteen of the warmest years have occurred since 2000, with the exception of 1998. The year 2020 tied with 2016 for the warmest year on record since record-keeping began in 1880"
Based on this evidence (which has been corroborated by other scientific sources) and Figure 3.8 above, it is clear that the global temperature has been increasing since humans have been measuring it on a global scale, and it appears that the warming is accelerating.
One note of caution: The earth operates in cycles of thousands and millions of years, so less than 150 years of warming is not irrefutable evidence that the climate will continue to warm at this rate. However, the correlation that is observed between increased CO2 levels and temperature, along with what we know about GHGs, indicates that we are on a very unsustainable path.
Mythbusting: 2 Degrees of Warming. What's the Big Deal?
There is wide agreement that the Earth's average global temperature has increased about 2 degrees Fahrenheit since the beginning of the 20th century. I am the first to admit that this does not seem like a big deal, but it takes a LOT lof extra heat to increase global temperatures by that much and a few degrees can make a huge difference in the climate system. As NASA states:
Two degrees may sound like a small amount, but it's an unusual event in our planet's recent history. Earth's climate record, preserved in tree rings, ice cores, and coral reefs, shows that the global average temperature is stable over long periods of time. Furthermore, small changes in temperature correspond to enormous changes in the environment.
For example, at the end of the last ice age, when the Northeast United States was covered by more than 3,000 feet of ice, average temperatures were only 5 to 9 degrees cooler than today.
Fact 4: If Climate Change Continues, the Results Will Almost Certainly Be Catastrophic
There is wide consensus that if the climate continues to change and CO2 levels continue to rise, the results will not be good (okay, "not good" is a pretty big understatement). As the Intergovernmental Panel on Climate Change (IPCC) stated in their 2013 report: "Taken as a whole, the range of published evidence indicates that the net damage costs of climate change are likely to be significant and to increase over time" (source: IPCC, quoted by NASA [273]). This is a stuffy way of saying that "things will probably be really bad and continue to get worse."
The link below outlines some of the possible impacts, some of which have already begun to occur. Note that I am not saying that all of these things will happen, even if climate change continues, but it is meant as a survey of some of the most commonly cited negative impacts of climate change. Also note that some of the likely consequences may be positive in some areas, including extended growing seasons in cool climate zones and some increased growth of plants due to extra carbon being available, but the overall impact will very likely be overwhelmingly negative.
Suggested Reading
It is also very important to note that the most vulnerable to these impacts will be low-income and otherwise marginalized people all over the world. As the IPCC states in their 2014 assessment:
"(Climate change) risks are unevenly distributed and are generally greater for disadvantaged people and communities in countries at all levels of development" (IPCC, Climate Change 2014 Syntheses Report [275], p. 13).
Translation: the people with little power and/or resources will be disproportionately affected by climate change, regardless of whether they live in a low- or high-income country. This is thus an important social and environmental justice issue!
Mythbusting: Weather vs. Climate
I wish that I did not have to note this, but it is such a frequent occurrence that I would be remiss if I did not. Okay, here goes: Weather and climate are two different things. Weather refers to short-term variations in ambient atmospheric conditions, mostly day-to-day. It can be hot and sunny one day, and cold and rainy the next. This is weather. Climate refers to long-term trends in atmospheric conditions, which exhibit seasonal trends over the course of decades. (The National Centers for Environmental Information [NEI] from NOAA has some information here [276], if you are interested.) As NEI puts it: "Climate is what you expect. Weather is what you get." In other words, you can expect a certain type of condition based on the season, but the weather can change daily. The tweet below from Donald Trump in January of 2019 is typical of the conflating (on purpose or otherwise) of weather and climate.
In the beautiful Midwest, windchill temperatures are reaching minus 60 degrees, the coldest ever recorded. In coming days, expected to get even colder. People can’t last outside even for minutes. What the hell is going on with Global Warming? Please come back fast, we need you!
— Donald J. Trump (@realDonaldTrump) January 29, 2019 [277]
There are in fact at least two important things wrong about this statement.
- First, this is just weather. 2019 was in the top three hottest years ever recorded [279].
- Second, it is called "global" climate change for a reason. Regional effects are only one small part of the story. It is essential to look at temperatures across the world. The image below from January of 2019 clearly shows that yes, the upper Midwest was colder than normal, but almost the entire rest of the U.S. was warmer than normal, as was most of the world.
Fact 5: There is Broad Scientific Consensus that Humans are the Primary Driver of Observed Climate Change
First of all, it is important to recognize that the climate is a complex system that cannot as of yet be completely modeled. There are gaps in our knowledge, so we do not know with 100% certainty the extent to which our emissions are impacting the climate. But, the evidence has become increasingly clear and compelling.
The Intergovernmental Panel on Climate Change (IPCC) is the most highly regarded climate change research body in the world, as it is made up of over 1,000 of the top climate scientists in the world. Their conclusion in their most recent report [281] in the summer of 2021:
It is unequivocal that human influence has warmed the atmosphere, ocean and land. Widespread and rapid changes in the atmosphere, ocean, cryosphere and biosphere have occurred...Human-induced climate change is already affecting many weather and climate extremes in every region across the globe
In addition, multiple reports in peer-reviewed journals have found that at least 97% of scientists actively publishing in the climate field agree that the climate change observed in the past century is likely due to human influence, i.e., it is anthropogenic. See these links to some studies [282]. In 2015, 24 of Britain's top "Learned Societies" - groups of scientific experts, basically - wrote a letter [283] urging that we need to establish a "zero-carbon world" early in the second half of the 21st century. In the past 15 years, 18 U.S. scientific associations [282] have confirmed that climate change is likely being caused by humans. Big players in the private sector are concerned as well. For example, CEOs from 43 companies in various sectors (with over $1.2 trillion of revenue in 2014) signed an open letter [284] urging action in April of 2015. Even Exxon Mobil states as their official position [285] on climate change (as of the summer of 2018) that:
"We believe that climate change risks warrant action and it’s going to take all of us — business, governments and consumers — to make meaningful progress."
Exxon Mobil, the world's largest publicly traded oil and gas company, is not known to be a friend of carbon reduction advocates. In fact, a study published in August of 2017 [286] found that they systematically misled the public for nearly 40 years about the dangers of climate change, even though they acknowledged the risks internally. Yet even they assert that emissions should be reduced.
Mythbusting: It's China's Fault
(Note: You are welcome to browse and play with the charts below, but please at least read this short explanation.)
You might also hear that China is the world leader in emissions. This is true, and has been since 2006/2007 (see the first chart below). There are at least three important considerations to make with regards to assigning blame for global emissions, though:
- First, CO2 emissions can last for hundreds of years in the atmosphere, so we should consider the cumulative emissions over the past few hundred years. As the second chart below shows, the U.S. has nearly twice the cumulative emissions as China.
- Second, China has about four times the population of the U.S. So all else being equal, China "should" have about four times the emissions. But they don't. This means that their emissions per capita are lower than the U.S. As it turns out, China emits a little more than half the emissions per capita as the U.S.
- Finally, as the charts indicate the data are "based on territorial emissions (production-based) and do not account for emissions embedded in trade." Most of China's emissions are the result of producing goods for other countries, so the accounting methods are not entirely fair.
Putting it All Together
Let's consider these facts together:
- We know that the greenhouse effect warms the planet and that carbon dioxide is a greenhouse gas.
- We know that humans are emitting greenhouse gases at a rate that is increasing their concentration in the atmosphere.
- We know that the global climate is warming.
These three facts alone indicate that there is likely a problem. But, on top of this, you add that:
- The vast majority of active climate scientists agree that climate change is a problem and that observed climate change is anthropogenic. So, the people that we trust to understand the climate widely agree that it is a problem.
- Finally, if climate change is happening, then the results will likely be devastating and on a global scale.
We know that humans are impacting the climate. Do we know the exact extent to which we are? The short answer is "no." The longer answer is that we are almost certain that humans are the primary cause of the warming that has occurred and that it is worth taking the precaution to prevent the worst of climate change just in case. Yes, it is possible that so many climate experts are wrong about the severity of the human impact on the climate - it is a rare occurrence that so many experts are wrong, but there is a possibility, however miniscule. And yes, there will be costs associated with making the change to a low-carbon society. But why do people buy life insurance? What about fire insurance? As silly as it sounds, what about buying an extended warranty on a new piece of electronics, or extra insurance for a rental car? The point is that even though the likelihood of using those insurances is minimal, people are willing to pay the cost in order to avoid catastrophe. The same could be said of climate change. Taking steps to avoid the worst-case scenario, or perhaps something near the worst-case scenario, is known as the precautionary principle. This may cost money or other resources in the short term, but is seen as worth it because of the situation it may prevent.
One quick addendum to this: If steps are successfully taken to reduce climate emissions to a sustainable level, it is very likely that there will also be cleaner air, less environmental damage, more energy security (not being dependent on another country for energy), and probably more active/healthy citizens. Something to think about.
Good to Know - Wicked Problems
Climate change is a very complicated, multifaceted, and unique problem that overlaps a multitude of sectors and has no capital "S" Solution. This, among other things, makes it a so-called "wicked problem." Stony Brook University [289] provides an excellent synopsis of wicked problems. (Feel free to read more about them here [289].)
- They do not have a definitive formulation.
- They do not have a 'stopping rule.' In other words, these problems lack an inherent logic that signals when they are solved.
- Their solutions are not true or false, only good or bad.
- There is no way to test the solution to a wicked problem.
- They cannot be studied through trial and error.
- Their solutions are irreversible so, as Rittel and Webber put it, 'every trial counts.'
- There is no end to the number of solutions or approaches to a wicked problem.
- All wicked problems are essentially unique.
- Wicked problems can always be described as the symptom of other problems.
- The way a wicked problem is described determines its possible solutions.
- Planners, that is those who present solutions to these problems, have no right to be wrong. Unlike mathematicians, 'planners are liable for the consequences of the solutions they generate; the effects can matter a great deal to the people who are touched by those actions.'
Check Your Understanding
Further Reading - OPTIONAL
If you are interested in reading more about this topic, here are some suggested readings.
- "Climate Change 2021: The Physical Science Basis, Summary for Policymakers [281]." Intergovernmental Panel on Climate Change.
- U.S. Environmental Protection Agency's Climate Change Website [290]
- Link to a number of IPCC documents [291].
Optional (But Strongly Suggested)
Now that you have completed the content, I suggest going through the Learning Objectives Self-Check list at the top of the page.
Water
Learning Objectives Self-Check
Read through the following statements/questions. You should be able to answer all of these after reading through the content on this page. I suggest writing or typing out your answers, but if nothing else, say them out loud to yourself.
Quick Quiz
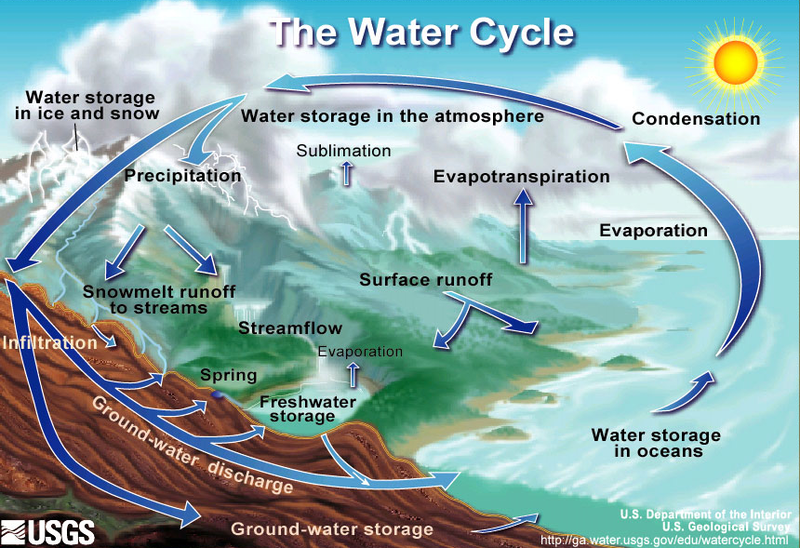
It is a widely known fact that people can survive much longer without food than without water. Under optimal conditions, humans can go around a week, maybe a bit more, without water [295], whereas it is possible to go more than a month without eating food [296]. But when water sustainability is being discussed, it is rare that death from lack of drinking water is the concern. A more likely cause of death (or, otherwise, a reduction in quality of life) is lack of clean water, and the water-borne diseases like diarrhea and cholera that result. Lack of access to water will likely be a very important problem in the future, though it also poses a threat right now.
Suggested Reading
The World Health Organization (WHO) [297] was established by the United Nations (UN) in 1948. Its goal is "to build a better, healthier future for people all over the world" and its "staff work side by side with governments and other partners to ensure the highest attainable level of health for all people" (source: World Health Organization [298]). They perform and fund research, write reports, establish international health recommendations/standards, provide aid throughout the world, and publish a LOT of data. They are a great source for information regarding international health (and sickness/disease).
- You are welcome to read the entire article, or you can just click below to read the key passages:"Drinking-water [299]" by the World Health Organization.
Key facts
Over 2 billion people live in water-stressed countries, which is expected to be exacerbated in some regions as result of climate change and population growth.
Globally, at least 1.7 billion people use a drinking water source contaminated with faeces. Microbial contamination of drinking-water as a result of contamination with faeces poses the greatest risk to drinking-water safety.
Safe and sufficient water facilitates the practice of hygiene, which is a key measure to prevent not only diarrhoeal diseases, but acute respiratory infections and numerous neglected tropical diseases.
Microbiologically contaminated drinking water can transmit diseases such as diarrhoea, cholera, dysentery, typhoid and polio and is estimated to cause 505 000 diarrhoeal deaths each year.
In 2022, 73% of the global population (6 billion people) used a safely managed drinking-water service – that is, one located on premises, available when needed, and free from contamination.
Overview
Safe and readily available water is important for public health, whether it is used for drinking, domestic use, food production or recreational purposes. Improved water supply and sanitation, and better management of water resources, can boost countries’ economic growth and can contribute greatly to poverty reduction.
In 2010, the UN General Assembly explicitly recognized the human right to water and sanitation. Everyone has the right to sufficient, continuous, safe, acceptable, physically accessible and affordable water for personal and domestic use.
Water and health
Contaminated water and poor sanitation are linked to transmission of diseases such as cholera, diarrhea, dysentery, hepatitis A, typhoid, and polio. Absent, inadequate, or inappropriately managed water and sanitation services expose individuals to preventable health risks...
Inadequate management of urban, industrial, and agricultural wastewater means the drinking-water of hundreds of millions of people is dangerously contaminated or chemically polluted...
Some 1 million people are estimated to die each year from diarrhoea as a result of unsafe drinking-water, sanitation and hand hygiene. Yet diarrhoea is largely preventable, and the deaths of 395 000 children aged under 5 years could be avoided each year if these risk factors were addressed. Where water is not readily available, people may decide handwashing is not a priority, thereby adding to the likelihood of diarrhoea and other diseases.
Diarrhoea is the most widely known disease linked to contaminated food and water but there are other hazards. In 2021, over 251.4 million people required preventative treatment for schistosomiasis – an acute and chronic disease caused by parasitic worms contracted through exposure to infested water.
In many parts of the world, insects that live or breed in water carry and transmit diseases such as dengue fever. Some of these insects, known as vectors, breed in clean, rather than dirty water, and household drinking water containers can serve as breeding grounds. The simple intervention of covering water storage containers can reduce vector breeding and may also reduce faecal contamination of water at the household level.
Economic and social effects
When water comes from improved and more accessible sources, people spend less time and effort physically collecting it, meaning they can be productive in other ways. This can also result in greater personal safety and reducing musculoskeletal disorders by reducing the need to make long or risky journeys to collect and carry water. Better water sources also mean less expenditure on health, as people are less likely to fall ill and incur medical costs and are better able to remain economically productive.
With children particularly at risk from water-related diseases, access to improved sources of water can result in better health, and therefore better school attendance, with positive longer-term consequences for their lives.
Challenges
Historical rates of progress would need to double for the world to achieve universal coverage with basic drinking water services by 2030. To achieve universal safely managed services will require a 6-fold increase. Climate change, increasing water scarcity, population growth, demographic changes and urbanization already pose challenges for water supply systems...
The World Economic Forum (WEF) [300] is a non-profit headquartered in Switzerland whose members are a who's who of the global economically elite corporations. The WEF is best-known for its annual meeting in Davos, Switzerland, which is frequently attended by world leaders, including the U.S. president. The WEF is often critiqued for not doing enough about income inequality and other issues facing the world's impoverished, but they do provide a lot of information that reflects the perspective of many of the world's economic leaders. This includes their annual Global Risks Report, which ranks what it sees as the top global risks in the next 10 years. Water figured prominently in the 2016 Global Risks Report. (The 2023 report [301] focused more on a variety of environmental problems, including cllimate change, biodiversity loss and ecosystem collapse, and lumps water into "natural resource crises.")
You are welcome to read the entire press release [302], but here is the content most relevant to this lesson:
An increased likelihood for all risks, from the environmental to society, the economy, geopolitics and technology, looks set to shape the global agenda in the coming year, the World Economic Forum’s Global Risks Report 2016 has found.
...The risk with the greatest potential impact in 2016 was found to be a failure of climate change mitigation and adaptation. This is the first time since the report was published in 2006 that an environmental risk has topped the ranking. This year, it was considered to have greater potential damage than weapons of mass destruction (2nd),& water crises (3rd), large-scale involuntary migration (4th) and severe energy price shock (5th).
The number one risk in 2016 in terms of likelihood, meanwhile, is large-scale involuntary migration, followed by extreme weather events (2nd), failure of climate change mitigation and adaptation(3rd), interstate conflict with regional consequences (4th) and major natural catastrophes(5th).
Such a broad risk landscape is unprecedented in the 11 years the report has been measuring global risks. For the first time, four out of five categories – environmental, geopolitical, societal and economic – feature among the top five most impactful risks. The only category not to feature is technological risk, where the highest ranking risk is cyberattack, in 11th position in both likelihood and impact.
The following is some of the more important (and startling) information from the readings above:
- Globally, at least 1.7 billion people use a drinking water source contaminated with feces
- Contaminated water and poor sanitation are linked to transmission of diseases such as cholera, diarrhea, dysentery, hepatitis A, typhoid, and polio.
- Some 1 million people are estimated to die each year from diarrhea as a result of unsafe drinking-water, sanitation, and hand hygiene. Yet diarrhea is largely preventable, and the deaths of 395,000 children aged under 5 years could be avoided each year if these risk factors were addressed.
- Where water is not readily available, people may decide handwashing is not a priority, thereby adding to the likelihood of diarrhea and other diseases.
- Climate change, increasing water scarcity, population growth, demographic changes and urbanization already pose challenges for water supply systems. Over 2 billion people live in water-stressed countries.
While this paints a bleak picture, some progress has been made in the global fight for access to clean water, as evidenced by the fact that the UN's Millennium Development Goal (MDG) on drinking water has been met. The MDG was to "halve the proportion of the world's population without sustainable access to safe water." This goal was met in 2010. However, the article indicates that while the broad goal was met (global percentage), none of the 48 "least developed" countries met the goal.
As usual, there is a deficiency in terms of equity with regards to access to clean water, with "low-income, informal or illegal" populations "usually having less access to improved sources of drinking-water than other residents." The consequences are dire, as around 1 million people are estimated to die each year from diarrhea alone, including nearly 400,000 children under the age of 5. And over a quarter of a billion people had to be treated for schistosomiasis, which is a painful chronic disease also caused by water contamination. The worst part is that this is mostly preventable!
These and other factors combine to make access to water an essential part of quality of life. The United Nations has declared access to water and sanitation a human right and thus should be provided to all people equitably. The UN realizes that access is a fundamental component of the ability to live one's life and further that "clean drinking water and sanitation are essential to the realization of all human rights" (Source: United Nations [303]).
All of this is reflected in the World Economic Forum's (WEF) Global Risk Report 2016, which ranked water as the third highest global risk in terms of "impact." (The 2019 report lists it as number 4 in terms of impact.) Note that the WEF did not rank water crisis on a large scale as highly likely relative to other things, including extreme weather, but that if it does occur, it will be very impactful. This speaks to the importance of access to water.
Good to Know - Sustainable Development Goals
The United Nations declared its Millennium Development Goals in 2000. They focused on 8 themes, each with many practical steps listed as ways to achieve the goals:
- Eradicate extreme poverty and hunger
- Achieve universal primary education
- Promote gender equality and empower women
- Reduce child mortality
- Improve maternal health
- Combat HIV/AIDS, Malaria, and other diseases
- Ensure environmental sustainability
- Develop a global partnership for development
Actions were to be taken for a period of 15 years and assessed every year along the way. This period concluded in 2014, and in 2015 the UN published the final report assessing the progress toward the goals. You can view The Millennium Development Goals Report [304]. This is optional reading but will give you a very good feel for a lot of the development activities undertaken by the UN.
These have been replaced by the Sustainable Development Goals [305]. These were adopted by the UN in 2015 as part of the 2030 Agenda for Sustainable Development [306]. According to the UN, this agenda "provides a shared blueprint for peace and prosperity for people and the planet, now and into the future. At its heart are the 17 Sustainable Development Goals (SDGs), which are an urgent call for action by all countries - developed and developing - in a global partnership. They recognize that ending poverty and other deprivations must go hand-in-hand with strategies that improve health and education, reduce inequality, and spur economic growth – all while tackling climate change and working to preserve our oceans and forests."
The SDGs are quite well known, and many public and private entities (and educational institutions) are using them to provide a framework for applying sustainability. The 17 Sustainable Development Goals are as follows. You will probably note that almost all of these are addressed to some extent in this course!
- No Poverty
- Zero Hunger
- Good Health and Well-Being
- Quality Education
- Gender Equality
- Clean Water and Sanitation
- Affordable and Clean Energy
- Decent Work and Economic Strength
- Industry, Innovation, and Infrastructure
- Reduced Inequalities
- Sustainable Cities and Communities
- Responsible Consumption and Production
- Climate Action
- Life Below Water
- Life on Land
- Peace, Justice, and Strong Institutions
- Partnerships for the Goals
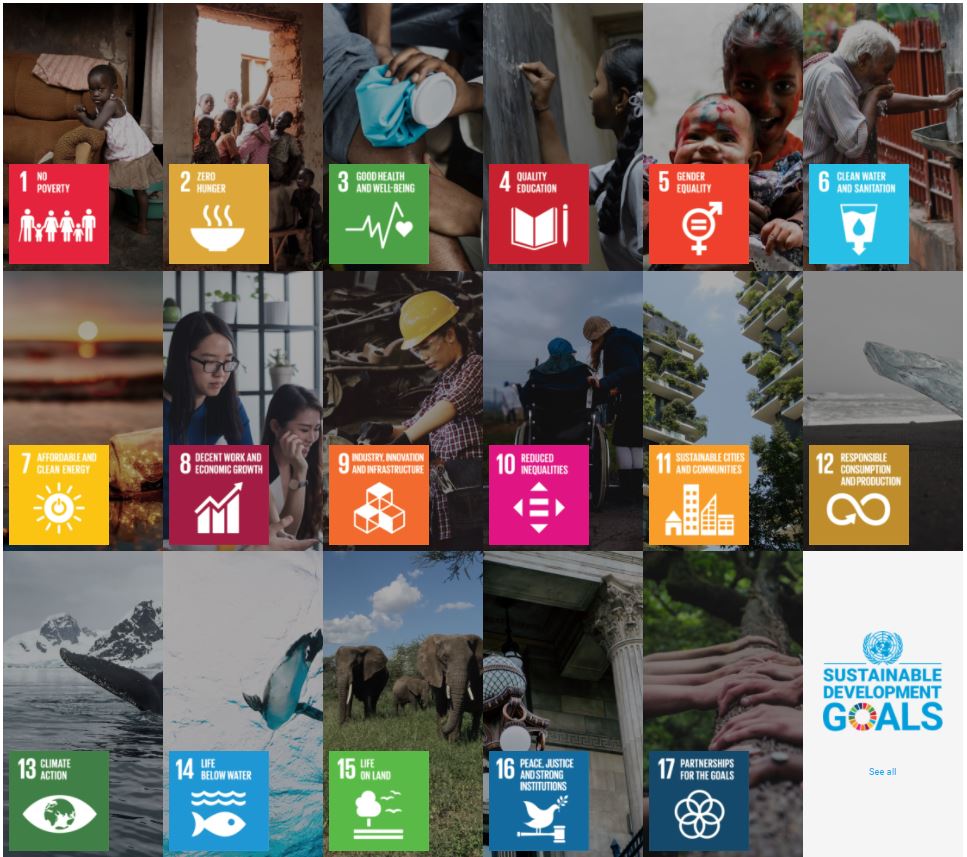 [305]
[305]
Water Scarcity and Sectoral Use
The Food and Agriculture Organization of the United Nations (FAO) [307] indicates that its goal is to "achieve food security for all and make sure that people have regular access to enough high-quality food to lead active, healthy lives" (Source: FAO [308]). They are widely regarded as a leading international organization in the movement to alleviate malnutrition and food poverty across the world, particularly in impoverished areas of the world. In the video below (viewing is optional), they provide an introduction to the concepts of physical water scarcity and economic water scarcity and provide some data about these two phenomena.
- Physical water scarcity "occurs when the demand for water...is higher than the available resource." This is pretty straightforward: this occurs when an area needs more water than it has. This usually occurs in dry areas of the world, including wealthier ones like the southwestern U.S.
- Economic water scarcity "occurs when human, institutional and financial capital limit access to water even though water in nature is available for human needs." In other words, the water is there and is accessible, but the people are not capable of getting to it. This tends to happen in lower income countries of the world, and areas with social and/or political instability.
Source: FAO [309]
Suggested Viewing
The following video from FAO has no audio narration, so there is nothing wrong with your speakers/headphones! Note that the data provided are a few years old, but have not changed much. It is important to point out that despite what is indicated in the video below, reducing domestic water use is not the most effective way to reduce total water use. As you will see in the video below, much more water is used as a result of farming and industrial uses worldwide.
Watch Water Scarcity by FAO Water (3:26 minutes).
It says: Water scarcity occurs when the demand for water from all sectors (agriculture, cities, environment, etc.) is higher than the available resource. Because water has been relatively abundant throughout our existence on earth, we have come to take it for granted. However, we now find our water supplies severely reduced as water scarcity is fast becoming one of the most serious resource issues we face today. The amount of water on our planet is fixed, but very little of it is available for us to use with about 2.5 percent of all water on earth being fresh water and 68.9 percent of the fresh water is locked in glaciers, 30.8 percent in groundwater, and 0.3 percent in lakes and rivers.
Currently, one third of the world population lives in countries where there isn't enough water or its quality has been compromised. By 2025 this number is expected to rise to two-thirds.
There are two types of water scarcity. One is known as Physical Water Scarcity. This occurs when there is not enough water to meet our needs. Arid regions are generally associated with physical water scarcity. Physical water scarcity occurs in: the western United States, Northern Africa, Saudi Arabia, Eastern Australia, and areas of India and northern China. More areas are rapidly approaching physical water scarcity. Africa, Asia and the Pacific, and the Near East use over 75 percent of their water for agriculture. The other type of water scarcity is known as Economic Water Scarcity. This occurs when human, institutional and financial capital limit access to water even though water in nature is available for human needs. Economic water scarcity occurs in central and northern South America, Middle Africa, and in and around India. Poor households in developing countries spend higher portions of their income on water than families in industrialized nations.
You may think water issues are somebody else's problem. But in a few years, it will be yours too. Follow a few easy steps to do your part in maintaining this precious resource. Don't throw your cooking oil down the drain. Close the tap when brushing your teeth. Don't buy unnecessary goods, as everything produced uses water.
Suggested Reading
You are welcome to read from the beginning through the "Water stress versus water scarcity" section on the United Nation's "International Decade for Action 'WATER FOR LIFE' 2005 - 2015 [312]," but that is not necessary. The key passages are summarized below. The full document provides a snapshot of water scarcity worldwide. This was the final report published by the UN after their decade-long focus [313] on international water issues. I have highlighted some key elements in bold.
Water scarcity already affects every continent. Around 1.2 billion people, or almost one-fifth of the world's population, live in areas of physical scarcity, and 500 million people are approaching this situation. Another 1.6 billion people, or almost one quarter of the world's population, face economic water shortage (where countries lack the necessary infrastructure to take water from rivers and aquifers).
Water scarcity is among the main problems to be faced by many societies and the World in the XXIst century. Water use has been growing at more than twice the rate of population increase in the last century, and, although there is no global water scarcity as such, an increasing number of regions are chronically short of water.
Water scarcity is both a natural and a human-made phenomenon. There is enough freshwater on the planet for seven billion people but it is distributed unevenly and too much of it is wasted, polluted and unsustainably managed...
- Around 700 million people in 43 countries suffer today from water scarcity.
- By 2025, 1.8 billion people will be living in countries or regions with absolute water scarcity, and two-thirds of the world's population could be living under water stressed conditions.
- With the existing climate change scenario, almost half the world's population will be living in areas of high water stress by 2030, including between 75 million and 250 million people in Africa. In addition, water scarcity in some arid and semi-arid places will displace between 24 million and 700 million people.
- Sub-Saharan Africa has the largest number of water-stressed countries of any region
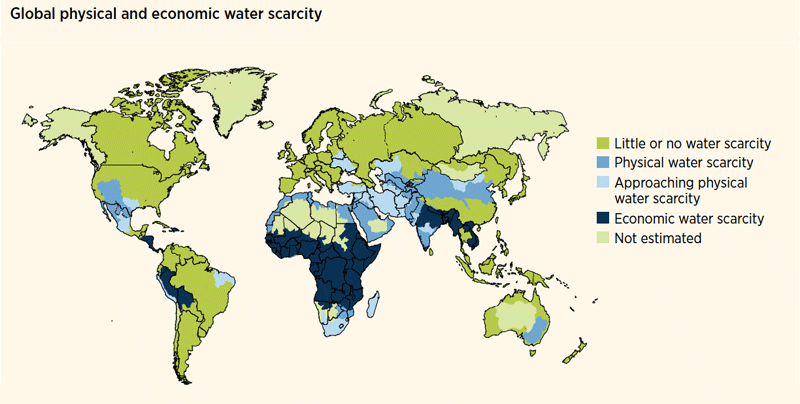
- Economic water scarcity: Sub-Saharan Africa, parts of Northwestern South America, Northern India an some of Southeast Asia
- Physical water scarcity: Northern China, parts of the Middle East, Southeastern Australia, Southwest U.S.
- Approaching physical water scarcity: Central Mexico and parts of Texas, South Africa, most of the Middle East, Some in Northern China.
- Little or no water scarcity: Most of the rest of the world, except for Alaska, Greenland, Siberian Russia, and Central Australia, which had no data.
The main takeaways from this video and article are:
- Economic water scarcity is when there is enough water in an area, but people don't have access to an adequate amount due to economic, political, or technological reasons
- Physical water scarcity is when there is not physically enough water to satisfy the needs of the people
- Arid areas being most prone to physical scarcity and those with social and/or political unrest most subject to economic scarcity;
- On a global scale, water scarcity is more of a distribution problem than a physical problem, according to the UN ("There is enough freshwater on the planet for seven billion people [312] but it is distributed unevenly and too much of it is wasted, polluted and unsustainably managed.");
- Water scarcity impacts areas all over the world, including in some relatively wealthy countries.
- It is important to note that despite recent progress, the total number of people subject to scarcity or stress is likely to increase as population and water demand increase, and as the climate continues to change.
Quick Quiz
Suggested Viewing
The TED Talk below provides some great insight into the causes and effects of, and some solutions for, water scarcity. It also dispels some common misconceptions about the best ways to address this issue.
Watch Fresh water scarcity: An introduction to the problem (3:39 minutes)
You might have heard that we're running out of fresh water. This might sound strange to you because, if you live in a place where water flows freely from the tap or shower at any time, it sure doesn't seem like a big deal.
It's just there, right?
Wrong!
The only obvious thing about fresh water is how much we need it. Because it's essential to life, we need to think about it carefully. Right now, at this very moment, some people, women and girls in particular, walk hours and miles per day to get fresh water, and even then, it may not be clean. Every 15 seconds, a child dies due to water-born diseases.
This is tragic!
The most compelling reasons to think about fresh water, therefore, have to do with what we might call the global common good. This is not something we normally think about, but it means recognizing how much fresh water matters for the flourishing of human and non-human life on Earth now and in the future.
How do we think about something as local as our faucets and as global as fresh water? Is there a connection between them?
Many people assume that fresh water shortages are due to individual wastefulness: running the water while you brush your teeth, for example, or taking really long showers. Most of us assume, therefore, that water shortages can be fixed by improving our personal habits: taking shorter showers or turning off the water while we brush our teeth. But, global fresh water scarcity neither starts nor ends in your shower. Globally, domestic use of fresh water accounts for only 8% of consumption, 8%!! Compare that to the 70% that goes to agriculture and the 22% that goes to industrial uses.
Now, hold up - you're not off the hook!
Individual habits are still part of the puzzle. You should still cultivate water virtue in your daily life, turn off the tap when you brush your teeth. But still, it's true. Taking shorter showers won't solve global problems, which is too bad. It would be much more straightforward and easier if virtuous, individual actions could do the trick. You'd just stand there for 30 seconds less, and you'd be done with that irksome, planet-saving task for the day.
Well, that's not so much the case.
Agricultural and industrial patterns of water use need serious attention. How do our societies value water? Distribute it? Subsidize its use in agriculture? Incentivize its consumption or pollution?
These are all questions that stem from how we think about fresh water's value. Is it an economic commodity? A human right? A public good? Nobel prize winners, global water justice activists, transnational institutions like the United Nations, and even the Catholic Church are at work on the issue. But, it's tricky, too, because the business of water became very profitable in the 20th century. And profit is not the same thing as the common good. We need to figure out how to value fresh water as a public good, something that's vital for human and non-human life, now and in the future.
Now that's a virtuous, collective task that goes far beyond your shower.
Though this TED-Ed talk was produced in 2013, the same issues exist today. As the narrator indicates, only about 8% of global fresh water consumption is from domestic uses (showering, teeth brushing, cooking, etc.) Most - about 70% (!) - is used for agriculture, and over 20% is used for industrial purposes (e.g. manufacturing, energy generation). This is very similar to the U.S. water use profile, as you will see in a second.
The United States Geological Survey (USGS) [316] is charged with compiling the U.S.'s water use data. The most recent report is from 2015, which was released in June of 2018. Feel free to tool around with the data here [317], and go here for an interesting visualization of water use by category and state [318].
The chart below shows the percent of consumption different sectors of use are responsible for. As noted above, very little is used domestically and in the public supply (around 13% combined). (Note that irrigating lawns and watering gardens at home counts as domestic use, not irrigation.) You may be surprised by some of this, in particular that thermoelectric cooling is the single biggest user of total water in the U.S. (Keep in mind that about 50 billion gallons of salt water are used for thermoelectric power, so irrigation is the biggest single freshwater user in the U.S.). Thermoelectric cooling just refers to cooling towers. Have you ever noticed that power plants are always located near a body of water? That is because the electricity generation process generates a LOT of waste heat. (Recall that power plants are generally 30% - 40% efficient, and so waste a lot of heat). Without constant cooling by a local water source, the plants would overheat.

| Category | 2015 WithdrawAls in Million Gallons per Day |
|---|---|
| Public Supply | 39,000 |
| Self-Supplied Domestic | 3,260 |
| Irrigation | 118,000 |
| Livestock | 2,000 |
| Aquaculture | 7,550 |
| Self-supplied Industrial | 14,800 |
| Mining | 4,000 |
| Thermoelectric Power | 133,000 |
Note: Values do not sum to 322,000 Mgal/d because of independent rounding.
- Total withdrawals were 322,000 million gallons per day (355 billion gallons per day).
- Thermoelectric power, irrigation, and public supply account for 90 percent of total withdrawals.
- Withdrawals declined since 2010 in all categories except irrigation.
- Freshwater withdrawals were about 88% of the total.
- Surface water supplied 78 % of all withdrawals
Suggested Reading
- "Summary of Estimated Water Use in the United States in 2015 [319]." USGS.
It is important to keep in mind that it's not as easy as knowing how much water is being used. Unlike coal, natural gas, or other non-renewable resources, once water is "used," it does not disappear. (Recall that we have the same amount of water on earth now as we have had for thousands of years.) Rather, water is just moved into a different part of the water cycle. For example, with thermoelectric cooling, liquid water is converted to water vapor. It is then in a different part of the cycle, but is eventually converted back to liquid water (and perhaps solid) in the form of precipitation. If that precipitation falls over the ocean, it may stay there for a few days, or thousands of years. (The amount of time it stays in storage is called the residence time). If water is used to grow a food crop, it may evapotranspire in a matter of days, or it may stay in the plant, only to be consumed by an animal, and then perhaps by us, where it will eventually end up somewhere else. The UCAR Center for Science Education [320] (who operates the National Center for Atmospheric Research) provides the following [321] average residence times in the water cycle. It is important to point out that these are average residence times, and they are careful to note that there are exceptions to this:
A drop of water may spend over 3,000 years in the ocean before evaporating into the air, while a drop of water spends an average of just nine days in the atmosphere before falling back to Earth.
Water spends thousands to hundreds of thousands of years in the large ice sheets that cover Antarctica and Greenland
...snow that falls in the winter may only stick around for a few days in mid-latitudes locations, where temperatures often rise above freezing causing the snow to melt, or up to six months closer to the Arctic
..Water stays in soil for around one to two months although this varies greatly.
Like many sustainability-related issues, freshwater availability is complex. When we use water, we may eventually get it back in a usable form. But keep in mind that when we use freshwater (e.g., to irrigate crops, cool power plants, etc.), much of it ends up as water vapor, and on average (according to UCAR) 80% of precipitation falls over the ocean, where the residence time is an average of 3,000 years. It is difficult to convert it back to freshwater when this happens. As you will see below, the overall trend is toward less freshwater being available. The take-home message here is that it is in our best interests to make sure we maintain an adequate level of freshwater as possible by minimizing& use.
Okay, now you have an idea of what water scarcity is, and know different ways that human activity moves a lot of water in and out of different parts of the water cycle. You've also seen some indication of global water contamination issues. If you want to learn about some evidence of water scarcity, read through the suggested reading below.
Suggested Reading
Two important questions remain: Are we at risk of running out of fresh water? If so, how do we know? The article below will help us answer these questions.
- "One quarter of the world's population live in countries with a high level of water stress [322]," World Economic Forum
- "Is the world running out of fresh water? [323]" Tim Smedley, BBC.
Water Footprint
Given that most water is used for things other than direct household use, it stands to reason that there are "hidden" water costs to many of the things we do, use, and consume. Take a look around you, and think about what you ate today and yesterday. Have you ever thought about how much water was used for all of that "stuff?" Have you ever seen a water use label on a pack of hamburgers in the store? How about a loaf of bread? The label on your jeans? Neither have I and just like me, you would probably be shocked to find out how much water is used to produce most things. The Water Footprint Network [324] defines water footprint as "the amount of water used to produce each of the goods and services we use" (source: Water Footprint Network [325]).
A water footprint - like an ecological footprint - can be calculated for individual products, individual people, or groups of people (communities, cities, countries, etc.). The folks at the Water Footprint Network provide a lot of information about water footprints [326]. What is particularly nice about this organization is that they use peer-reviewed research as their information sources. The video below indicates some of the footprints of "everyday" products. The specific numbers are not meant to be gospel, but give you a good idea of water footprints. Note that the following 1 minute video has no audio narration.
This is how much water you use every day without even knowing. Enjoy a morning cup of coffee? That's 140 liters of water...just to grow the beans for a single cup. Staying clean is water intensive too...between 90 and 180 liters. Water is also used to make every item of clothing you wear. Your new T-shirt takes 2,720 liters and your favorite pair of jeans adds another 10,000 liters. Work in an office? Water use doesn't stop there. The office printer uses more than you think, as it takes 6,000 liters to produce one ream of paper. A single hamburger at lunch uses up 2,400 liters of water, mostly to grow the cattle feed. And the oranges in a single glass of juice take another 200 liters. Your drive home at the end of the day relies on water, with 177,000 liters used in the manufacture of a midsize car. An evening glass of wine uses as much water as your morning coffee. Leaving just enough for a glass of water before bed.
Take a look at the Water Footprint Network's product gallery [328]to see the (often surprising) water footprint of many common items.
Water and Equity
As with other sustainability issues, problems associated with access to fresh water is most acute in disadvantaged areas of the world. This includes low-income countries - particularly those in arid or semi-arid regions like sub-Saharan Africa - but also in impoverished communities in otherwise wealthy countries.
To Read Now
Browse through "Access to drinking water around the world - in five infographics [329]" by the Guardian, for a snapshot of international water issues.
UNICEF [330] is an organization that fights for the rights of every child worldwide through advocacy and action. It is part of the United Nations and is the best known and most powerful child advocacy organization in the world. They perform research, publish reports, collect donations, and administer aid throughout the world.
- (OPTIONAL) "Drinking Water: Equity, safety, and sustainability [331]." UNICEF. Browse through the section entitled "Social Disparities" (pp. 26 - 31). You do not have to read all of the content, but at least take a look at the charts provided. You are welcome to read the rest of the report as well.
What About Desalination?
Since about 97% of the water in the world is salt water, why can't we just desalinate (remove the salt from) this abundant source so we can use it for freshwater? Well, actually we can! This is done all over the world. According to the International Desalination Association [332], an industry organization, there are over 20,000 desalination plants in 150 countries that supply some 300 million people with at least part of their needs. Aha - problem solved! Wait, what's that you say? It is very energy intensive? It has negative environmental impacts? It is expensive? (You didn't think it would be that easy, did you?)
Desalination is a very promising technology, but it is not without its problems. You are welcome to read through the articles below, but the bottom line is that desalination plants, while a proven technology, require an immense amount of energy [333], can impact local environments in a variety of ways [334], and is quite expensive [333]. Desalination is probably necessary to satisfy the world's energy needs (and likely increasingly so), particularly in arid areas of the world. But as succinctly stated by Scientific American [334]: "Due to its high cost, energy intensiveness and overall ecological footprint, most environmental advocates view desalinization...as a last resort for providing fresh water to needy populations."
OPTIONAL Desalination Readings
The articles below provide a snapshot of domestic and international issues related to desalination. These are optional.
- "Lowering Desalination's Energy Footprint: Lessons from Israel [335]." Environmental Defense Fund.
- "UNICEF seawater desalination plant helps head off Gaza water crisis [336]." UNICEF.
- "The Impacts of Relying on Desalination for Water [334]." Scientific American.
- "Desalination is an expensive energy hog, but improvements are on the way [333]." PRI.
If you are interested in digging a little more deeply into the specific pros and cons of desalination, you can read through this article from Water Deeply [337]. The author provides links to a lot of quality information sources.
Check Your Understanding
Optional Reading
Finally, Sandra Postel summarizes many of the issues outlined above, and provides additional insight into water sustainability issues in her book chapter in Is Sustainability Still Possible? This is optional but may be helpful.
- Chapter 5 of Is Sustainability Still Possible? pp. 51 - 59.
Optional (But Strongly Suggested)
Now that you have completed the content, I suggest going through the Learning Objectives Self-Check list at the top of the page.
Biodiversity
Learning Objectives Self-Check
Read through the following statements/questions. You should be able to answer all of these after reading through the content on this page. I suggest writing or typing out your answers, but if nothing else, say them out loud to yourself.
The American Museum of Natural History in New York defines biodiversity thus:
The term biodiversity (from 'biological diversity') refers to the variety of life on Earth at all its levels, from genes to ecosystems, and can encompass the evolutionary, ecological, and cultural processes that sustain life. Biodiversity includes not only species we consider rare, threatened, or endangered, but also every living thing — from humans to organisms we know little about, such as microbes, fungi, and invertebrates.
Source: U.S. Museum of Natural History [338]
Biodiversity is the variety of life on earth, encompassing everything from the largest ecosystem to strands of DNA. It is in every living thing around us, and everything around us is part of it. I know, this all seems very poetic, and nature can be appreciated merely by virtue of its own beauty and diversity. But there are some practical, and even selfish reasons to care about biodiversity, as you will see in the readings below.
To Read Now
- "How does biodiversity loss affect me and everyone else?" [339] World Wildlife Foundation (Note the description of ecosystem services at the bottom.)
- E.O. Wilson Biodiversity Foundation - Introduction [340]
- (Optional) E.O. Wilson Biodiversity Foundation - The Diversity of Life [341]
As you can see, there are many reasons to care about biodiversity. Aside from the huge economic benefits of ecosystem services, we depend on the biosphere - and by extension, biodiversity - to sustain human life. We depend on ecosystem services for food, shelter, clothing, water, and even our oxygen. So yeah, basically everything we need to physically survive!
Life on earth is connected in innumerable ways (systems thinking, y'all!), and compromising one part of an ecosystem - including a single organism - has impacts in other areas. Unfortunately, human activity is playing a major role in ecosystem damage, including species extinction. Wilson points out [341] that:
"Species are disappearing at an accelerating rate through human action, primarily habitat destruction but also pollution and the introduction of exotic species into residual natural environments."
Humans are the main cause of the observed increase in extinction rates. Often, the impacts of this biodiversity loss are hard to predict. Donella Meadows, a well-regarded ecologist, pointed out a few of these in her essay "What is Biodiversity and Why Should We Care? [342]".
- Reforestation of the African Sahel was found to be impossible because the degraded soil was deprived of a bacteria that Acacia trees require to grow.
- North American songbirds are in decline because the areas they live in over the winter in Central America are in decline.
- European forests are more vulnerable to disruption than American forests because they are less biodiverse.
Biodiversity is a key aspect of ecosystem services, and ecosystem services are essential for human survival. (If you need a review of ecosystem services, refer to the first part of this lesson [343].) One thing that makes biodiversity difficult to manage is that we don't know how many species exist, and by extension do not know exactly how many are going extinct each year.
Many would also argue that nature has value in and of itself, irrespective of how it helps humans. This is often referred to as ecocentrism or deep ecology, which we will not discuss in more detail (but is worth looking into if you are so inclined). Humans also enjoy nature in many noneconomic ways. The "beauty of nature" is a common phrase, and being in and around nature can be both enjoyable and therapeutic. Indeed, nature is known to be therapeutic [344], as people in the emerging field of eco-psychology are documenting. I imagine most of you have enjoyed the soothing calm of a forest, desert, ocean, or even backyard. It is difficult to put a monetary value on this, but it is valuable all the same. Biodiversity makes all of this possible, and destroying biodiversity puts all of it at risk.
The 6th Mass Extinction
So how much danger are we in, and how do we know? As it turns out, it is possible to measure - or at least scientifically estimate - the rate at which biodiversity is dropping. As Carl Foulke pointed out in Chapter 2 of Is Sustainability Still Possible?, the rate of biodiversity loss as one of "The Nine Planetary Boundaries." The metric used to quantify this loss is the background extinction rate, which is defined as the number of species going extinct every year. So, how are we doing on this front? Some recently published studies can shed some light on this issue.
To Read Now
- "Sixth mass extinction: The era of 'biological annihilation' [345]." John D. Sutter, CNN.
- (OPTIONAL) "Stanford researcher declares that the 6th mass extinction is here [346]." Rob Jordan, Stanford News, or read the full, peer-reviewed article [347].
It's not every day that you read a serious article that quotes a knowledgeable person as stating that: "What is at stake is really the state of humanity." Alas, that is where we find ourselves on this issue. There is unequivocal evidence that populations of many species have dropped considerably since humans became the dominant species, and as the article states, the background extinction rate is probably at least "100 times what would be considered normal" (see the optional reading above for some insight on this), which may be a conservative estimate. As indicated in the article, there is some controversy regarding this issue - the Atlantic article [348] that Sutter links to provides a good, even-keeled assessment of some of them - but this primarily has to do with difficulty in determining the rate of extinction, and whether or not it should be considered a "mass extinction" or just a dangerous level of it. Any way you slice it, humans are causing species to go extinct at an accelerated rate for a variety of reasons, including land use change (especially food production), poaching, climate change, ocean acidification, and more.
It is important to point out that it is very unlikely that we have crossed an extinction threshold from which we cannot recover, but many signs point to us risking catastrophe. There is hope, but we will likely have to take action very quickly to prevent the worst outcome(s). Before this happens, it will have to be recognized as a problem, which unfortunately is only happening very slowly.
Check Your Understanding
Optional (But Strongly Suggested)
Now that you have completed the content, I suggest going through the Learning Objectives Self-Check list at the top of the page.
Summary and Final Tasks
Summary
That's it for this week! Please make sure you complete the two required assignments listed at the beginning of this lesson. This week, we applied a lot of the concepts in Lessons 1 and 2 to key sustainability issues. You should be able to do the following after completing the Lesson 3 activities:
- utilize characteristics of critical thinking;
- analyze the credibility of information sources;
- identify characteristics of the Anthropocene;
- explain how the greenhouse effect increases the average surface temperature of the earth;
- identify evidence for anthropogenic climate change;
- analyze equity impacts of sustainability considerations, such as climate change and water scarcity;
- identify characteristics of the 6th Mass Extinction;
- critique the credibility of information sources;
- explain the benefits of biodiversity;
- analyze sustainability impacts of freshwater availability;
- identify equity implications of access to fresh water;
- analyze the sustainability implications of coal, oil, natural gas, nuclear, and renewable energy; and
- apply the precautionary principle to sustainability considerations.
The Language of Sustainability
We went over a lot of fairly heavy concepts this week. Hopefully, this list will help spark some memories of the content, both now and as we move forward:
- defining characteristics of critical thinking (I suggest referring back to this "Critical Thinking" page frequently)
- evaluating information sources
- ecosystem services, Anthropocene, biosphere
- greenhouse effect, enhanced greenhouse effect, greenhouse gas, anthropogenic, anthropogenic climate change, methane vs. carbon dioxide as greenhouse gas, the precautionary principle
- biodiversity, 6th Mass Extinction, background extinction rate
- freshwater, economic water scarcity, physical water scarcity, major users of water, water footprint, desalination
Reminder - Complete all of the lesson tasks!
You have finished Lesson 3. Check the list of requirements on the first page of this lesson and the syllabus to make sure you have completed all of the activities listed before the due date. Once you've ensured that you've completed everything, you can begin reviewing Lesson 4 (or take a break!).
Complete all activities in Lesson 3. The quiz may include a variety of question types, such as multiple choice, multiple select, ordering, matching, true/false and "essay" (in some cases these require independent research and may be quantitative). Be sure to read each question carefully.
Unless specifically instructed otherwise, the answers to all questions come from the material presented in the course lesson. Do NOT go "Googling around" to find an answer. To complete the Activity successfully, you will need to read the lesson, and all required readings, fully and carefully.
Each week, a few questions may involve research beyond the material presented in the course lesson. This "research" requirement will be made clear in the question instructions. Be sure to allow yourself time for this! You will be graded on the correctness and quality of your answers. Make your answers as orderly and clear as possible. Help me understand what you are thinking and include data where relevant.
For any other assignments (e.g., journal or discussion board), it will be helpful to look at the rubric before answering. You will see a button that allows you to view it below the assignment.
These activities are to be done individually and are to represent YOUR OWN WORK. (See Academic Integrity and Research Ethics [221] for a full description of the College's policy related to Academic Integrity and penalties for violation.)
The activities are not timed but do close at 11:59 pm EST on the due date as shown on the Course Calendar.
If you have questions about the assignment, please post them to the "HAVE A QUESTION?" Discussion Forum. I am happy to provide clarification and guidance to help you understand the material and questions. Of course, it is best to ask early.
Lesson 4: Energy In-Depth
Overview
Hopefully, by this point, you have a reasonably good grasp of overarching and specific topics within sustainability. Please keep in mind that all of these concepts are intertwined and overlapped. What can I say? The real world is a messy, complicated place. But, hopefully, you will keep these in mind as you move forward in this class and in your life. These will pop up in the readings, book, and other materials in this course, and I hope that you will recognize the terms and concepts as you encounter them. Feel free to look back at these lessons if you need a refresher.
In this lesson, you will take a relatively deep dive into various sources of energy, including the fossil fuels, nuclear, and renewables. These were all introduced in Lesson 1; but in this lesson, we will look at these sources through the lens of sustainability. Specifically, we will investigate how much of each source is probably left (supply), how feasible continued use of the source is (feasibility), and some (not all, mind you!) sustainability implications of each source.
Lesson Objectives
By the end of this lesson, you should be able to:
- analyze current supply and feasibility of a variety of energy sources;
- differentiate between various projections of remaining energy supply and the impacts of technology and price considerations on them;
- describe the trends in U.S. electric power production with regards to fuel use and carbon dioxide emissions;
- describe the complexity of predicting oil supply and prices; and
- describe and analyze sustainability implications of contemporary energy use.
What is due this lesson?
Please note that the quiz can only be taken once. You have unlimited time to complete it prior to the deadline, and can save your progress and pick up where you left off at a later time. See the Assignments and Grading section of the syllabus [1] for tips on how to do this. Once you submit the quiz, you cannot change answers. All saved answers will automatically be submitted at the deadline if you have not submitted them.
| Requirement | Submission Location |
|---|---|
| Lesson 4 Quiz | Canvas - Modules tab > Lesson 4 |
| Continue posting to the Yellowdig discussion board. | Canvas - Modules tab > Lesson 4 |
| (Optional) Lesson 4 Extra credit quiz | Canvas - Modules tab > Lesson 4 |
Questions?
If you have any general course questions, please post them to our HAVE A QUESTION? discussion forum. I will check that discussion forum regularly to respond as appropriate. While you are there, feel free to post your own responses and comments if you are able to help out a classmate. If you have a question but would like to remain anonymous to the other students, email me..
If you have something related to the material that you'd like to share, feel free to post to the Coffee Shop forum, also under the Discussions tab.
Sustainable Energy?
Okay, now let's tie this all together. Modern society is inextricably tied to the availability of energy, as we explored in Lesson 1. We just went through more than two full lessons outlining a lot of reasons to be concerned about the sustainability of modern society, in terms of the 3E's of sustainability and otherwise. Putting these two broad concepts together begs the question: What is sustainable energy?
At risk of sounding glib, the short answer is that there is no short answer. You will probably not be surprised to know that there is no single or even "correct" answer, that is to say, an answer that everyone can agree with. This has a lot to do with the fact that a singular definition of sustainability remains elusive, but in addition to that there is a lot of uncertainty with regards to both the long- and short-term impacts of energy use, and even how much energy (non-renewable in particular) is left to harvest. I want to be clear that the analysis that follows is not meant to answer the question once and for all, but to help frame some of the key considerations to make when answering the question. As you'll see, I've divided the analysis into sections for a number of energy sources, and subsections that provide information regarding supply, feasibility, and sustainability impacts.
Important Note to Keep in Mind
One last thing you should consider prior to reading through this lesson: No matter what mixture of energy sources/technologies that we decide to use, we cannot continue to emit CO2 at the current rate for long. As detailed in the previous lesson, the reality of anthropogenic climate change and its negative impacts have near universal agreement among experts. The Intergovernmental Panel on Climate Change (IPCC) has determined that we need to limit warming to 1.5 degrees C (about 3 degrees F) above pre-industrial levels to maximize our chances of avoiding climate catastrophe but no more then 2 C. (It is about 2 F warmer already!) The following is a quote from the latest report [349] from the IPCC, which was published in 2023. This is from the Summary for Policymakers [350]. (A smorgasbord of climate change information for you energy policy nerds out there!)
Pathways that limit warming to 1.5C (>50%) with no or limited overshoot reach net zero CO2 in the early 2050s, followed by net negative CO2 emissions. (source: Synthesis Report of IPCC Sixth Assessment Report, Summary for Policymakers, p. 21.)
In case you don't speak climate scientist, this means that we need to be 100% carbon neutral by around 2050 globally if we want the best chance of preventing the worst impacts of climate change. The UN published a report in 2018 that stated that to reach this, we need to cut global emissions by 40% - 50% by 2030 (that's really not long from now!) (See the NPR summary [351] if you are interested). In case you were wondering, global emissions have have only increased since the start of the Industrial Revolution (see below). In addition, a report authored by 13 federal agencies [352] in the U.S. found that consequences for the U.S. will be dire if emissions are not significantly reduced. This report was particularly notable because it was released by the Trump Administration, which is no friend to climate regulation. (It was only released because it is mandated by Congress, and was immediately downplayed by the Administration, but still...)
Please keep this in mind as you read through these summaries. There is near consensus that humans must significantly reduce net emissions to near zero by mid-century, or we face a very dire future. No energy solution should be considered sustainable in the long term if it emits any carbon dioxide, unless carbon reduction technologies are sufficient to offset these emissions. Right now, it is much cheaper to not emit in the first place than to capture and store them.
Coal
Learning Objectives Self-Check
Read through the following statements/questions. You should be able to answer all of these after reading through the content on this page. I suggest writing or typing out your answers, but if nothing else, say them out loud to yourself.
We'll start with the most straightforward aspect: how much do we have, and how long will it last? That is an obvious question to ask, because if we are going to run out anytime soon, it is clearly not sustainable.
Supply
To Read Now
Most energy sources have an "industry organization" or "industry association" associated with it. These organizations are funded by companies in the industry (e.g., the World Coal Association [355] is funded mostly by coal producers, energy companies that rely on coal, and others [356]) and promote policies that will increase the use of the energy source. They often fund and perform research, devise ad campaigns, lobby various levels of government, write press releases, and more. You should not view them as impartial - they exist solely to promote the energy source. However, they are generally a reliable source of data, e.g., how much coal was used in a year, the portion of GDP from coal, etc. They are also good sources of information regarding industry technology and trends.
But please keep this in mind when looking for energy data: if at all possible, you should use information (including data) from the EIA (Energy Information Administration), IEA (International Energy Agency), World Energy Council [357] (WEC), or some other reliable, impartial source. Note that these industry organizations will usually use data from one of these impartial sources, but it's always best to go to the original source.
- "How Much Coal is Left? [358]" U.S. EIA.
First and foremost, note all of the various caveats issued in these reports. As the EIA notes: "The amount of much coal that exists in the United States is difficult to estimate because it is buried underground." (Probably not what you want to hear from the authority on the topic, but bear with me.) The same goes for the rest of the world, and it is more difficult in a lot of other countries because even less is known about the underground resources. Also, there is a difference in the basic assumptions regarding the statistics.
Terminology is important to keep in mind.
- Demonstrated reserve base [359] is the amount of coal that is estimated to be in place and could conceivably be mined commercially. Some of this is difficult to get to because of access issues (technical, political, etc.).
- The Estimated recoverable reserves [360] are the portion of the demonstrated reserve base that can be realistically recovered, taking into consideration restrictions (e.g., property rights, land use conflicts, and physical and environmental restrictions). Estimated recoverable reserves are a subset of the demonstrated reserve base, and thus are always smaller. They do not take economic feasibility into account.
- Recoverable reserves at active mines [361] are "the amount of recoverable reserves that coal mining companies report to EIA for their U.S. coal mines that produced more than 25,000 short tons of coal in a year. Basically, they epresent the quantity of coal that can be mined from existing reserves at active mine. The EIA noted in an older page that they "essentially reflect the working inventory at producing mines."
- You will also sometimes see total resources identified, which are a scientific estimate of all coal in the U.S., including coal that has yet to be discovered. It is not likely that all of this can be accessed, and further, we would not want to because it would require widespread destruction of the landscape.
All of these quantities use some estimation, with the bigger reserves requiring more estimation, so take all of them with at least a grain of salt. They should be considered a good estimate, with the estimated recoverable reserves probably being a reasonably good (but possibly conservative) estimate of what's left and can be realistically mined. You don't need to memorize all of these terms, by the way! It wouldn't hurt, mind you, but the goal here is for you to understand that coal resources are known to varying degrees, and for you to be conscious of which estimates companies/organizations/people cite.
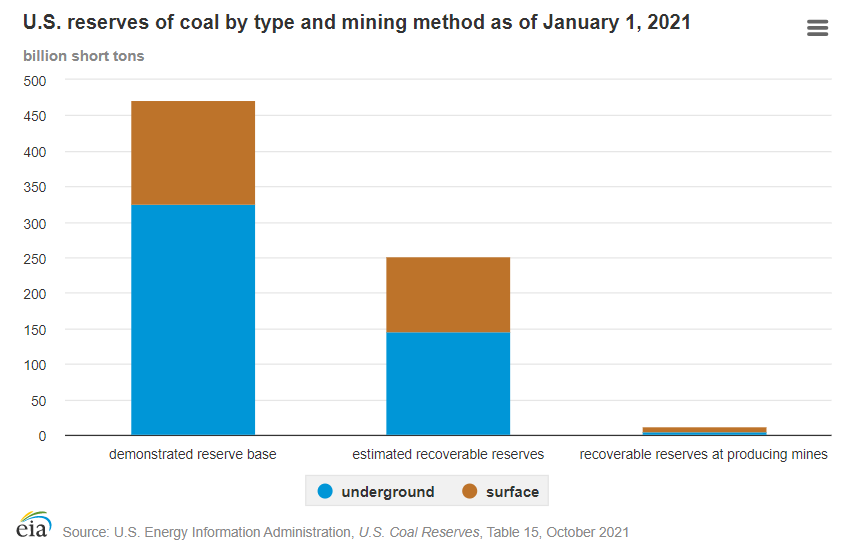 [362]
[362]
US Coal resources and reserves
Billion short tons as of January 1, 2021
Demonstrated reserve base (measured and indicated: 471.81 total (underground - 325.24 billion, surface - 146.57 billion)
Estimated recoverable reserves: underground - 251.54 total (145.57 billion, surface - 105.97 billion)
Recoverable reserves at active mines: 12.5 billion (underground - 5.5 billion, surface - 7.7 billion)
Tons of Tons and Tonnes
There are many benefits to living in the United States, but having easy to understand energy units is not one of them. We use a mixture of Imperial and English units, with the system usually referred to as U.S. Customary units. Most of the rest of the world uses metric units, which are also considered SI units (Systéme international d'unités). Got all that? Good. (Here is an explanation of how convoluted the non-metric units are [363], if you are so inclined.)
Coal in the U.S. is usually measured in tons, which is a unit I'm sure you have heard of, and likely used, before. A U.S. ton is equivalent to 2,000 pounds. However, to prevent confusion with an Imperial ton, the U.S. ton should be referred to as a short ton. A long ton, on the other hand, weighs 2,240 pounds. Finally, the metric ton, which is also known as the tonne, is equivalent to 1,000 kg, or about 2204.6 lbs. To summarize:
- 1 short ton (U.S. Customary Unit) = 2,000 lbs.
- 1 metric ton (1 tonne) (metric unit)= 2,204.6 lbs.
- 1 long ton (Imperial unit) = 2240 lbs.
Credit: Encyclopaedia Britannica [364] and U.S. EIA [365]
"Very impressive" you might be thinking, but what does it all mean for sustainability of supply? Glad you asked! In 2023 the EIA stated that: "Based on U.S. coal production in 2020, of about 0.535 billion short tons, the recoverable coal reserves would last about 470 years, and recoverable reserves at producing mines would last about 25 years" (FYI, the year before they said that there were 357 years, which demonstrates that these calculations are scientific approximations. The increase in 2020 was because we were mining less coal, as you will see below). How do they get this number (357 years)? Hint: it is based on the total production and the Estimated Recoverable Reserves (ERR).
So the years of supplies remaining went from 261 years to 348 years to 325 years to 332 years to 357 years, all in the span of four years. The moral of this short little story: All predictions of remaining resources on a large scale should be considered scientific estimates. They provide a sense of remaining supplies, but that can change quickly as supply and/or demand change.
Note that this assumes that coal production rates will remain the same and that technology will not change. And this, of course, assumes that this it is reasonable to mine all remaining U.S. resources, given environmental and social impacts, but it is a good starting point for the U.S. The same set of assumptions (with different numbers) are used to estimate how long the world will have coal - the recoverable reserves and current levels of coal production. According to the World Coal Association, there are between 110 years and 121 years of reserves available worldwide.
Feasibility
Coal has been used en masse as an energy source since near the beginning of the Industrial Revolution in the late 1700s. The infrastructure for coal mining, transportation, and use (mostly in power plants) is well-established and if it were not for the environmental and social impacts, coal would be a good source of energy. It is energy-dense, and we know how to use it. (I think there's a ZZ Top song about that.) It turns out that it is also pretty cheap to use (ignoring externalities, of course!).

As you can see from the chart, coal is the cheapest fossil fuel for generating electricity on a dollar per million Btu basis. This, of course, does not include external costs.
| Year | Coal | Natural Gas | Petroleum |
|---|---|---|---|
| 2004 (approximate numbers) |
1.5 | 6.0 | 4.1 |
| 2006 (approximate numbers) |
1.9 | 7.0 | 6.0 |
| 2008 | 2.07 | 4.11 | 10.87 |
| 2010 | 2.27 | 3.26 | 9.54 |
| 2012 | 2.38 | 2.83 | 12.48 |
| 2014 | 2.37 | 3.31 | 11.60 |
| 2016 | 2.11 | 2.47 | 5.24 |
| 2017 | 2.06 | 7.10 | 3.37 |
| 2018 | 2.06 | 9.68 | 3.55 |
| 2019 | 2.02 | 9.07 | 2.89 |
Despite the relatively low cost of fuel, coal is rapidly being replaced by natural gas and to a lesser extent, renewable energy. This is partially due to the lower emissions of natural gas, but mostly due to basic economics [368]. Energy generators want to make a profit like everyone else, and right now, natural gas and some renewables are simply more profitable, particularly in the U.S. In addition, investors and banks are less likely to invest in coal and insurance companies are increasingly likly to refuse to insure new power plants due to the risks involved with climate change and future regulation. See the suggested reading below for some insight into some of these issues on domestic and international scales.
Suggested Reading
Coal use has been on the decline in the U.S. for the past 15 - 20 years. Feel free to read the following article for some insight into what is causing this, but also some of the issues with coal on an international scale. Note the prominent role that insurance companies (and re-insurance companies) are playing.
- "As Investors and Insurers Back Away, the Economics of Coal Turn Toxic [369]" by Yale Environment 360, March 2020.
It is no exaggeration to say that coal has played a starring role in delivering the energy that was used for the development of the U.S. and many other countries (especially Western countries) in the past 200+ years. It also currently provides over 40% of global electricity (according to the World Coal Association), and is the primary source of electricity for many "developing" countries like China and India Coal is relatively cheap (again, as long as you don't include external costs), abundant, and relatively easy to use. There is a reason we've been using it at such a high rate for so long! So far, so good. So what's the catch?
Sustainability Impacts
Now the bad news: coal has a lot of negative environmental and social impacts.
To Read Now
- "Coal and the Environment [370]." U.S. EIA
- (Optional) "Coal's Devastation [371]." The Atlantic.
- (Optional) "U.S. Mine Disasters Fast Facts [372]." CNN (You can just browse the article.)
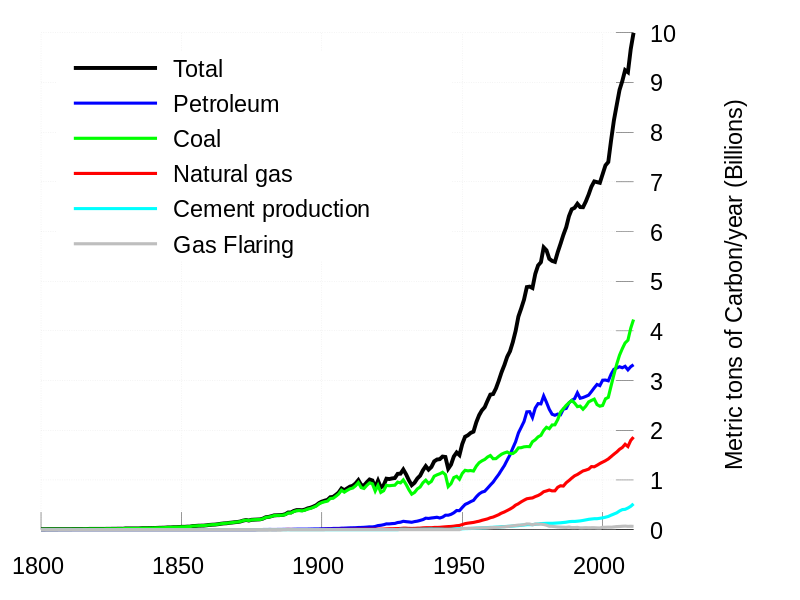
Probably the most important sustainability issue with coal is that it is so carbon-intensive. It emits about twice the carbon dioxide per Btu as natural gas and is responsible for more carbon dioxide emissions than any other energy source, and the energy sector is the largest source of carbon dioxide emissions worldwide. [374]

One possible solution to this is carbon capture and sequestration (CCS) [375], which is a process that can capture CO2 and bury it (i.e., sequester it) in underground rock formations. Under ideal circumstances, up to 90% of the carbon dioxide will turn into solid rock and thus not pose a leakage threat, though these "ideal" circumstances have proven to be [376] elusive. (This is usually what is referred to as "clean coal" technology, though it is notable that only the carbon emissions are reduced in "clean coal" plants. Mining waste and particulates and other emissions still make this a relatively "dirty" source of energy, which causes "clean coal" to have higher mortaility rate [376]s than other sources.) While promising, there is some indication [377] that CCS might not be as effective as once hoped. It is only beginning to be demonstrated on a commercial scale [378], and some plants have had major issues [379], so the jury's still out.
One interesting irony is that carbon dioxide can be injected into oil wells to increase output, and has been since 1972 [380]. In addition to this, as pointed out in the EIA article above [370], about 11% of the methane emissions in the U.S. are due to venting of methane gas from underground coal mines. Recall that methane is about 30 times as powerful as carbon dioxide with regards to climate change.
While relatively inexpensive in simple terms (not including externalities), the external costs are likely quite high due in particular to negative health impacts (as you read in Lesson 1). But as you saw from the EIA, there other environmental concerns, such as mercury pollution, acid rain (which has mostly been mitigated through technology/policy), and remnants of power generation like fly ash. Coal mining can be a risky business, as you may remember from the Upper Big Branch Mine disaster [381] that killed 29 miners in West Virginia in 2010. There have been many other accidents in the U.S. as well, as indicated above. China is the world leader in coal mining fatalities, according to the Wall Street Journal [382], including over 1,000 killed in 2013 and 2012, with more than 33,000 deaths in the past decade. There is also environmental damage that often results from mining and mining waste. Coal is a major source of particulate pollution, and contributes to the 1.1 million deaths in China from air pollution [383] in 2016 and 1.2 million deaths in India in 2017
In short, coal is a reliable energy source, and is generally a relatively cheap source of energy as long as externalities are not included. If externalities were to be included, the price would undoubtedly increase, especially if the social cost of carbon and negative health impacts were included. CCS provides some hope for reducing the carbon dioxide emissions of coal use, but other significant sustainability problems will persist even with carbon capture.
Check Your Understanding
Optional (But Strongly Suggested)
Now that you have completed the content, I suggest going through the Learning Objectives Self-Check list at the top of the page.
Natural Gas
Learning Objectives Self-Check
Read through the following statements/questions. You should be able to answer all of these after reading through the content on this page. I suggest writing or typing out your answers, but if nothing else, say them out loud to yourself.
Natural Gas
Unless you've been hiding under a rock for the past 20 years or so, you have heard about natural gas in the news. If you have heard about it, it was most likely in relation to hydraulic fracturing, or simply "fracking." This is a VERY controversial topic at the moment, and with good reason (as we'll see below). Because of this, you have to be careful where you get your information (good thing you are taking this course!). Our old friend Hank provides a pretty clear and unbiased description of fracking in the video below (4:32 minutes).
In case you hadn't heard, we humans use a lot of oil and gas these days. Just a couple of sorts of hydrocarbons, organic compounds made out of hydrogen carbon atoms. They are a magnificent source of stored energy running a car engine or a fighter jet or a weed whacker or a power plant. Hydrocarbons are pretty useful. A lot of the world's precious petroleum comes from the Middle East, but that puts a few of the world's countries in the position of having all of the useful oil and gas. So, of course, the rest of us are interested in hunting down some domestic sources. Actually, turns out the Middle East doesn't have the hydrocarbon market cornered, they just have a lot more liquid petroleum in most places. But a lot of the rest of the world has reserves of natural gas. Gaseous hydrocarbons like methane, propane, and butane.
Usually found deep underground in giant beds of shale, rock that was formed from the floors of ancient oceans, natural gas is likely how your water gets heated and maybe even your air. Burning it for electricity is cleaner and more efficient than coal, and unlike oil when it spills, it just vents into the atmosphere instead of spreading out in huge slicks over the ocean. The problem with natural gas has always been, how do we get at it? We know it's there, but we can't get it!
Since the forties, oil companies have known that breaking up the rocks in deep underground formations can increase the productivity of wells. See it's not just one big pocket of black gold down there. Oil and gas can occur in thousands of little pockets, and by fracturing the rocks around these pockets, the gas is released and can be collected. Usually, this fracturing involves pumping millions of gallons of chemically treated water into deep shale formations. We're talking a mile or more underground at extremely high pressures. This fluid cracks the shale or widens existing cracks, freeing the hydrocarbons and making a path for them to flow toward the well. So that's how it's done basically, and some people are so unbelievably pumped about this technology they're building little graven images to it, and going to natural gas wells on Sunday mornings.
But then, some scientists are like - not so fast you guys, cuz fracking isn't all butterflies and cupcakes. For starters, it uses a whole lot of water. It takes up to seven million gallons to frack a single well and at least 30 percent of that water is trapped in the shale thousands of feet below the groundwater aquifer, so it's gone for good. Fracking fluid isn't just water; it's sand which helps keep the cracks open once they're formed, but also chemical additives which can vary from well to well and are often confidential. These additives do things like thicken the water to help suspend the sand or prevent mineral buildup in the pipe, and some are things you might find under your kitchen sink. Others, like benzene and methanol, are pretty toxic.
Some concerns about the contents of these fracking fluids, not to mention radium, corrosive salts, and other stuff that comes back up from a mile underground, have led places like Pennsylvania to prohibit fracking outfits from sending their wastewater to local treatment plants and although fracking, when done correctly, shouldn't contaminate drinking water aquifers, that doesn't mean it hasn't happened.
Subterranean systems are mysterious, and it's impossible to tell how interconnected the shale deposits might be with groundwater. If the fracturing is too effective, groundwater aquifers and shale deposits containing newly injected fracking fluid can mix. Although it's hard to say how many cases of contamination have been caused by improperly installed or maintained fracking wells, improperly bored or sealed wells have contaminated drinking water in several sites in the US, resulting in energy companies being fined for polluting water supplies. While natural gas is a far cleaner fuel than coal, the fact that it doesn't spill and instead vents to the atmosphere is also problematic for climate change. Methane is a potent greenhouse gas and if it isn't burned as it vents from fracking wells, it can contribute even more to global warming.
And finally, earthquakes. It's crazy, but some US states like Oklahoma, Texas, and Colorado have been experiencing a significant rise in seismic activity, which seems to be corresponding to the fracking boom. Some studies are suggesting that the disposal of wastewater back into used wells is causing the pressurized water to seep through cracks onto old fault lines causing many more earthquakes than normal even in places where seismic activity is rare.
So, fracking - creating a new oil and gas boom in the US, sure, but it might not be all it's fracked up to be. Sorry, we didn't make any Battlestar Galactica jokes. So, if you want you could put those down in the comments. If you have any questions or comments or just want to argue about it, the comments are there for that as well. There are also sources, if you'd like to check those out, that would be good. And if you want to keep getting smarter with us here at SciShow, you can go to youtube.com/scishow and subscribe.
One popular misconception is that fracking has only been around since the early 2000's or so. As Hank explains, this is simply not the case. Hydraulic fracturing has been known to increase the output of gas (and oil!) wells since the mid-1900s. The main innovation that has caused the recent fracking boom is directional drilling (sometimes called horizontal drilling). Until relatively recently, oil and gas wells were generally drilled in a straight line. But directional drilling allows operators to change the direction of the drill bits so that they can trace the path of underground rock layers (which are rarely straight up and down). This allows for significantly more gas output per well and is what mainly facilitated the fracking boom.
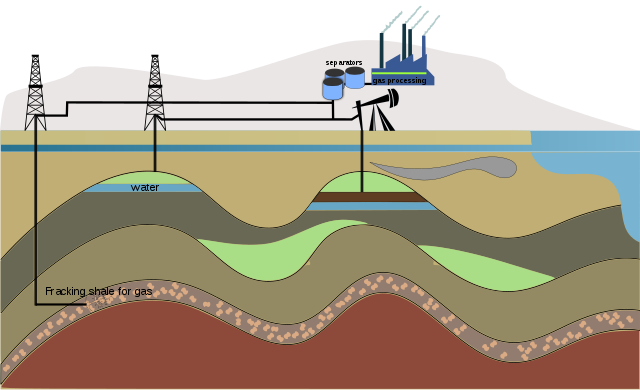
Supply
Like coal, it is impossible to determine the amount of natural gas reserves available in the U.S. or worldwide. First of all, it's underground, so we cannot directly measure it, though reasonable estimates can be made. But more importantly, as technology changes, the proved natural gas reserves change as well. Most of the data you will see are based on "proved reserves," which the EIA defines as "estimated volumes of hydrocarbon resources that analysis of geologic and engineering data demonstrates with reasonable certainty are recoverable under existing economic and operating conditions." (Source: US EIA [386]). Basically, proved reserves are a reasonable estimate of the amount of natural gas that can be recovered given current technology, and for a profit.
The upshot to this is that 1) technology is changing rapidly, as evidenced by the boom in natural gas in the past 10 years or so, which is due entirely to fracking, and 2) as more test (exploratory) wells are drilled, more natural gas is discovered. See the chart below for the result of this moving target in the U.S.
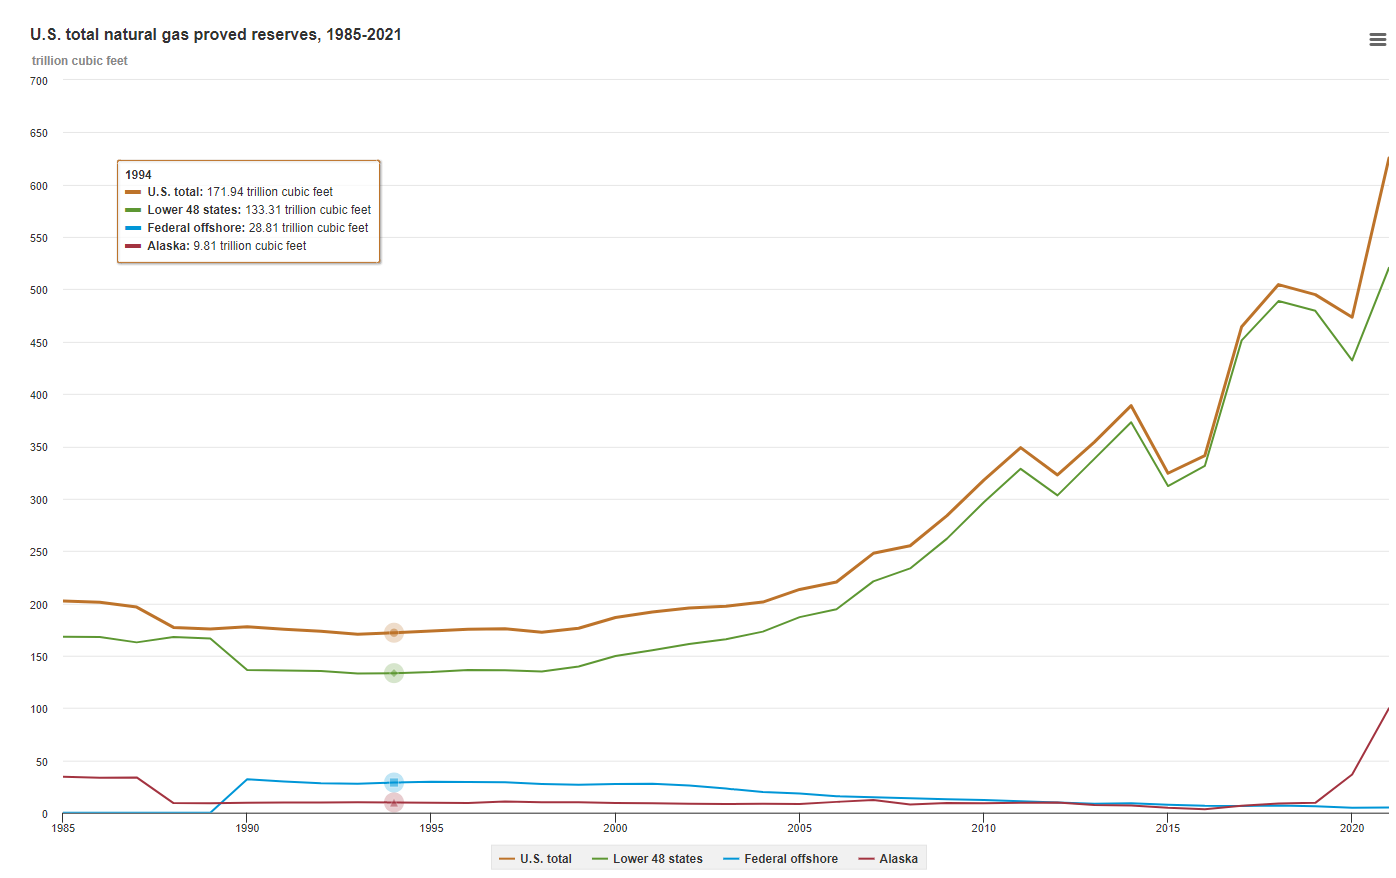
What is particularly interesting about this chart is that the proved reserves have mostly increased even as we have continued to produce and use more natural gas. This can seem counterintuitive because it seems logical that as we take more of the gas out of the ground, less would be left. This is technically correct, but at the moment, the industry is less concerned with how much is left than how much is available. For the reasons indicated above - primarily technological advance - more is available even though less is left. The increase in production in the U.S., as well as the projected increase, can be seen in the chart below.
I'm sure you noticed the dramatic drop in proved reserves from 2011 to 2012 and 2014 to 2015. 2015 has a somewhat simple explanation: "Declines in natural gas prices in 2012 and 2015 contributed to reductions in proved reserves estimates in those years", according to the EIA [388]. Again, this is a quirk of how we define proved reserves. Since proved reserves refer to the natural gas that is "economically recoverable," if prices are down and/or projected to continue, the proved reserves go down with them because it is more difficult to make a profit. (For a more in-depth discussion of these drops, see the optional reading below.)
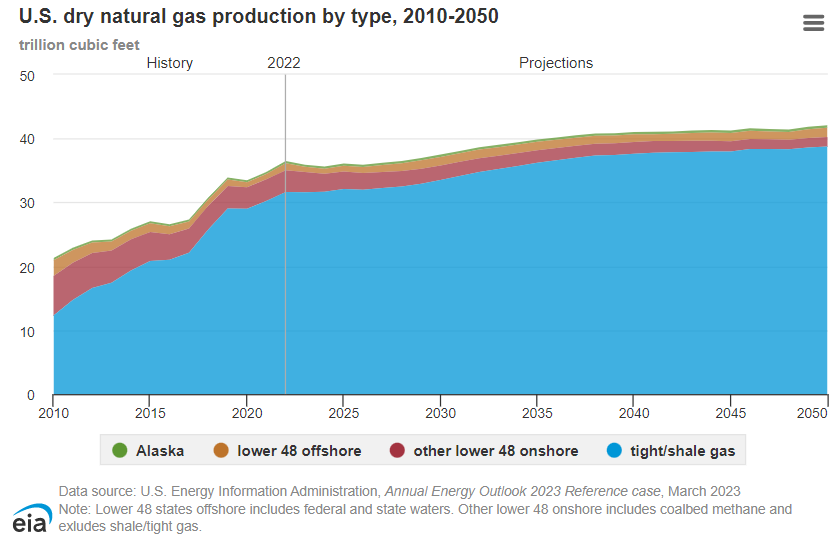
In the chart above, shale gas refers to gas that is locked up in the pores of shale in underground layers, as described in the fracking video above. It is clear that this is the biggest source of natural gas in the U.S. and is only projected to grow. (Seriously - look at that giant blue blob in the figure above! That's mostly shale gas.) Tight gas refers to gas that is locked up in other formations like low-permeability sandstone. For a full explanation of the terms, see the EIA website: Natural Gas Explained [390]. One important thing to point out is that unlike oil wells, fracked gas wells rapidly lose production over a very short period of time. The table below shows the reduction in the production of wells in various parts of the U.S.

So, if the well output declines, how do companies keep up production? Drill more wells! In order to maintain supply, wells must be drilled at a very high rate.
Optional
What the heck happened to natural gas reserves in 2012 and 2015?
You probably noticed a sharp drop in proved reserves from 2011 to 2012 and 2014 to 2015 in the chart above. It should jump off the page at you. So what happened that year? Did the technology all of a sudden decline? Did we pull out a record amount of natural gas? Actually, this was an adjustment known as a "revision." As explained by the EIA: "Revisions primarily occur when operators change their estimates of what they will be able to produce from the properties they operate in response to changing prices or improvements in technology." Recall that proved reserves depend upon financial feasibility and the state of the technology. This is an inexact science, and the natural gas industry is constantly adjusting expectations based on those changing factors. The energy industry is nothing if not dynamic!
At any rate, you can see in the chart below that the proved reserves had MAJOR downward "revisions" in 2012 and 2015. As noted above, this was primarily the result of the price of natural gas dropping, causing companies to revise the estimate of economically recoverable natural gas downward.
You might also notice that the most consistent negative impact on proved reserves is production, i.e., what is being extracted (represented as yellow columns). But in most years, operators make up for production with increased "extensions" which are "additions to reserves that result from additional drilling and exploration in previously discovered reservoirs." So basically, drillers are usually able to find ways to get more gas out of the same wells faster than they actually extract gas (at least according to their estimates).
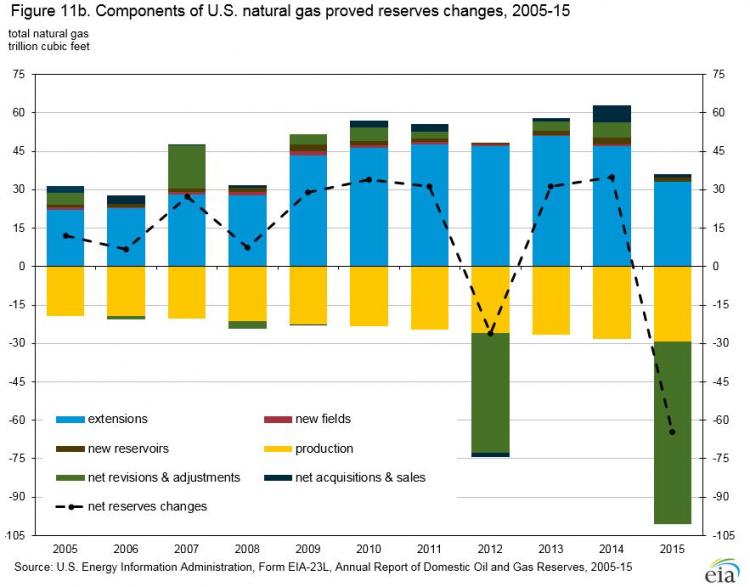
As you can see, when it comes to determining how much natural gas is left, well, it's complicated. (Sorry if you are tired of reading this phrase by now!) But hopefully, at this point, you have a better understanding of how the remaining amount is quantified.
While knowing the (approximate) amount of accessible natural gas is helpful, it is perhaps more useful to know how long these supplies will last. I would now like you to think about how, using proved reserves as a starting point, you could calculate the number of years of supplies remaining. (Hint: You also need to know the rate at which supplies are used.) The EIA provides the following analysis and explanation on their "How much natural gas is left and how long will it last [394]" webpage:
The U.S. Energy Information Administration estimates in the Annual Energy Outlook 2021 that as of January 1, 2019, there were about 2,867 trillion cubic feet (Tcf) of technically recoverable resources (TRR) of dry natural gas in the United States. Assuming the same annual rate of U.S. dry natural gas production in 2019 of nearly 34 Tcf, the United States has enough dry natural gas to last about 84 years. The actual number of years the TRR will last depends on the actual amount of dry natural gas produced and on changes in natural gas TRR in future years.
Technically recoverable reserves include proved reserves and unproved resources. Proved reserves of crude oil and natural gas are the estimated volumes expected to be produced, with reasonable certainty, under existing economic and operating conditions. Unproved resources of crude oil and natural gas are additional volumes estimated to be technically recoverable without consideration of economics or operating conditions, based on the application of current technology. EIA estimates that as of January 1, 2019, the United States had about 475 Tcf of proved reserves and 2,392 Tcf of unproved reserves of dry natural gas.
As with coal, to determine the approximate number of years left, you just divide the estimated reserves by the annual use. (Interestingly, the EIA calculated that we would only have about 80 years left two years ago and 400 trillion fewer cubic feet.) It is notable that the EIA's number includes unproved reserves, and thus should be seen as a high-end estimate.
Optional Readings
- "How Much Natural Gas is Left? [387] US EIA.
- "Just How Long Will U.S. Gas Supplies Last? [395]" Peter Kelly-Detwiler, Forbes Magazine.
Feasibility and Sustainability Issues
Like coal, the natural gas infrastructure is well-established, including wells, pipelines, and power plants. As you saw in the figure on the previous page, natural gas is relatively cheap. The recent boom in natural gas production has provided a lot of high-paying relatively low-skilled jobs and has generated millions of dollars in royalties for landowners. Increased use and cheaper (upfront) cost of natural gas has allowed the widespread replacement of coal-fired power plants, which has resulted in natural gas increasing its share of U.S. electricity production from 24% in 2010 to about 33% in 2015 (when it was about even with coal), to nearly 40% as of 2021. During the same period, coal's share has dropped from 45% to about 22%. This is a major change in just over a decade!
Good to Know: Electricity Fuel Mix
As budding energy and environmental experts, you should be familiar with industry terminology. The percent of electricity that a country (or other area) gets from various sources is referred to as "electricity fuel mix." Figure 4.12 is thus a chart that details electricity fuel mix in the U.S. The total energy by source (e.g. the Sankey chart we looked at in lesson 1) is the "energy fuel mix."
One major benefit of this is that it has contributed to reduced CO2 emissions that come from electricity generation in the U.S. These emissions are at their lowest level since 1993. The EIA explains that: "A shift in the electricity generation mix, with generation from natural gas and renewables displacing coal-fired power, drove the reductions in (CO2) emissions." This is a major benefit of natural gas (and renewable energy of course!). As indicated previously, burning natural gas results in approximately half of the emissions from an equal amount of coal energy.
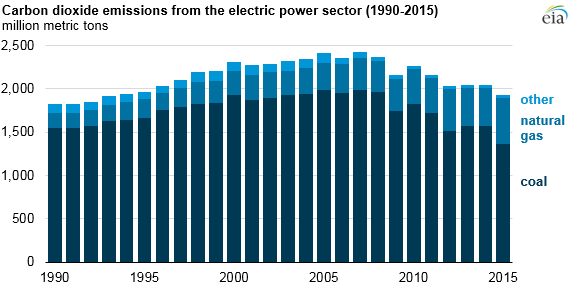
But this is not the whole story regarding emissions. Remember that while natural gas emits about half of the CO2 as an equivalent amount of coal when burned, natural gas itself is about 30 times as powerful as carbon dioxide in terms of greenhouse effect impact over a 100 year period and about 80 times as powerful over a 20 year period. One result of this is that methane leaks throughout the natural gas supply chain (from the well to the end-user) counteract some of the positive impacts of natural gas being a relatively clean-burning fuel. How much of an impact is open to debate. Though some research [400] has indicated that the emissions from leaks are vastly underestimated and may be worse for climate change than coal, a recent report by the International Energy Agency [401] found that the best scientific estimates indicate that "on average, gas generates far fewer greenhouse-gas emissions than coal when generating heat or electricity, regardless of the timeframe considered." In other words, from a climate change perspective, the IEA believes that it is better to use natural gas than coal. But that is up for debate.
So that solves the debate, right? Not so fast! The IEA makes it clear in the same report that: "The environmental case for gas does not depend on beating the emissions performance of the most carbon-intensive fuel, but in ensuring that its emission intensity is as low as practicable" (my emphasis added). In other words, based on what we know about the GHG-climate change connection, we should not just use the "lesser of two evils" (those are my words, not theirs), but seek to reduce emissions as much as possible, regardless of the source. They also point out that about half of global leakage-based emissions could be stopped with no additional cost, and in many instances, it would actually save money to reduce emissions. And even where it would cost money to prevent the leaks, in all regions it is at least as cheap or cheaper to stop methane leaks than to reduce emissions in other ways.
Optional/Suggested Reading
As noted above, natural gas is a very controversial issue, specifically with regard to fracking. Some of the issues involved are outlined in the articles below. To say that this only scratches the surface of information on this topic is a massive understatement! I encourage you to research this issue further.
- (Strongly suggested) "Pros and cons of fracking: Research updates [402]." John Wihbey, Yale Climate Connections.
- (Optional) "Natural Gas and the Environment [403]. [404]" U.S. EIA.
- (Optional) "Fracking Has Not Had Big Effect on Water Supply, E.P.A. Says While Noting Risks [405]." New York Times.
- (Optional) "Commentary: The environmental case for natural gas [406]. [404]" The International Energy Agency.
- (Optional) "A dirty little secret [407]." The Economist.
- (Optional) "Methane Leaks May Greatly Exceed Estimates, Report Says [408]." New York Times.
- (Optional) "A Tale of 3 Countries: Water Risks to Global Shale Development [409]." Andrew Maddocks, World Resources Institute.
Some key points from these articles include:
- One of the researchers interviewed in the New York Times article states that: "Absolutely the biggest trend is the decline in coal use...Coal use dropped a further 20 percent from 2014 to 2016, to be overtaken by natural gas in 2016. Natural gas is now the number one fuel for electricity generation in the U.S." So one undeniable impact of the fracking boom (as indicated above) is that natural gas has increasingly taken the place of coal in the energy landscape (systems thinking alert!).
- Regarding fracking and contamination of water: "The overall peer-reviewed, final verdict was: 'These activities can impact drinking water resources under some circumstances. Impacts can range in frequency and severity, depending on the combination of hydraulic fracturing water cycle activities and local- or regional-scale factors.'" Widespread water contamination was not found, but there are verified cases of water supplies being tainted. On the flip side, we may not know the full impacts of fracking on water supplies for years or decades due to complex geology, especially on the U.S. East Coast.
- Further: "In Pennsylvania, there continue to be complaints and documented small incidents, researchers say, but concerns over surface activities and well integrity remain more common than those involving deep fracking; problems arise, for example, when companies leave thousands of feet of uncemented wells. Adhering to industry best practices’ and guidelines appears to eliminate most issues with deep fracking itself." The article goes on to point out that shallow wells (within 2,000 feet or so of the surface is, believe it or not, considered shallow!) pose the greatest risk in general. However, any well that is not properly sealed and cemented poses risks.
- Regarding earthquakes: "There is no longer serious doubt that activities associated with energy extraction can trigger earthquakes. Leading researchers have stated in a 2015 policy article published in Science that, to a large extent, the increasing rate of earthquakes in the mid-continent is due to fluid-injection activities used in modern energy production. Evidence on that point involving the mechanics of these impacts has become clearer and more specific: Wastewater disposal, rather than the hydraulic fracturing itself per se, clearly causes most of the earthquakes." They go on to say that fracking itself may cause earthquakes, but that appears to very much be the exception. So to recap: the disposal of fracking wastewater by injecting into the underground formations, including oil wells, is causing earthquakes. Usually, this is not serious, but some fracking operations have been shut down due to earthquake risk.
- Regarding methane leaks: "Methane is a highly potent greenhouse gas that, if leaked in sufficient quantities, undermines at least some and potentially much of the purported emissions benefits of natural gas...Authors of another new study, published in the Proceedings of the National Academy of Sciences, PNAS, find that a 'small proportion of high-emitting wells, most of them no longer in active use, can account for most of the problem. Monitoring old wells, then, is a crucial aspect of the solution to stopping leaks, but it’s no easy task. As the PNAS study notes, the 'number of abandoned wells may be as high as 750,000 in Pennsylvania alone.'...authors of a 2017 study found that methane leaks were incredibly high across fracking operations in northwestern Canada." Overall, there is no clear verdict on this one. It is certain that there are fugitive emissions coming from oil and gas operations, but how much is up for debate. It does appear that most of the total leakage is from a few major emitters, but overall it can be difficult to monitor all leaks because of the huge number of wells in the U.S.
There are many other sustainability concerns regarding fracking, including:
- up to 5-7 million gallons of water are used per well, much of which is unrecoverable - this is a particular problem in dry areas of the world (e.g., Colorado) where water is scarce;
- the water that is recovered is often contaminated with hazardous chemicals and substances;
- heavy truck traffic and noise are often associated with fracking, which is particularly burdensome in rural areas of the country;
- nearby landowners who receive little of the economic benefit from fracking share burdens of those who receive royalties;
- and more.
All that said, the recent fracking boom has revived the U.S. oil and natural gas industry and created or supported millions of jobs. Also, natural gas-fired power plants can also be energy to supplement renewable energy like wind [410]. Natural gas-fired power plants can increase and decrease output quickly, much more so than coal or nuclear. So, if energy generation from solar or wind drops suddenly, natural gas can make up the difference through increased output. However, these "peaker" plants are very inefficient, and so are not good from an emissions perspective. Until widespread storage is available through batteries or other means, natural gas is under most circumstances the most reliable way to "balance the grid."
Summary
Natural gas is really a mixed bag of sustainability implications, especially with regards to hydraulic fracturing:
- The primary benefit from a sustainability perspective is that it has reduced CO2 emissions relative to using coal.
- However, to what extent natural gas leaks have counteracted that is in question. It is possible that natural gas leaks have completely erased all emissions benefits of replacing coal.
- Fracking has created an economic boom, at least in the short term. Again, the overall benefit of this boom is dependent upon whether or not externalities are considered.
- There are many downsides, particularly with regards to environmental damage (water, air, land), but also with regards to the quality of life for some people near wells.
- Please keep in mind that (as indicated on the first page of this lesson) any energy source that emits GHGs is not sustainable. Also, consider that natural gas is non-renewable.
There has been some recent movement toward more regulation of the fracking industry, but that has lessened under the Trump Administration. Regardless, natural gas use is only predicted to increase, so the more we know about all of its impacts - good and bad - the better off we will be. Stay tuned!
Check Your Understanding
Optional (But Strongly Suggested)
Now that you have completed the content, I suggest going through the Learning Objectives Self-Check list at the top of the page.
Oil
Learning Objectives Self-Check
Read through the following statements/questions. You should be able to answer all of these after reading through the content on this page. I suggest writing or typing out your answers, but if nothing else, say them out loud to yourself.
The oil business is not for the faint of heart - it has always been a boom-and-bust [411] industry since the first oil well was drilled in 1859 by Edwin Drake in Titusville, PA. Witness, for example, the changing price of oil since 1970 illustrated in the chart below, compared to the average price of electricity and natural gas in the U.S. over approximately the same period. A few things to note:
- The charts, from top to bottom, illustrate the price of electricity, natural gas, and oil, respectively.
- The oil price is its price on the international market, while the electricity and gas reflect the average cost for residential customers in the U.S.
- Also worth noting is that the nominal price (the bottom line on each chart) is how much it cost at the time, while the real price (the top line on each chart) is the price in inflation-adjusted dollars. The real price is a more accurate indication of how much it cost.
- It's very important to keep in mind that the scales of these charts are different, even though they each show the past 50 years of prices. The real price of electricity has ranged from about 25 cents to 15 cents per kWh a (40% swing) nd the real price of natural gas has varied from about $9 to about $20 per thousand cubic feet (a 120% change). However, the price of oil has swung wildly from 20 USD to over 100 USD per barrel (a 400% change).
(All of this information is publicly available from the EIA [412], and the charts are easy to create and interactive.) It may be a little difficult to see, but the key is to note the overall trends in real prices since 1970. (Remember - real prices are represented by the blue lines.)
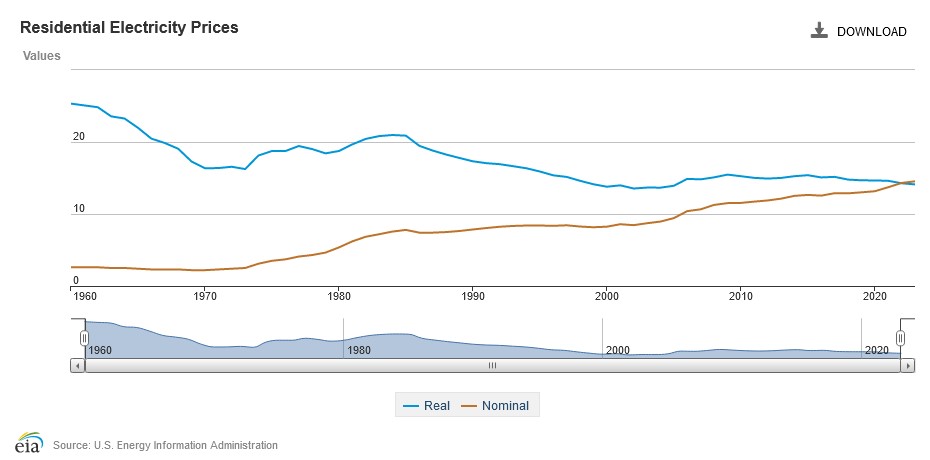
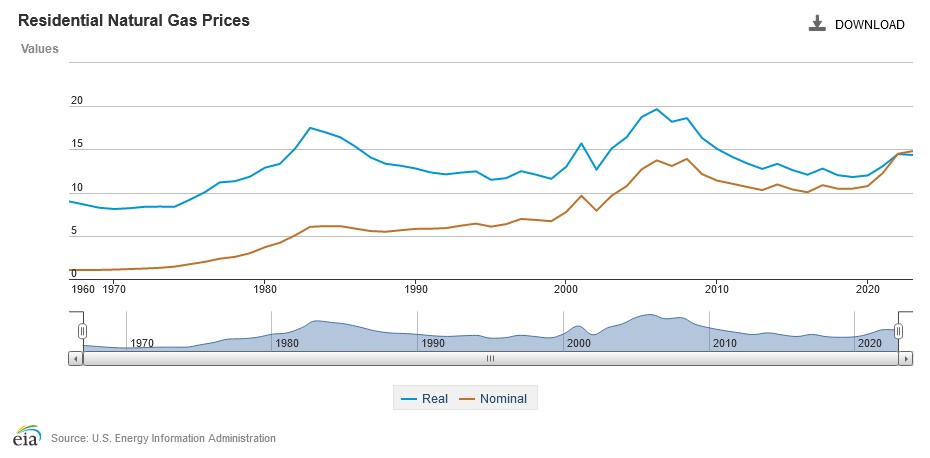
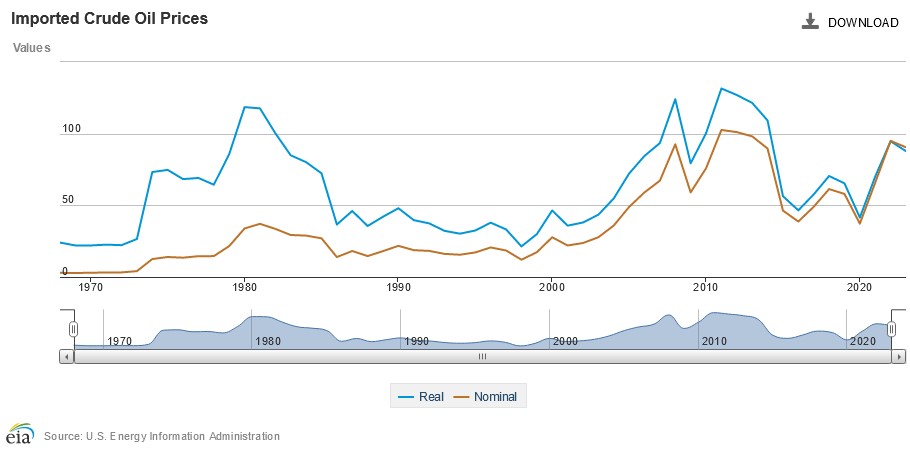
As you can see from the charts, the price of oil can be quite volatile, even on a year-to-year basis. The price reflects a complicated mixture of international supply and demand, and international events can (and do) severely impact the price. Note the following sudden changes in prices:
- spikes in 1973 and 1979, both of which were due to conflict in the Middle East (the so-called Oil Shocks),
- the rapid increase in prices starting around 2001 as demand outstripped supply,
- the downward spike during the Great Recession starting in 2008,
- the increase as the Recession faded, then
- the recent collapse of the oil market as supply outstripped demand due to a variety of factors, including fracking for oil
- the even more recent collapse of oil with the supply wars in Russia and Saudi Arabia, combined with collapsing demand due to Covid-19.
- the even more recent spike in price due both supply limitations (partial embargoes on Russian oil) and fear of energy market chaos to Russia's war in Ukraine
Only ~50 years of history is enough to make your head spin! Here's a good summary of these, and other oil trends in history [415]. But this is the nature of the beast that is the international oil market. Compare that to the retail price of electricity, which has had only minor fluctuations, and mostly been in decline in terms of real prices the whole time. Natural gas prices are smoother than oil but more volatile than electricity.
Supply and Feasibility
In terms of feasibility, oil is so ingrained in modern society and its infrastructure is so well-established that there is no risk of not being able to integrate oil supplies into the economy and society. However, oil supply projections have a very interesting history, and like the price, projections of supply have been volatile. First of all, like natural gas, the calculation of proved reserves is subject to limitations of using current technology, economics, and known reserves, each of which can change from year to year. Like natural gas, for oil, proved reserves refer to "those quantities of petroleum which, by analysis of geological and engineering data, can be estimated with a high degree of confidence to be commercially recoverable from a given date forward, from known reservoirs and under current economic conditions" (Source: CIA Factbook [416]). The result (again, like natural gas) is that even though oil use is increasing globally every year, there are paradoxically more proved reserves. Please note that the chart below represents global proved reserves.

How is it possible that we can continue to use more oil each year, yet the estimated remaining supplies keep increasing? The primary reason is improving technology. We have so far been able to exploit new resources as the market demands more oil. The most recent increase in proved reserves, especially in the U.S., is from shale oil that can be extracted through hydraulic fracturing (aka fracking). There has been an oil boom that has come in lock-step with the recent natural gas boom, all due to fracking. Access to additional "unconventional" reserves via tar sands in Canada has also contributed to the increase in proved reserves and supply.
To Read Now
Dr. James Conca provides a very good explanation of the somewhat complex workings of the global oil market in the article below. As you will see, the price of oil and the economic feasibility of technology is not as simple as supply and demand. He also throws in a nice lesson on how fossil fuels are formed for good measure. Also, if, like me, you have found yourself wondering whether oil deposits are more like a jelly donut or tiramisu, he'll help you out with that as well.
- "No Peak Oil For America Or The World [419]" James Conca, Forbes Magazine.
- (Optional) "Peak Oil: Myth or Reality? [420]" Guarav Agnihotri, oilprice.com.
Dr. Conca makes it clear that despite dire warnings of "peak oil" since the 1970s: "For every barrel of oil consumed over the past 35 years, two new barrels have been discovered." In other words, technology has increased the available oil despite the fact that humans have been using it at an increasing rate for over a century. For the past 15 or so years, fracking (and directional drilling) is the main reason that proved reserves have increased. He also provides some insight into the global nature of the oil industry when he notes that Saudi Arabia and other OPEC countries purposefully decreased the price of oil by refusing to cut the output of oil in an attempt to starve out American competition. In short, peak oil will not come any time soon, but Dr. Conca notes that: "Unfortunately, the environmental cost of unconventionals is even greater than for conventional sources." This is important to keep in mind, as fracked oil has the same negative impacts as fracked natural gas.
So, how much oil is left, and how long will it last? Unfortunately, that is an impossible question to answer with certainty. In 2022 BP released its well-regarded annual Statistical Review of World Energy [421] and determined that there is enough oil to satisfy global needs for 53.5 years, but only if we continue on our current trajectory. (This includes the recent boom in proved reserves.) This is not a very long time if you think about how important oil is to society.
Also, keep in mind that as we approach this point of exhaustion, the price of oil - and all of the goods that depend on it, which is basically, you know, everything - will increase. Yet, there are people like energy reporter Jude Clemente of Forbes magazine stating that oil will basically never be economically unavailable [422]. In 2016, McKinsey and Company [423], a highly respected global research firm, reported that the world may actually reach peak demand (not peak supply, as is usually referred to) for oil by around 2025. This was unheard of only a few years ago, but the combination of oil extraction technology, energy efficiency, renewable energy, and energy policy may make the era of oil over before oil becomes scarce. (Note that I wrote MAY, not WILL!) The video below from Bloomberg illustrates how this might occur (3:40 minutes).
In the same 2020 BP Annual Energy Outlook noted above, they indicate that oil demand likely did peak in 2019 and that it will most likely continue to decline due to climate policy and market activity. Carbon Brief provides a great summary here [424].
The world is running out of oil, at least that was the idea behind the peak oil hypothesis that dominated economic thinking for decades, but it turns out that with fracking, deep water drilling, and oil sands there's a lot more oil in the world than we once thought. The old Peak Oil Theory ain't happening, but what if instead of running out of oil, we just stopped buying this stuff? Most scoff at that idea. There are 1 billion gas-guzzling cars on the road worldwide today, and only 1/10 of 1% of them have a plug.
OPEC contends that even in the year 2040, EVs will make up just 1%, but don't be so sure. Consider the S curve. S curves are used to describe the spread of new technologies over time like early refrigerators and color TVs. Growth starts off slowly at first, and then, when the product really starts to connect with everyday people, we have liftoff. Eventually, the market gets saturated and growth tapers off forming the top of the S. Predicting s curves for electric cars is extremely difficult because we're making assumptions about demand for a type of vehicle that doesn't even exist yet. Fast, affordable, and spacious cars that have an electric range of at least 200 - 300 miles, but here's what we know in the next few years: Tesla, Nissan, and Chevy plan to start selling long range electric cars in the $30,000 range and other carmakers and tech companies are investing billions on dozens of new models due out in the next four years. By 2020, some of these will be faster, safer, cheaper, and more convenient than their gasoline counterparts. That sure seems like the point when the S curve goes vertical.
To start an oil crash, you don't need to replace all the cars on the road today you just need to reduce demand enough to cause a glut of unwanted oil. Consider the oil crash that started in 2014 that was caused by too much supply when producers started pumping out an extra two million barrels a day. So when electric vehicles are able to displace that much on the demand side it should also cause a crash. When might that happen? Tesla is building factories to go from about 50,000 sales last year to 500,000 in 2020, so let's assume for a minute that Tesla can meet its own forecasts, and let's assume that other carmakers maintain their current combined market share for plugins.
If each electric vehicle displaces roughly 15 barrels a year, here's the impact on oil from all the EVs worldwide at this rate: we hit our benchmark of 2 million barrels of oil a day displaced as early as 2023. That's an oil crisis, and the thing is, it's just the beginning. It's not at all unreasonable to assume that by 2040, nearly half the world's new cars will have a plug. Sure, you're skeptical the price of electric cars still needs to come down, and there aren't yet enough fast charging stations for convenient long distance road trips. Many new drivers in developing countries like China and India, they're still going to choose gasoline, diesel, but imagine a future where the rumbling streets of New York and New Delhi suddenly fall silent with electric engines. What if global demand for oil starts to fall at first by trickle, but then in a rush? Trillions invested in oil will be lost while trillions in new energy will be won. The power of nations will be shuffled. That's the promise of the new peak oil, and it may be coming sooner than you think.
It is impossible to know who is right, that is until the future happens. There is a risk associated with this, as you will see below (especially if we keep getting oil through particularly damaging methods such as oil sands). But in terms of raw physical resources, the future is difficult to predict. We may run out of oil at some point, given that it is a finite resource. It is almost certain that before we reach the physical end we will reach a point where other issues (e.g., sustainability impacts, economics, or even reduced demand) cause the collapse of the oil industry. You've heard it before, so this should be no surprise: when it comes to predicting the future of oil, folks, it's complicated.
Sustainability Issues
Oil is extremely important to the functioning of modern society, as noted in a previous lesson. A little under 40% of all of the energy used in the U.S. is from oil (the biggest primary energy source in the U.S., you may recall from a previous lesson), and in addition to that, oil is used in the manufacture of common things like plastic, car tires, and asphalt. It is energy-dense, and relatively easy to transport. Around 150,000 people in the U.S. work in the oil and gas extraction industry [427], and possibly millions more are "supported" by oil and gas [428]. Oil is intertwined with every industry in the U.S. It has allowed food to become cheaper and made international and other long-distance travel more accessible. Do you think you could get two-day shipping from Amazon without readily available oil? Electricity and other alternatives can be used to substitute for many of these functions, but for now, it is oil that is the dominant force. A lot of this helps provide some quality of life improvements, and even some equity advantages (e.g. cheaper food). But it does come at the expense of other sustainability aspects, particularly the environment.
One of the problems with not knowing how much oil is left is that it makes it easier to justify not planning for its eventual unavailability. As discussed above, energy (and oil) is deeply ingrained in modern society. When oil shocks happen, they have a severe negative impact on the economy. If we knew exactly how much oil we had left, and how much we were using, society would be able to prepare for its demise. But because we do not know this with certainty, very little has been done to prepare for it. This is a sustainability issue for many reasons. Primary among them is that if we do not reduce our dependence on oil, there will be a lot of suffering when the next oil shock happens. This is an economic and equity issue primarily, as oil scarcity will hit us economically, and the poor will be most affected, especially at the beginning. I'll leave it to you to think about what those that practice the precautionary principle would advise!
But there are a lot of reasons to be concerned about the current use of oil. First of all, recall from the chart on the Sustainability of Coal page from this lesson that oil is second only to coal in global carbon emissions. There is no practical way to prevent the emission of carbon dioxide when an oil product like gas is burned. Given the gravity of the issue of climate change, this is an essential consideration.
Yet another climate change implication is the use of gas flaring. Frequently, natural gas is found (and hence extracted) along with oil because they often form together underground. When a facility is designed to handle oil and not natural gas, the gas is "flared." Flaring entails separating the gas from the oil, then burning it off and not using any of it. This seems wasteful, right? So how much gas is flared each year? According to the World Bank [429] 141 billion cubic meters of natural gas was flared around the world in 2017, which was actually down a bit from 2016. This is about twice the annual total usage [430] of natural gas in the U.S. each year! In terms of emissions, it results in about 350 million tons of carbon dioxide, which according to the World Bank is equivalent to the emissions from about 77 million cars. That is about 1% of total annual emissions worldwide, or about 7% of U.S. energy-related emissions [431]. (Translation: That's a lot of CO2!) This is being addressed but is still a major problem.
There are a number of other emissions [433] associated with the burning of oil products like diesel and gasoline, including nitrogen oxides and volatile organic compounds (which cause lung damage), sulfur dioxide (acid rain and some health impacts), particulate matter (asthma, bronchitis, visual pollution, possibly lung cancer), and others (source: U.S. EIA [433]). Exposure to automobile exhaust has been found to increase hospital admissions [434] for people with lung disorders (asthma, bronchitis, pneumonia, etc.). Nearly all of these impacts are externalities because they are not included in the price of oil, it should be noted.
Also, all of the issues associated with fracking, in particular, the heavy use of water (see the Natural Gas Sustainability page) are the same for shale oil. Another unconventional source of oil is Canada's oil sands (sometimes referred to as tar sands). 97% of Canada's known reserves [435] come from oil sands, and they have such a large reserve that they are second only to Saudi Arabia and Venezuela [435] in terms of proved reserves. Oil sand extraction is particularly damaging to the natural environment and has a very low EROI (see Lesson 2). Canada is the U.S.'s largest supplier of foreign oil (over 4 million barrels per day [436] in 2021), almost all of which is from oil sands.
Strongly Suggested: Canadian Tar Sands
Encyclopedia Britannica provides a short explanation of the environmental impacts of Canadian tar sands, also know as oil sands.
- Explore the booming oil sands industry and its impact on the environment [437], Encyclopedia Britannica
As you will see in the article below, oil is often associated with the so-called "resource curse [438]" when it is controlled by corrupt governments. This problem has historically been especially acute in African countries like Nigeria [439], but oil revenues have propped up many undemocratic regimes elsewhere, e.g. Middle Eastern Countries (Iran, Iraq) and South American Countries (like Venezuela). Finally, oil spills are a common occurrence, some larger than others. Since 2000, hundreds of thousands of metric tons of oil have been spilled worldwide [440]. Some of these spills are more damaging than others.
To Read Now
- "Equatorial Guinea Country Profile - Overview [441]." BBC News. When reading this, please keep in mind that Equatorial Guinea was a Portuguese, then Spanish colony for over 500 years prior to independence in 1968. It was used as a source of slaves by the Spanish for the last 200 years or so of that time. This level of exploitation is probably the most important factor in why countries like Equatorial Guinea are subjected to the "resource curse." The exploitation prevented them from developing the necessary political and economic infrastructure and personal freedom that would provide a buffer against exploitation by dictators. Imagine, if you will, if the U.S. had just won independence in 1968 (!) after being exploited for hundreds of years. Hard to argue that things would not be very different right now.
- (Optional) "The Dark Side of the Shale Bust [442]." Nick Cunningham, oilprice.com.
- (Optional) "5 years After BP Oil Spill, Effects Linger And Recovery Is Slow [443]." Debbie Elliott, NPR.
Oil is an extremely useful resource, and it is a very important aspect of the modern economy, and by extension, society. Considering that current projections assert that we only have about 50 years of supplies left, we should probably try to maintain our resources for as long as possible, and avoid an abrupt collapse. But we also should be conscious of the sustainability impacts of its extraction and use. Climate emissions are all but unavoidable when it comes to oil use, and there are many other sustainability impacts to consider as well. It is becoming increasingly likely that much of our automobile-based demand for oil will diminish, but recall that we only have about 10 - 15 years to significantly reduce our global carbon dioxide emissions. If we do not significantly reduce oil use soon we are unlikely to hit that target.
Check Your Understanding
Optional (But Strongly Suggested)
Now that you have completed the content, I suggest going through the Learning Objectives Self-Check list at the top of the page.
Nuclear
Learning Objectives Self-Check
Read through the following statements/questions. You should be able to answer all of these after reading through the content on this page. I suggest writing or typing out your answers, but if nothing else, say them out loud to yourself.
Nuclear energy has been a hot-button issue for a very long time, both domestically and internationally. It provides about 10% of the global electricity supply, as you can see in the image below.
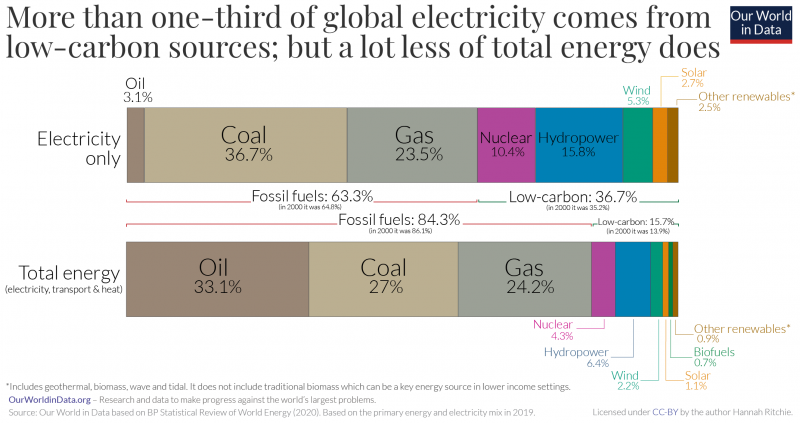 [397]
[397]
Supply
As you (hopefully) recall from Lesson 1, nuclear energy is non-renewable. Uranium is by far the most-used nuclear fuel, though there are possible alternatives (such as thorium [445]). As with other non-renewable fuels, all of the uranium that is on earth now is all that we will ever have, and estimates can be made of the remaining recoverable resources. As you will see in the article below, at current rates of consumption, we will not run out of uranium any time soon. But - at risk of sounding like a broken record - this highly depends on a number of variables, including keeping consumption at current levels, technology not advancing, estimates of reserves changing, and so forth. If, for example, we waved a magic wand and doubled the output of nuclear power tomorrow, the estimated reserves would last half as long.
The World Nuclear Association (WNA), an industry association, provides a very thorough explanation of possible complicating factors [446], but they state that at current rates of consumption, as of the fall of 2021 [447] the world has enough reserves to last about 90 years. The Nuclear Energy Agency [448] (NEA), like the WNA, [448]is effectively an industry group and has a wealth of expertise at its disposal. It operates out of the OECD (remember them from Lesson 1?) in Paris. They are a pro-nuclear group but are very good at providing technical data, as well as statistics. They indicate [449] that as of 2018, the world had about a 130 year supply of uranium.
Optional Reading
The author of the article below provides a number of reasons why nuclear energy will not play a large role in the global energy future.
- "Why nuclear power will never supply the world's energy needs [450]." Lisa Zyga, phys.org.
Feasibility
The first nuclear power plant came online in 1954 in Russia [451] (then the Soviet Union), and according to the World Nuclear Association, there are 436 reactors worldwide and another 59 [452] under construction. The technology is well-known by now, and despite the extreme danger posed by nuclear meltdowns, there have been very few major incidents. You are probably familiar with the Fukushima Daichi meltdown that happened in 2011, and perhaps heard of Chernobyl in the Ukraine in 1986 (still the worst nuclear disaster to date), and maybe even Three Mile Island in the U.S. in 1978. Here is a partial list of nuclear accidents [453]in history from the Union of Concerned Scientists (UCS).
But putting aside this risk at the moment, nuclear energy has shown itself to be a viable source of electricity, and likely will continue to be used for the foreseeable future. Among other things, nuclear power plants generally have a useful lifetime of around 40-60 years, so we are "locked in" until mid-century at least. That said, increasing the use of today's nuclear technology would likely pose some problems, for a variety of reasons. The article below sums up these and a few others reasons for and against nuclear energy.
Sustainability Issues
Okay, now for the fun part. Nuclear energy is a mixed bag in terms of the question of sustainability. The biggest dilemma for those concerned about anthropogenic climate change but skeptical of nuclear is that nuclear energy is considered a carbon-free source, and since it is responsible for a significant portion of non-fossil fuel based electricity production worldwide and is a proven and reliable source, it is seen by many as a good option. Note that despite being considered "carbon free," nuclear energy results in some lifecycle emissions because of the materials used in mining, building the power plant, and so forth. (Lifecycle emissions are all the emissions generated by all processes required to make an energy source, including things like mining of materials, manufacturing of equipment, and operating equipment.) But according to the National Renewable Energy Laboratory (NREL) [454], a U.S. National Lab, it has approximately the same lifecycle emissions as renewable energy sources.
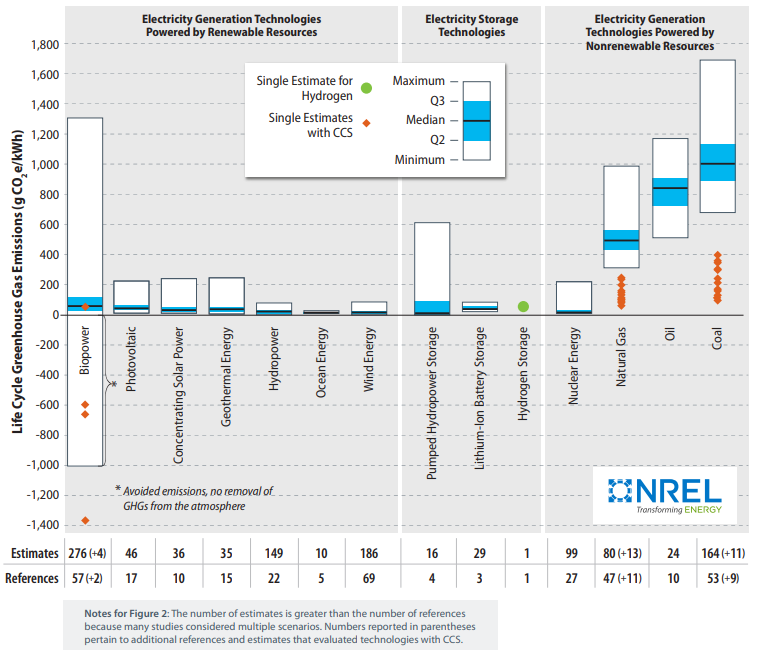
Nuclear energy is a very reliable source of electricity, and power plants can operate at near full capacity consistently. Once a plant is built, electricity is relatively inexpensive to generate. But nuclear energy is very expensive in terms of lifetime costs (as you'll see in the article below), and the waste from nuclear reactors can remain dangerous [456] for thousands of years, which can result in large externalities. Since they are so expensive, there is an incentive to keep a plant online for as long as possible to recoup costs, thus people are effectively "locked in" once a plant is built. There is, of course, the risk of another disaster, which however rare the possibility, could be catastrophic. There are also some issues with the equity impacts of uranium, particularly in terms of mining [457]. There is not an easy answer here, as there are reasonable and strong pros and cons.
To Read Now
The first article below is a good example of why it pays to pay attention to citations and be well-informed on a topic, in regards to finding good information sources. The article is on a website that I've never heard of before, so at first, I was suspicious of the content. However, they provide legitimate sources for the information presented, and I have enough prior knowledge to know that the arguments they put forth are legitimate. Overall, it's a good summary of some of the pros and cons of nuclear energy, though I have a few minor issues with the content, as I'll describe below. (See if you can figure out what I take issue with.)
- "Pros and Cons of Nuclear Energy [458]." UnderstandSolar.com
- (Optional) "Unable to Compete on Price, Nuclear Power on the Decline in the U.S. [459]" Brian Mann, PRI.
- (Optional) "Nuclear, Carbon Free but Not of Unease [460]." Henry Fountain, New York Times.
- (Optional) "Nuclear Power Prevents More Deaths Than It Causes [461]." Mark Schrope, Chemical, and Engineering News.
Did you guess the issues I have with the first article? First, the author calls nuclear a very "efficient" energy source. If you recall from previous lessons, the efficiency of a nuclear power plant hovers around 35%. It is, however, energy dense (a lot of energy by volume), which is what he describes as "efficient." (Though he also mentions energy density as well, confusingly.) The second - and more subtle - problem I have is with the assertion that nuclear is an "inexpensive" energy source. This was clearly indicated in the second article (if you read it) but is also asserted by the EIA. Nuclear plants are inexpensive to run once they are built, but they are extremely expensive to build. The author glosses over that part, but it is a really important consideration. Finally, he says that nuclear is "sustainable" but as you know by now, any energy source that is non-renewable is not sustainable.
Regarding the cost of nuclear: The high up-front cost makes nuclear power one of the most expensive types of electricity available. For a technical discussion of this, feel free to read through this description of levelized cost of electricity [462] from the EIA, which indicates that over the lifetime of the energy source, nuclear is more expensive than geothermal, onshore wind, solar, hydroelectric, and most types of natural gas plants.
Summary
Nuclear is a mixed bag. To summarize:
- Nuclear is reliable and almost carbon-free, but is non-renewable.
- Nuclear is relatively inexpensive to operate after established, but the high up-front cost makes it one of the most expensive electicity sources.
- Because power plants are so expensive to build, once they are built they are generally used for as long as possible, as long as they can be operated profitably. (Gotta get that investment back!) We are effectively "locked in" once they are built.
- When accidents happen, they can be catastrophic, but they are extremely rare.
- The waste product from nuclear power plants is dangerous for thousands of years, and right now we have no way of safely disposing of it - it is kept in storage, usually at the power plants themselves. This has not shown to be a major problem yet, but society will be dealing with the wastes for thousands of years.
Nuclear is a very controversial source of energy. It is embraced by many as a key to the a carbon-free future, while many think we should move away from it because of its inherent danger and/or expense and/or general sustainability problems. There are arguments to be made on each side. Hopefully, you have a better handle on some of them after reading through this.
Check Your Understanding
Why are we "locked in" to the use of nuclear energy once a plant is built?
Optional (But Strongly Suggested)
Now that you have completed the content, I suggest going through the Learning Objectives Self-Check list at the top of the page.
Renewable Energy
Learning Objectives Self-Check
Read through the following statements/questions. You should be able to answer all of these after reading through the content on this page. I suggest writing or typing out your answers, but if nothing else, say them out loud to yourself.
Given the scope of this lesson and course, I will limit the focus of this page to the three most prominent renewable electricity technologies: solar photovoltaic, wind, and hydroelectricity.
Supply and Feasibility
I've combined these two sections into one because the supply aspect is very straightforward for wind and solar: they are inexhaustible! As stated in Lesson 1, both of them get their energy from the sun, and if the sun stops shining we have more important issues to deal with than not having a source of renewable electricity. The amount of solar energy that hits the earth in about one hour is enough to power the world for an entire year (this is a commonly held fact, but here is one source from Sandia National Laboratories [463]). There is no shortage of solar energy!
As for hydroelectric, though it also gets its energy from the sun, it is limited due to its dependence on the availability of flowing water. As of 2021, about 15% of the world's electricity came from hydroelectricity. According to the International Energy Agency [404], there is about 5 times as much technical potential for hydroelectric worldwide as is currently generated today. We certainly would not want to exploit all of it, given some of the environmental impacts of large hydroelectric facilities (see below), but this number does provide a frame of reference.
[397]
The feasibility is a mixed bag. An oft-cited paper by Mark Jacobsen and Mark Delucchi of Stanford University [464]showed that through wind, water (hydroelectricity), and solar, all of the world's energy needs could be met by 2030, or in a less aggressive scenario, 2050 (note that this is all energy, not just electricity). This assumes that energy efficiency would increase worldwide by 5% - 15%. According to their research, this could be done using existing technologies and would require the use of about 1% of all dry land on earth. They assert that the barriers to accomplish this are "social and political, not technological and economic." They calculate that it would cost $100 trillion over a 20 year period. There are a lot of other details to this study - way too many to get into here.
There are no shortage of critiques to this study, including this critique from Ted Trainer [465] of the University of New South Wales, who is an advocate of renewable energy. He cites possible underestimates in their cost calculation, underestimates of the amount of energy required to provide a high quality of life (the authors assume that the per person energy use in 2050 would be about 1/6th of the current per person energy use in Australia, for example), and probably overestimate the reasonableness of electric storage capacity, among other things. If nothing else, this plan would require an alteration to the global energy infrastructure at a pace and scale that has never been seen before. It is almost certainly possible with enough political and social will, but it would take a lot of both.
One sign that bodes well for renewables is that the cost has come down significantly in recent years. In the U.S. the cost of generating electricity from wind and hydroelectric - assuming they are sited and installed properly - is cost-competitive with fossil fuels, even without incentives. Residential-scale solar is still relatively expensive, but utility-scale (large arrays) are cost competitive today. This is all based (as you will see below) on the levelized cost of electricity (LCOE), which was noted in the nuclear lesson. The LCOE is the amount it costs to generate each unit of energy (usually measured in $/megawatt-hour) on average over the lifetime of an electricity source.
Levelized Cost of Energy (LCOE): the amount it costs to generate each unit of energy (usually measured in $/megawatt-hour) on average over the lifetime of an electricity source.
This includes everything from building the power plant (e.g. nuclear plant, solar array, wind turbine), to purchasing the energy source (e.g. coal, natural gas), to operating the plant, to decommissioning the plant at the end of its life. To calculate the LCOE, you take the total lifecycle costs and divide it by the total electricity output over the lifetime of the source. This is of course not including externalities, which would likely make renewable energy cheaper right now, especially if the social cost of carbon were to be considered.
| electricity source | low | high |
|---|---|---|
| rooftop solar PV | $117 | $282 |
| community and commercial/industrial PV | $49 | $185 |
| utility-scale PV | $24 | $96 |
| utility-scale PV + storage | $46 | $102 |
| geothermal | $61 | $102 |
| onshore wind | $24 | $75 |
| onshore wind + storage | $42 | $114 |
| offshore wind | $72 | $140 |
| peaking gas | $115 | $221 |
| nuclear | $141 | $221 |
| coal | $68 | $166 |
| gas combined cycle | $39 | $101 |
To Read Now
- Browse through "Wind and Solar Are Our Cheapest Electricity Generation Sources. Now What Do We Do? [467]" Michael O'Boyle, Greentech Media. You only need to read until you hit the "How can this impact overall system costs?" subheading. This article is from 2017, but the cost of most renewables has only gotten cheaper since then, as you'll see if you read the optional article below.
- (Optional) "Renewables were the world’s cheapest source of energy in 2020, new report shows [468]" World Economic Forum, July 2021.
- (Optional) "Plunging Renewable Energy Prices Mean U.S. Can Hit 90% Clean Electricity By 2035 - At No Extra Cost [469]." Forbes.
- (Optional) "Renewable Electricity Levelized Cost Of Energy Already Cheaper Than Fossil Fuels, And Prices Keep Plunging [470]." Energy Innovation.
- (Optional) "Wind and Solar Energy Technologies Eat Into Fossil Fuel Power's Business Plan [471]." Mike Stott, Forbes.
The bottom line in terms of cost is that right now, well-sited wind and utility scale solar ("utility scale" refers to large arrays, usually hundreds or thousands of panels in size) are the cheapest form of electricity available, other than only the least expensive natural gas power plants. (Please note that, as stated in a previous lesson and the Greentech Media article above, energy efficiency is cheaper than all energy sources!) Other renewable sources such as small hydroelectric, biomass, geothermal, solar thermal, and commercial-scale solar are very cost-competitive with coal and natural gas, and generally less expensive than nuclear. All of this does NOT include subsidies, by the way!
Sustainability Issues
All three of these sources are considered carbon-free, so they are ideal with regards to anthropogenic climate change. Even after consideration of the embodied energy of these sources - hydroelectric dams require a LOT of concrete; solar panels are manufactured in an energy-intensive process, as are wind turbines; and all of them require mining - the lifecycle carbon footprint is minimal for renewables, as you can see in the chart below. In terms of climate change concern, there is really no debate: these renewables are great choices.
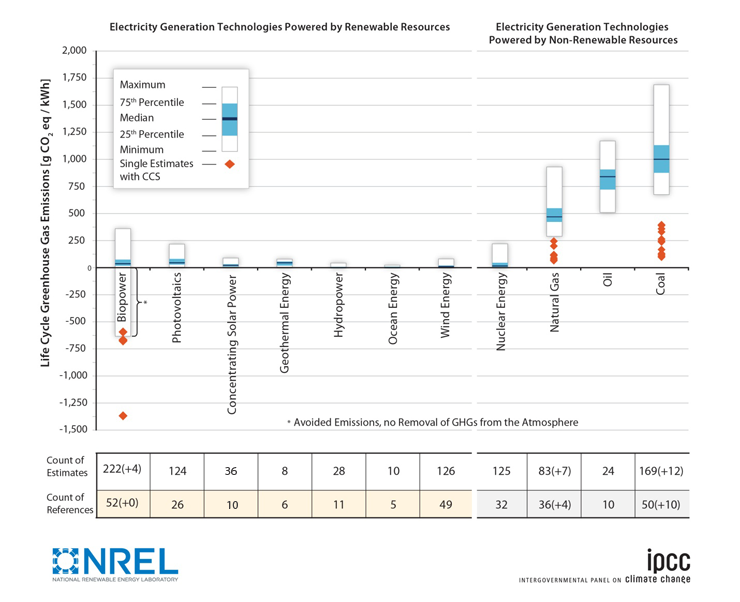
However, there are some other considerations to make in terms of sustainability. First, large hydroelectric facilities are not very environmentally friendly. Depending on the location, there can be problems with flooding of habitats and even towns, compromising fish migration, altering stream content and temperature, impacting scenic areas, and other considerations. The articles below provide some insight into some of these potential problems. Note also that not all hydro has the same problems - by using different types of hydroelectric facilities such as run-of-the-river and microhydro [473], environmental and social impacts can be minimized.
To Read Now
- "Hydropower Explained: Hydropower and the Environment [474]." U.S. EIA.
- "China Admits Problems with Three Gorges Dam [475]." Michael Wines, New York Times (link to PDF [476]).
- "Run-of-river hydro, Indonesia [477]." (Video)
- "Solar Power Explained: Solar Energy and the Environment [478]." U.S. EIA
- "Environmental Impacts of Wind Power [479]." Union of Concerned Scientists.
In terms of social equity, there are a few important considerations to make. First of all, do people have access to energy, and can they afford it? This is a tricky question to answer, as it depends on a lot of factors, many of which were indicated above. Some equity and other considerations include:
- Solar panels used to be prohibitively expensive, but new business models are making them much more affordable, even effectively free to the customer. See for example community solar and power purchase agreements.
- Wind and hydro can usually be purchased through utilities at the same or lower rates than fossil fuels.
- One very important equity consideration is that fossil fuel power plants are often sited near low-income areas of the country and world, and thus the negative health impacts are unevenly distributed, with the least powerful bearing the brunt. (The term "environmental justice" hopefully comes to mind for you right about now!) Add to the previous point that the environmental destruction from coal mining is especially unevenly distributed.
- Wind turbines can be a nuisance, as indicated in the article above, but is relatively minor compared to power plants.
- Solar is usually unobtrusive, though some people do not like "the look" of the panels.
- Large hydro can have a major social cost, as you saw in the article above. Flooding of houses and even whole towns can result from dams being built, though this is more the exception than the rule in industrialized countries. As always, these impacts are disproportionately felt by low income and marginalized people.
One of the benefits of conventional energy generation is that the infrastructure is largely set up, at least in industrialized countries. In the U.S., for over 100 years, we have built an energy infrastructure based on large power plants and fossil-fuel based vehicles. This gives conventional energy sources an advantage in terms of providing access. That said, wind, hydro, and solar can all utilize the existing infrastructure. Hydroelectric dams provide the same service as fossil-fuel power plants, but usually on a slightly smaller scale, so they are a good fit. They also provide a very consistent stream of electricity as long as no droughts are occurring, and they can increase and decrease production pretty rapidly, unlike solar and wind.
Probably the biggest current problem with solar and wind is that they are intermittent - the sun does not always shine and the wind does not always blow. This is a major issue because we currently do not yet have widespread storage capabilities to provide the energy on demand, though improving battery technology and policy are rapidly changing that. As you can see in figre 4.21, solar and wind plus storage are now cost-competitive with fossil fuels, and costs continue to drop. This has resulted in some utilities [480] agreeing to purchase or build "solar + storage" facilities because it makes economic sense. For the sam reasons, multiple "wind + storage" facilities were online as of 2020 [481]. The future of renewables is in storage! (Side note: If any of you discover an energy dense, cheap storage medium that is abundant and safe, feel free to give me a cut of your billions of dollars in wealth!)
One common problem with wind and solar are that they are often highest in areas with low population densities. In the U.S., for example, the greatest onshore wind resources are in the Great Plains in the Midwest, where the population density is very low. Because of this, a lot of infrastructure (high voltage power lines for example) will need to be added to fully tap into these resources. That said, as you can see in the map below, offhore wind resources match up pretty well with heavily populated areas. However, offshore wind is currently expensive.
 [482]
[482]
One of the benefits of solar is that as long as there is not too much shading, many households can satisfy their energy needs using existing rooftop spaces. However, not every location is ideal for solar.
Summary
Overall, the biggest advantages of renewable energy are:
- they are inexhaustible (hydro has limits);
- they are effectively carbon free;
- they have very minimal environmental impacts (notwithstanding large hydro);
- they also tend to be more democratic, in that many of them are suitable for scaling down to a personal level. This is not possible with current technology for fossil fuel-based electricity generation;
- most of them are also cheaper than almost all forms of non-renewable energy.
The main disadvantages of solar, wind, and hydro are:
- solar and wind are intermittent, and so without storage cannot be relied upon to deliver energy when needed;
- they are not able to be deployed in every location, e.g., shaded areas for solar, calm areas for wind, and dry areas for hydro;
- large-scale hydro has a lot of negative environmental impacts, and there are some environmental and social problems with wind.
The last things I'd like to note are the following:
- Regardless of any other sustainability considerations, as noted in the beginning of this lesson, the world's energy (not just electricity!) must come from carbon free sources relatively soon if we are to avoid climate catastrophe. Remember - we must be carbon neutral by around 2050 is the goal to limit warming to 1.5 C!
- The most sustainable energy is the energy that you don't use. Remember that energy efficiency is sometimes called the "fifth fuel?" That is very much applicable to these considerations. Also, as noted above, energy efficiency has been found to have a lower LCOE than any other energy source [484]! The more we can reduce our energy use while getting the same benefits from the energy service, the better off we will be.
Check Your Understanding
Optional (But Strongly Suggested)
Now that you have completed the content, I suggest going through the Learning Objectives Self-Check list at the top of the page.
Summary and Final Tasks
Summary
That's it for this week! Please make sure you complete the two required assignments listed at the beginning of this lesson. This week, we went over a lot of the supply and sustainability implications of a variety of modern energy sources. You should be able to do the following after completing the Lesson 4 activities:
- analyze current supply and feasibility of a variety of energy sources;
- differentiate between various projections of remaining energy supply and the impacts of technology and price considerations on them;
- describe the trends in U.S. electric power production with regards to fuel use and carbon dioxide emissions;
- describe the complexity of predicting oil supply and prices; and
- describe and analyze sustainability implications of contemporary energy use.
The Language of Sustainability
We went over a lot of fairly heavy concepts this week. Hopefully, this list will help spark some memories of the content, both now and as we move forward:
- demonstrated reserve base, estimated recoverable reserves, carbon capture and sequestration;
- hydraulic fracturing (fracking), directional drilling, proved natural gas reserves, shale gas;
- real price, nominal price, proved oil reserves, peak oil, peak demand, gas flaring, unconventional oil sources;
- lifecycle emissions;
- solar energy, wind energy, hydroelectric energy.
Reminder - Complete all of the lesson tasks!
You have finished Lesson 4. Check the list of requirements on the first page of this lesson and the syllabus to make sure you have completed all of the activities listed before the due date. Once you've ensured that you've completed everything, you can begin reviewing Lesson 5 (or take a break!).
Complete all activities in Lesson 4. The quiz may include a variety of question types, such as multiple-choice, multiple select, ordering, matching, true/false and "essay" (in some cases these require independent research and may be quantitative). Be sure to read each question carefully.
Unless specifically instructed otherwise, the answers to all questions come from the material presented in the course lesson. Do NOT go "Googling around" to find an answer. To complete the Activity successfully, you will need to read the lesson, and all required readings, fully and carefully.
Each week, a few questions may involve research beyond the material presented in the course lesson. This "research" requirement will be made clear in the question instructions. Be sure to allow yourself time for this! You will be graded on the correctness and quality of your answers. Make your answers as orderly and clear as possible. Help me understand what you are thinking and include data where relevant.
For any other assignments (e.g., journal or discussion board), it will be helpful to look at the rubric before answering. You will see a button that allows you to view it below the assignment.
These activities are to be done individually and are to represent YOUR OWN WORK. (See Academic Integrity and Research Ethics [221] for a full description of the College's policy related to Academic Integrity and penalties for violation.)
The activities are not timed, but do close at 11:59 pm EST on the due date as shown on the Course Calendar.
If you have questions about the assignment, please post them to the "HAVE A QUESTION?" Discussion Forum. I am happy to provide clarification and guidance to help you understand the material and questions. Of course, it is best to ask early.
Lesson 5: Rhetorical Analysis
Overview
We are now going to switch gears a little bit and investigate rhetorical strategies in the so-called rhetorical triangle - ethos, pathos, and logos. Rhetorical strategies are methods used to persuade an audience. They were outlined over 2,000 years ago in ancient Greece, but they remain valid and powerful today. They can be used in all forms of communication, including speech, writing, video, and imagery. They are used in every field of inquiry and study, including energy and sustainability. Understanding these strategies can be an important aspect of critical analysis because skilled communicators are very good at using them to persuade an audience that their assertions are valid. Rhetorical strategies are also important to understand if you are to be an effective communicator.
We then investigate greenwashing, which is an attempt by companies to convince audiences that the company acts more sustainably than it actually does.
Finally, you will be introduced to the three types of lies, and an emerging field of study and application called "Behavioral Economics." Behavioral Economics is a branch of economics that seeks to understand why people act in ways that don't fit into the standard, neoclassical model of economics. Neoclassical Economics is the type of economics that most economists, policy-makers, and academics use, and is almost certainly the one that you learned in Economics class. Buckle up - this should be interesting!
Lesson Objectives
By the end of this lesson, you should be able to:
- define rhetoric, ethos, pathos, and logos;
- analyze claims made in speech, writing, and imagery through the lens of the rhetorical triangle;
- create rhetorical statements to enhance the persuasiveness of claims made in writing;
- define greenwashing;
- list ways that consumers can overcome greenwashing;
- identify the greenwashing content of advertising claims;
- define lies of commission, lies of omission, and character lies;
- define the term homo economicus; and
- analyze principles of Behavioral Economics.
What is due this week?
Please note that the quiz can only be taken once. You have unlimited time to complete it prior to the deadline, and can save your progress and pick up where you left off at a later time. See the Assignments and Grading section of the syllabus [1] for tips on how to do this. Once you submit the quiz, you cannot change answers. All saved answers will automatically be submitted at the deadline if you have not submitted them.
| Requirement | Submission Location |
|---|---|
| Lesson 5 Quiz | Canvas - Modules tab > Lesson 5 |
| Continue posting to the Yellowdig discussion board. | Canvas - Modules tab > Lesson 5 |
| (Optional) Lesson 5 Extra credit quiz | Canvas - Modules tab > Lesson 5 |
Questions?
If you have any general course questions, please post them to our HAVE A QUESTION? discussion forum located under the Discussions tab. I will check that discussion forum regularly to respond as appropriate. While you are there, feel free to post your own responses and comments if you are able to help out a classmate. If you have a question but would like to remain anonymous to the other students, e-mail me.
If you have something related to the material that you'd like to share, feel free to post to the Coffee Shop forum, also under the Discussions tab.
Rhetorical Strategies
Learning Objectives Self-Check
Read through the following statements/questions. You should be able to answer all of these after reading through the content on this page. I suggest writing or typing out your answers, but if nothing else, say them out loud to yourself.
Please read the following sentences, and think about the message(s) each one is giving you. Imagine that you don't know anything about the person who is making the statements other than what you read. Treat each example separately.
- I think solar panels are a wonderful technology, don't you?
- I have been in the energy business for almost 40 years, including 30 in the oil and gas industry. But like you, I'm a cost-conscious homeowner with bills to pay. I've never seen a technology as potentially game-changing as solar panels. Those things are going to change the world, and better yet they will save you money.
- Did you know that Tesla Energy will install and maintain solar panels on your roof for no extra cost? You don't have to lift a finger, and you will end up paying less for electricity than you do now. You can save money and get inexpensive, clean electricity. And all of it is guaranteed by contract! I had them install panels on my house, and couldn't be happier. They'll do the same for you.
- You know, every time I see that old coal-fired power plant I think of all of the innocent children living nearby that are probably having asthma attacks because of the pollution. That's why I added solar panels to my roof.
Each of these statements exhibit an attempt to convince you that solar panels are a good idea, but each in a different way. Think about the language devices employed in each of the sentences. What part of your psyche does it attempt to address? Is it logic, emotion, or something else? Are they obvious attempts to gain your agreement, or do they seem reasonable?
Rhetoric
Each of these sentences uses a different rhetorical strategy. Rhetorical strategies are the subject of this lesson, specifically the rhetorical triangle. At the root of all of this is rhetoric, so let's start there. This is just a quick video introduction - no need to take any notes (3:24 minutes).
About 28 centuries ago, people really admired wisdom. They called it Sophos, and people admired it so much they were willing to pay for it. They would hire Sophists to teach them all manner of things particularly law and politics, so the Sophists were traveling teachers and poets who roamed the countryside of Greece and they taught anyone willing to pay to learn. As time went on, these Sophists became the most effective lawyers and gave advice to those governing the new Athenian democracy.
After a while, however, Socrates and his student Plato brought up the idea that the Sophists were not all that wise. In fact, they argued, what they were good at was structuring their lessons to simply sound wise. In essence, Socrates and Plato said the Sophists spoke so persuasively and so falsely that they could make listeners believe black was white. Also, Socrates and Plato objected to the fact that the Sophists charge for their services while they, being both wise and noble, dispensed their wisdom for free. They created such an uproar that even to this day the term Sophists is an insult. "You're a Sophist."
Not long after, Aristotle, a student of Plato, finally developed some rules for publicly dispensing wisdom and using language persuasively. He put down all his rules in a book, which he called The Art of Rhetoric. In The Art of Rhetoric, Aristotle separated out the wisdom from the skill needed to dispense it. He wrote down rules for arguing, ones which required arguers to be ethical as well as persuasive. Aristotle laid out three appeals: logos, pathos, and ethos. He said the arguer should be logical, appeal to emotion, and build his trustworthiness with the audience by being ethical. He also listed 13 tricks or fallacies to avoid in arguing and laid out the ethics he thought an arguer should have.
Later, the Romans based their concepts on the Greeks. A Roman named Cicero came out with a text in the first century listing five canons of argument: (1) invention - creating ways to be persuasive; (2) arrangement - structuring an argument effectively; (3) style - presenting an argument so as to appeal to emotions; (4) memory - speaking extemporaneously; and (5) delivery - effective presentation. Cicero had so much to say that he put it into five books. When you understand that the Romans were very eager to practice law and politics, you understand why they cared about public speaking and argument enough to need five books.
Cicero's five canons influenced Europe for centuries. All students were taught grammar, logic, and rhetoric. After the Roman Empire fell, rhetoric existed only in the writing of letters and sermons. After a bit, people started preaching and rhetoric became oral again. During the Renaissance, however, oral rhetoric became very popular once more (that's Shakespeare's time) far beyond preaching. Rhetoric became essential to lawyers, politicians, priests, and writers. Anyone who wished to persuade a wide audience sought to train in it, and this continues today.
Now, we've skipped over more than 1500 years of rhetoric and argument, but you have the basics. Today, unfortunately, the word rhetoric has taken on some of the negative connotations of sophistry people think of it as eloquent speech designed to deceive. Especially when politicians are involved, calling something rhetoric is a pejorative.
And that is the history of argument in just over three minutes.
To Watch Now
Purdue University's Online Writing Lab [487] (OWL) provides a lot of publicly available resources that are designed to help students and others become better writers. We will be watching some videos and reading some of their material in this lesson. They do not allow embedded videos, so please click on the link below to watch.
- "Introduction to Rhetoric [488]." Purdue OWL.
Rhetoric/rhetorical arguments are designed to convince an audience of whatever the speaker is trying to say, or as Purdue OWL notes, it is "about using language in the most effective way." You most often hear this when referring to a politician, or at least someone acting politically or disingenuously, for example: "That speech was all rhetoric." When you hear or read this phrase, it is meant in a negative way and implies that the speaker was using language to trick the audience into believing the argument they were presenting. As noted in the video above, this negative connotation goes back centuries. But rhetoric has a few connotations, not all of them negative. It can refer to "the art of speaking or writing effectively," and "the study of writing or speaking as a means of communication or persuasion." These two definitions do not necessarily connote deceit. But it can also mean "insincere or grandiloquent language" (Source: Merriam-Webster [489]).
So, contrary to popular belief, rhetorical arguments are not always "insincere." Using rhetoric effectively can help convince the audience of your message. This is an important part of effective communication, including communicating information about sustainability. That stated, understanding rhetorical strategies can help you "see through" insincere arguments that are presented to you.
One final note: Rhetorical strategies can also be deployed visually - for example in images, photos, and video - and audibly. Advertisers do this all the time, as do movies, politicians, and even college professors!
Ethos, Pathos, and Logos
Rhetoric is used to persuade people, and there are three general strategies used to do this: ethos, pathos, and logos. Please watch the following 5:40 minute video and read the readings below as an introduction to these strategies. We will then go into more detail in each in the following lessons.
Persuasion is an art. Great speakers throughout time have been able to change their listeners' minds and even move their audiences into action through the art of persuasion. Consider these persuasive speakers and how they changed the world through what they said.
For example, JFK in his speech where he said: "Ask not what your country can do for you but what you can do for your country." Or Ronald Reagan, twenty years ago, when he said: "Mr. Gorbachev tear down this wall," or Obama who inspired a nation to believe in hope instead of fear. Nelson Mandela, Gandhi, and even Oprah who persuades people every day to know better and to do better, or how about these leaders: Hitler, Stalin, Jim Jones who brainwashed his congregation, leading 900 of them unknowingly to their deaths through a mass suicide order? Now, obviously, not all of these speakers are viewed as positive voices of change. These last examples even change the world for the worst, but let's face it: they did it through the art of persuasion.
Now considering the fact that persuasion can be used for many purposes, it is important that individuals exercise ethical persuasive methods when seeking to persuade an audience. Let's face it: you could get an audience to believe anything you want them to if you have the right facts, a persuasive approach, and sometimes a willing audience. Some people accuse Obama of this, others accuse Rush Limbaugh of the same thing, but the fact remains that both of these men have been persuasive to certain people groups by using information and motivational appeals. However, presenting facts on only one side of an issue without being transparent about the other side of the issue is sometimes unfair and unethical in seeking to persuade an audience. Think about it: I'm sure you've been on the receiving end of gossip. Perhaps someone twisted a truth about you into something that wasn't true because they didn't share the whole truth or the full story. When people use information to make it say what they want it to say without sharing the other side, this can sometimes be considered unethical persuasion. It is important to use information and motivational appeals ethically.
So let's talk about some specific motivational appeals summarized by the Greek philosopher Aristotle thousands of years ago. He believed that to be a truly effective speaker or writer you had to appeal to three things when giving information to an audience or reader. The first is ethos, or credibility. Ethos refers to the way in which a person convinces someone else to believe him or her simply by his or her character, credibility, and trustworthiness. We tend to believe and follow people we can respect. One can often increase ethos by being knowledgeable about your topic so that you have the authority and right to speak on the subject matter you are presenting. Another way to increase ethos is to appear thoughtful, fair, and respectful of alternative points of view. Your accuracy and thoughtfulness in crediting your sources, professionalism and caring about your speech and its structure, your proper use of grammar, and your overall personal neatness are all part of the appeal to ethos.
The second motivational appeal described by Aristotle is pathos. Pathos refers to persuading by appealing to an audience's emotions, values, and beliefs. Word choice affects the audience's emotional response and emotional appeals can effectively be used to enhance persuasion. This means that your speech should not only be someone else's words or research. You must tie together your research by crafting your speech with your own words in a way that is persuasive and interesting for your audience.
The third emotional appeal is logos. As you may assume from the term, logos is an appeal to reason, or logic. This will be the most important technique you will use in your persuasive speech and it was Aristotle's favorite. It includes the internal consistency and clarity of your speech. It requires that you make a claim and use quality reasons and evidence to support your claim. Just like a lawyer crafts his or her argument with a logical flow that appeals to the minds of the jury, so too must you put together a speech that has a logical flow of persuasion. Giving reason is the heart of persuasion and cannot be emphasized enough. You simply cannot and should not seek to persuade without strong information and a strong logical flow of that information.
Using ethos or credibility, pathos or emotional appeals, and logos or logic is important for any persuasive speech speaker. If you're seeking to truly persuade an audience, it's important to have all three: like one leg missing from a three-legged stool would cause the stool to collapse, so will your argument or persuasion collapse if you're missing one of these important motivational appeals. Remember, persuasion is not just standing in front of an audience and rattling off facts in hopes that your information will get an audience to change. The speaker must play an active role in persuasion. You are part of your persuasive message and your credibility, emotional appeals, and logic are important when preparing your speech.
So good luck as you prepare to persuade. Changing minds, hearts, and actions isn't easy but with the right attitude and preparation, you can succeed. Prepare for your own success and have fun while doing it.
To Read Now
The following provides a good, succinct explanation of the three strategies, as well as some examples.
- "Ethos, Pathos, and Logos Definitions and Examples [492]," PathosEthosLogos.com
- (Optional) "Using Rhetorical Strategies for Persuasion [493]," Purdue University Online Writing Lab
Good to Know
Ethos, pathos, and logos are rhetorical strategies, but these are not rhetorical devices. Rhetorical devices are specific methods that can be deployed to make a persuasive argument, whereas rhetorical strategies are general strategies. You have likely picked up on many of these devices when listening, reading, or speaking. Politicians are particularly fond of them. The "Mental Floss" website [494] goes over some of them. If you Google around, you will find more.
Optional (But Strongly Suggested)
Now that you have completed the content, I suggest going through the Learning Objectives Self-Check list at the top of the page.
Ethos
Learning Objectives Self-Check
Read through the following statements/questions. You should be able to answer all of these after reading through the content on this page. I suggest writing or typing out your answers, but if nothing else, say them out loud to yourself.
Two of the previous sources provide concise definitions of ethos (bold letters are my highlights):
- Purdue OWL defines ethos as "the ethical appeal...based on the character, credibility, or reliability of the writer" (source: Purdue Online Writing Lab [493]).
- Pathosethoslogos [492]notes that ethos is "ethical appeal, means to convince an audience of the author’s credibility or character. An author would use ethos to show to his audience that he is a credible source and is worth listening to."
Important Note
Before we go any further, please consider the following. This has caused some confusion in past classes: Despite the definition above, is NOT primarily based on demonstrating you are an ethical person (though that may be part of it). It can most easily be summed up in one word: credibility. Keep that in mind, please.
Purdue provides the following examples of ways that you can establish ethos. I highlighted a few things that are most important to consider:
- "Use only credible, reliable sources to build your argument and cite those sources properly.
- Respect the reader by stating the opposing position accurately.
- Establish common ground with your audience. Most of the time, this can be done by acknowledging values and beliefs shared by those on both sides of the argument. [Another very common way to do this is to make yourself and/or your argument relatable. Getting your audience think "they are just like me" is a very common way to establish ethos.]
- If appropriate for the assignment, disclose why you are interested in this topic or what personal experiences you have had with the topic.
- Organize your argument in a logical, easy to follow manner. You can use the Toulmin method of logic or a simple pattern such as chronological order, most general to most detailed example, earliest to most recent example, etc.
- Proofread the argument. Too many careless grammar mistakes cast doubt on your character as a writer."
Pathosethoslogos provides the following advice:
- "Ethos can be developed by choosing language that is appropriate for the audience and topic (also means choosing proper level of vocabulary), making yourself sound fair or unbiased, introducing your expertise or pedigree, and by using correct grammar and syntax."
I know what you are probably thinking: This seems a bit complicated! There are a lot of rules! Actually, it's not terribly complicated. There are many ways to establish ethos (credibility) with your audience. Some of the most common are listed above, but there are others. What it boils down to is that whether you are speaking, writing, or trying to communicate in any way, anything you do to try to convince your audience that you are a credible, reliable source of information, it is ethos. Any time that someone is trying to establish credibility, they are using ethos.
Okay, now lets' get back to our original examples. Which of these sentences relies the most on ethos, and why do you think so?
- I think solar panels are a wonderful technology, don't you?
- I have been in the energy business for almost 40 years, including 30 in the oil and gas industry. But like you, I'm a cost-conscious homeowner with bills to pay. I've never seen a technology as potentially game-changing as solar panels. Those things are going to change the world, and better yet they will save you money.
- Did you know that Tesla Energy will install and maintain solar panels on your roof for no extra cost? You don't have to lift a finger, and you will end up paying less for electricity than you do now. You can save money and get inexpensive, clean electricity. And all of it is guaranteed by contract! I had them install panels on my house, and couldn't be happier. They'll do the same for you.
- You know, every time I see that old coal-fired power plant I think of all of the innocent children living nearby that are probably having asthma attacks because of the pollution. That's why I added solar panels to my roof.
If you said the second example, then give yourself a pat on the back. The language used in that narrative is a clear attempt to establish the author's credibility, in a few ways.
- First of all, saying that "I have been in the energy business for almost 40 years" is meant to be a strong indication that I know energy. This is an attempt to establish credibility. If the person said that they were an accountant for 40 years, or a recent college grad with a History degree, would it have the same impact?
- The assertion that the person worked in the oil and gas industry is a more subtle attempt to establish credibility, because the renewable and non-renewable industries are usually competitors. The impact of the statement would probably be different if they said they worked in the solar industry, or if you knew they sold solar PV systems.
- The third attempt at ethos is made when the person tries to establish common ground [496] with the reader by stating they are a cost-conscious homeowner (this strategy is pointed out by the Purdue article).
Remember, any way that a speaker or writer can establish credibility and believability is ethos. There are myriad ways of doing this, including using appropriate language, citing legitimate sources of information, dressing appropriately, speaking/writing with confidence, avoiding grammatical and/or spelling errors, and more.
So, now that we have ethos figured out, here's a little curveball: Appeals to ethos can change from situation to situation, even if it is the same speaker or writer trying to convey the same message. The video below from our friends at Purdue University does a really good job of explaining this and goes over ethos in general as well.
To Watch Now
Please click on the link below for an explanation of ethos.
- Video explanation of ethos [497] from Purdue University Online Writing Lab.
The narrators sum up ethos nicely by stating that: "In every rhetorical situation, ethos means a quality that makes the speaker believable." This "quality" can and does change all the time. Even if you don't have the credentials that render you credible on the topic, you should do your best to establish credibility by doing things like using reliable sources, proper language, and so forth. You've probably heard the truism that as a speaker or writer you need to "know your audience." Establishing ethos is one of the reasons why. You want your audience to believe you and ethos can help make that happen. Politicians are particularly (or notoriously, depending on whom you ask) good at doing this. A few examples of this can be seen below.
Try this!
Take a look at the photos of former President Obama below and think about the different ways that he is trying to establish credibility with his audience.

Notice the stark difference in physical appearance in the photos of Barack Obama above. What messages is he sending with regards to ethos? The left photo shows the classic "sleeves rolled up" look, which politicians use to speak to "regular folks," usually in public settings like fairs, construction sites (they'll also don a hard hat for this), local restaurants, and so on. The ethos-related messaging is something like: "Hey, I'm just a regular, hard-working guy like you. I understand your problems." But by wearing a dress shirt instead of, say, a polo shirt, an air of authority and professionalism is still presented.
The photo to the right presents a much different attempt at ethos. He is projecting an image of power and authority by wearing a suit and tie, being the only person in the shot, and sitting in a well-appointed office. Even his posture is different than the other photo. Note that both an American flag and flag with the Presidential Seal is in the background. Both project authority, among other things. Do you notice anything else in the background? Do the family pictures convey a message? This is a subtle reminder that he has a family with two young children, and thus is relatable (this is probably also an example of pathos). Everything in the frame is very carefully considered before the cameras roll. (Politicians are generally obsessed with symbols and appearance.)

Again, the same person can project a different ethos with a simple change of outfit. On the left, former President Musharraf is sending a reminder that he is a military general and thus has credibility when discussing military matters. If he wore the military outfit while meeting with former President Bush, he would be conveying a different message than if he was wearing a suit, as he is in the right photo. He still projects authority but in a more business-like, professional manner.
Let's go over one more example, just to hammer the point home. Say you have a question about investing money. Which out of the two people below would you ask?

_(1).jpg)
Which person do you think is better suited to answer your question? If you said the guy on the left, you were wrong! That is John Niederhuber, former Director of the National Cancer Institute. He may be a good investor, but I'd have to do some more research to figure that out. The woman to the right is Chanda Kochhar, CEO of India's largest private sector bank. She manages nearly $125 billion in assets, and is quite a good business person/investor, according to Forbes Magazine [504]. If I only knew their respective positions, I would definitely ask Ms. Kochhar first.
Let's assume that you picked Mr. Niederhuber (like I would if I did not do any research). There are a couple of lessons to be learned here. First of all, looks can be deceiving. Closely related to that is, do your research when determining ethos. We live in a time where there is no shortage of access to information. Use the Internet to your advantage. The third is that we are all biased. Even if you did not assume that Mr. Niederhuber was more qualified to speak to financial issues, it is very likely that the idealized image of an investment banker is almost certainly male, and, at least in the U.S., white. There is nothing to be ashamed of for thinking this - if I'm being honest, when I picture, say, an investment banker, my immediate image is a young- to middle-aged white guy with a suit and tie, despite the fact that I in no way believe that this is the only type of person suitable for or capable of this career. It actually bothers me that this happens! But we are all products of our respective environments, and most of the investment bankers and Wall Street types we are used to seeing in the U.S. are white men. This is slowly changing but, historically, women have not been granted the same opportunities as men in certain sectors, business and investing being two of them. For example, of the top 500 companies in the U.S. (the S&P 500) in 2021, an all-time record of 41 (yes, that's 41 out of 500) were headed by women. If you are counting at home, that is 8.1%. Only 4.6% of the global 500 companies are headed by women (source [505]). This is slowly changing, but not fast enough to alter the perception of what a powerful business person "looks like."
Remember that one of the goals of this course is for you to be able to critically analyze claims being made. One important aspect of doing that is to recognize preconceived notions and biases and to try to look past them. Try to step outside of your own experience and viewpoint, and as much as possible, investigate ethos from an objective perspective.
One Final Note
It can be easy to view ethos as a way to "trick" audiences into being persuaded by someone. This can certainly happen, and often does. This is a common problem with politicians, as they never want to appear not credible. But it is important for you to know that ethos can be legitimately established. Knowing as much as possible about the source of information is an important aspect of determining credibility. For example, if I want to know about drought conditions across the U.S. [506] I refer to the National Oceanic and Atmospheric Administration (NOAA) [507], since I know that monitoring water conditions is one of their focuses, and that they are tasked with presenting an unbiased, scientific perspective. In short, I know that they are credible.
If the Administrator of NOAA [508]was to give a speech or write an article, (s)he would be remiss if (s)he did not let the audience know her/his position. (S)he has credibility, but still may need to establish ethos. Doing this does not mean that (s)he is trying "trick" anyone, but it does mean that (s)he is trying to strengthen her/his argument, which if you recall is the purpose of rhetoric. Ethos is only established if the audience thinks that you and/or your argument, is credible, and that can be done without being dishonest or "tricky" in any way.
Summary
There are a lot of ways to establish ethos, and they can change from audience to audience. The adage "know your audience" is an essential consideration.
Remember that ethos (despite the name) is not expressly an appeal to the audience's ethics, but to try and establish your credibility with the audience.
The most common ways to establish ethos are as follows (in no particular order):
- Establishing yourself as someone who is knowledgeable about the topic at hand.
- (related to the above) Communicating in a way that makes it seem like you know what you are talking about, even if you are not an expert, e.g. by using correct terminology and speaking/writing confidently.
- Using good sources, e.g. telling the audience that you got your information from a well-regarded institution, expert, or other source of information.
- Establishing common ground with the audience.
- Stating things that are known to be correct or convincing the audience that you are correct.
- Make logical, convincing arguments, e.g. by structuring them well.
Check Your Understanding
Describe one specific example of something that could establish OR compromise ethos, depending on the audience.
Optional (But Strongly Suggested)
Now that you have completed the content, I suggest going through the Learning Objectives Self-Check list at the top of the page.
Pathos
Learning Objectives Self-Check
Read through the following statements/questions. You should be able to answer all of these after reading through the content on this page. I suggest writing or typing out your answers, but if nothing else, say them out loud to yourself.
Please watch the commercials below before continuing.
McDonald's Baby Commercial (1:04 minutes)
This Commercial shows a man with a baby driving around the McDonalds drive-thru early in the morning. Instead of stoping at the drive-thru window like someone would normally do, the man continuously drives around the McDonald's in the Drive-thru lane without stopping. The Reason that he does this is because there is a sleeping baby in the back seat, and he does not want the baby to wake up. The McDonald's Employees don't understand what is going on at first, but eventually, they catch on and try their best to help him. The steps the employees take to help them include talking really fast and quietly into the intercom when the man drives by the intercom and making a sign that shows his total at the front of the store so he can see it as he drives by. Eventually, the employees make his order, and he swaps it really fast with the money that he uses to pay for the order. He then fist pumps in front of the restaurant before he drives back onto the road.
Play Station Vue "Menace" Commercial 2016 (1 minute)
This commercial begins with showing a man getting his mail. It also shows a guy working on a cable line that takes off his sunglasses to reveal that he is a robot. Once he takes his mail inside he pulls out his cable bill. He tries to pull his bill out of the envelope, but the bill is very long and continuously comes out by itself. The man is noticeably startled by this. The commercial then cuts to a woman in bed woken up by an alarm. She then picks up the phone and begins crying into it. She then grabs the phone and rips it from the wall where it is plugged in and throws it on the floor and begins hitting it and crying. The commercial then cuts to a screen that says "It's time for better TV," and then it cuts to a screen that says PlayStation Vue.
Children See. Children Do. (1:31 minute)
This video shows how children copy adults no matter what they do. The video starts out with more harmless things and then it gradually gets to very concerning, evil things. The video starts out showing a little girl copying and following an older man talking on his phone while walking. Then it shows a women with another little girl copying her on a payphone. Next, it shows a man waiting for the train with a little boy copying him. After that, it shows a women going up an escalator smoking a cigarette with a little girl following her also smoking a cigarette. Then it shows a man drinking and then littering with his can and a little boy follows and does the same thing. Later, it shows a girl stumbling in an alleyway about to throw up with a little girl following her and copying her. After that it shows a woman sticking her middle finger up at another driver while driving and a little boy in the back seat is also sticking up his middle finger at the other driver. Then it shows a man pointing and yelling at a dry cleaner employee and a little boy next to him does the same thing. After that, it shows a man and a little boy throwing rocks at an animal. Then it shows a women and a little girl drunkenly yelling at a baby in a crib. Finally, it shows a man getting into an argument with a women that turns physical, and the video stops as the man and a little boy following him are about to throw a punch. The video then says "Children See, Children Do", and then it shows a man helping another women pick up her things after dropping them. The screen then reads "make your influence positive, "and then the commercial ends.
(Wow, that last one "gets me" every time I see it!) What was your reaction to each of these videos? Was your reaction to each similar in any way? Different? If you have not already, take a moment to think about how each commercial tried to persuade you through its emotional content.
To Watch Now
Please click on the link below for an explanation of pathos.
- Video Explanation of pathos [517] from Purdue University Online Writing Lab
As noted in the video, pathos can be defined as "the emotional quality of the speech or text that makes it persuasive to the audience." Though most often associated with sympathy, sadness or similar "sad" emotions, pathos can utilize the full range of human emotion, including anger, joy (e.g., through laughter or inspiration), frustration, suspicion, curiosity, scorn, repulsion, jealousy, desire, compassion, hope, love, and more.
Please take a few minutes and think about all the ways that the commercials at the top of the page attempt to elicit an emotional response. Do these attempts make the commercials more persuasive? Why or why not?
The McDonald's commercial uses one of advertising's favorite pathos tool - the baby [518]. Babies tend to elicit all kinds of positive emotions - e.g., happiness, sympathy, love, and compassion. When in doubt, find a way to put a baby (or puppy) into your advertisement! (No, seriously. Next time you see some advertisement, see how often a baby or puppy appears.) The commercial also uses humor and (for parents, anyway) empathy. Even the music evokes pathos. Note that the baby is essential to the plot of the commercial, but I submit that (s)he has absolutely nothing to say about whether or not I should eat at McDonald's. Pathos does not need to be logically consistent with the rest of the work. It is meant to play on the audience's emotion(s). This is one thing that distinguishes the first ad from the second.
The second ad uses kind of an odd mixture of suspense, dread, and humor to get its point across. The humorous aspect in and of itself has little connection to the product. (It should be noted that there is some humor in the first commercial as well, e.g., the girl hurriedly sliding over the counter in the middle of it.) However, the negative emotion created by the man's reaction to the cable bill and the woman's to the telemarketer could be said to have a direct connection to real-life experience of issues related to cable TV. Of course, this is all seriously overdramatized (at least for me, but I suppose everyone reacts to their bills in their own way), but milder versions of the emotions expressed are not far-fetched.
The third ad uses pathos (sympathy, sadness, anger, etc.) to get its point across, but the pathos is very much consistent with the message of the video. Speaking for myself, the imagery used in the third video makes it much more impactful than an article providing statistics about how parents' behavior can negatively impact children. In other words, the pathos served its purpose.
I consider the pathos in the McDonald's ad to be "fake pathos," which was described in the video from Purdue. From my perspective, the McDonald's ad is a clear attempt at emotional manipulation (though I don't think they want the viewer to think that), and thus compromises the ethos of the company because it calls into question their credibility. Call me a cynic, but I don't think that McDonalds' goal in making the ad was to spread joy and laughter. As the folks from Purdue mentioned, that is the risk you run if your pathos is not genuine. The Sony commercial is overdramatic, but it's so "over the top" that it's quite clear that it is done in jest and (again, speaking for myself) does not compromise ethos. Regardless of how genuine or fake the pathos is, it is still used to create an emotional response. To a large extent, the impact on ethos is subjective.
Pathos in Writing
Pathos is the most commonly used rhetorical strategy in advertising (both print and video) because it is often relatively easy to do with imagery. See below for an interesting example from the World War II era.

Pathos can also be conveyed in writing. As noted in the video, this often boils down to word choice, in particular, adjective choice. In fact, word choice often provides the reader with insight into the motivations of a writer.
To Read Now
The two articles below are about the same issue - the revised "Clean Power Plan [520]" announced by the Obama Administration in August of 2015, which has since been revoked by the Trump Administration. This plan was designed to reduce CO2 emissions from power plants in an effort to "take real action on climate change" by requiring states to meet emissions standards set by the federal government. This would have impacted some states more than others - states who get a high percentage of their electricity from coal would be particularly impacted. As you can well imagine, this was not without controversy. When reading the articles below, pay special attention to word choices that can elicit emotion, especially when other, more neutral words could have been used. Note that both are from reputable websites, but that both are opinion pieces.
- Climate-Change Putsch [521]," Wall Street Journal (the article is unattributed, but it appears it was written by the Editorial Page Editor Paul Gigot). This was accessed via Kentucky Industrial Utility Customers. Here is a .pdf [522] in case you cannot access it.
- "Obama Administration Issues 'Strong and Smart' Final Clean Power Plan - Biggest U.S. Carbon Emission Reduction Measure in History [523]," by Ken Kimmell, President of the Union of Concerned Scientists. (PDF version is here [524].)
To Read Now
Here is another short article about the Clean Power Plan. See if you can pick up on any use of pathos from the author, or not.
- "Could Obama's Clean Power Plan Lower Your Electric Bill? [525]," by Daniel White, Time Magazine. (PDF version is here [526].)
Was pathos used by the author? The only instances of pathos are used to describe what other people are saying - e.g., "slashing jobs," "driving up prices" - the author himself writes dispassionately about the topic. This demonstrates good reporting, using more ethos and logos (see next section) to persuade the audience.
Try This
Add and/or change some words from the Time Magazine article to evoke more pathos in the following paragraph. Have some fun with it!:
"In a report released last week, public policy professor Marilyn Brown found that boosting renewable energy sources such as wind and solar power would reduce energy costs in the long run as they become more readily available. Even if energy costs did go up in the short run, she argued that would cause consumers to invest more in things like energy-efficient appliances, which would again lead to lower electricity bills over time."
Please note that I am not advocating one opinion over the other on this topic, nor am I saying that either of the authors are telling untruths. I am merely pointing out word choices that convey pathos. Perceptive readers will pick up on such word choices, which may compromise ethos. Pathos can be an effective persuasive technique, but generally only if the reader agrees with the author's arguments. As critical thinkers, you should be skeptical of anyone that uses pathos in such a way that appears to try and persuade you to believe one thing or another, whether or not you agree with the overall point.
Finally, back to the statements at the beginning of this lesson. Which one is most pathos-filled?
- I think solar panels are a wonderful technology, don't you?
- I have been in the energy business for almost 40 years, including 30 in the oil and gas industry. But like you, I'm a cost-conscious homeowner with bills to pay. I've never seen a technology as potentially game-changing as solar panels. Those things are going to change the world, and better yet they will save you money.
- Did you know that Tesla Energy will install and maintain solar panels on your roof at no extra cost? You don't have to lift a finger, and you will end up paying less for electricity than you do now. You can save money and get inexpensive, clean electricity. And all of it is guaranteed by contract!I had them install panels on my house, and couldn't be happier. They'll do the same for you.
- You know, every time I see that old coal-fired power plant I think of all of the innocent children living nearby that are probably having asthma attacks because of the pollution. That's why I added solar panels to my roof.
Of course, the last one is the correct choice. The use of children's suffering and in particular the use of the word "innocent" are both meant to elicit pity, and ultimately sympathy. Even if it is true, the statement is unnecessarily emotive. I could have just kept to the facts and stated that said power plant has been shown to cause asthma problems for children. This is a strong reason to be concerned. It is still an example of pathos, but does not lay it on quite as thick.
Optional (But Strongly Suggested)
Now that you have completed the content, I suggest going through the Learning Objectives Self-Check list at the top of the page.
Logos
Learning Objectives Self-Check
Read through the following statements/questions. You should be able to answer all of these after reading through the content on this page. I suggest writing or typing out your answers, but if nothing else, say them out loud to yourself.
To Watch and Read Now
The folks at the Purdue Online Writing Lab provide a good explanation of logos.
- An Introduction to Logos [527]. Purdue Online Writing Lab (video)
- Please also read the logos section [493] (stop at "Avoid Logical Fallacies," but you can read on for some insight into extra credit questions) of the OWL's rhetorical strategies introduction.
It is very important to note that logos is not necessarily how logical (sound) or accurate (true) the argument is. It is the attempt at logic made by the way the argument is structured. Of course, a sound and true argument is more likely to establish logos, but it depends on the perception of the audience. As noted in the reading above, two common ways of doing this are through inductive reasoning and deductive reasoning. Inductive reasoning takes a specific example or examples, then assumes that a generalization can be made based on that example or those examples. In other words, inductive reasoning goes from the specific to the general. The following are examples of inductive reasoning:
- Every time I forget to water my cucumber plants during the hot part of the summer, they shrivel up and die. I guess cucumbers need water to survive.
- All the storms I've seen blow in from the west, so all storms must move from west to east.
- I had a friend from Switzerland who was really nice, so all Swiss people must be nice.
- After the Obama Administration gave a guaranteed loan to the solar company Solyndra, it failed and the taxpayers lost money. Therefore, all loan guarantees should be stopped because they will lose money.
Inductive reasoning can be correct or incorrect (the first example above is correct, and the other three are not, by the way) - it is up to the audience to determine whether or not the logic is valid. But inductive reasoning is an attempt at logos, irrespective of its validity. The persuasive effectiveness of logos depends on a myriad of factors and can change from audience to audience. The same goes for deductive reasoning. Deductive reasoning is the application of a general belief, and applying it to a specific example, i.e., it goes from the general to the specific. Some examples of deductive reasoning are below:
- Every time I forget to water my cucumber plants during the hot part of the summer, they shrivel up and die. Therefore, if I forget to water my cucumers this year, they will die.
- Every time the gas prices drop significantly, sales of SUVs go up. The price of gas is expected to decrease dramatically this year, so sales of SUVs will increase.
- I've seen hundreds of swans, and they've all been white. Therefore, the next swan I see will be white.
Like inductive reasoning, deductive reasoning can be false (neither of the above statements can be verified, but they can certainly be false), even if they are sound. If I've seen hundreds of swans and they have all been white, then assuming that the next swan I will see will be white is sound reasoning based on my experience, but it may be false because there are other colors of swan out there. Again, it is up to the audience to determine whether or not the logic is sound and/or true, but it is an example of logos either way.
Logos Strategies
As is the case for pathos and ethos, the effectiveness of the rhetorical strategy depends on many factors, and can (in fact, often does) change from audience to audience. With logos, sometimes seemingly sound arguments are neither sound nor true. This is referred to as a logical fallacy. Logical fallacies are encountered all of the time, and you may even use them, accidentally or otherwise. Logical fallacies will undermine your persuasiveness if they are found by the audience, and in turn, impact your ethos as well as your logos. The reading from Purdue linked to previously goes over some of these arguments and provides some examples. There are many possible strategies, sometimes known as "logical appeals," to making a logical argument. Some of them can be seen in the reading below.
To Read Now
Dr. George H. Williams, Associate Professor of English at the University of South Carolina, put together some good examples of logical strategies. Please read the "Logos" section in the reading below.
- Ethos-Pathos-Logos-The-3-Rhetorical-Appeals [529], Dr. George H. Williams
- (Optional) If you have not yet, read through the "Avoid Logical Fallacies [530]" section of the OWL reading. Note the logical fallacies included: slippery slope, hasty generalization, post hoc ergo propter hoc, genetic fallacy, begging the claim, circular argument, either/or, ad hominem, ad populum, and red herring.
Given all of this, which of the examples below are the strongest attempt at logos? Do any of the other sentences exhibit logos?
- I think solar panels are a wonderful technology, don't you?
- I have been in the energy business for almost 40 years, including 30 in the oil and gas industry. But like you, I'm a cost-conscious homeowner with bills to pay. I've never seen a technology as potentially game-changing as solar panels. Those things are going to change the world, and better yet they will save you money.
- Did you know that Tesla Energy will install and maintain solar panels on your roof at no extra cost? You don't have to lift a finger, and you will end up paying less for electricity than you do now. There is no better way to save money and get clean electricity for your home. And all of it is guaranteed by contract! I had them install panels on my house, and couldn't be happier. They'll do the same for you.
- You know, every time I see that old coal-fired power plant I think of all of the innocent children living nearby that are probably having asthma attacks because of the pollution. That's why I added solar panels to my roof.
Check Your Understanding
Optional (But Strongly Suggested)
Now that you have completed the content, I suggest going through the Learning Objectives Self-Check list at the top of the page.
Greenwashing
Learning Objectives Self-Check
Read through the following statements/questions. You should be able to answer all of these after reading through the content on this page. I suggest writing or typing out your answers, but if nothing else, say them out loud to yourself.
Watch the video (:38 minute) below and see if you pick up on any rhetorical strategies.
The BP ad begins by showing 4 babies in a car driving down a road. There is a jaunty tune playing in the background that says: "Say hey! Make the day a little better. Say hey! Make the way a little better! It's the place that I want to beeee." Then there is some happy whistling. The kids are singing along at certain parts.The baby driving looks at the gas gauge and realizes that the gas tank is basically empty. The babies then look for gas station, but the first 2 that they pass seem evil and/or broken down. Suddenly, the baby driving points and they see a BP gas station where everything is happy. It then shows "gas stations, a little better, baby" on the screen followed by the BP logo as the commercial ends.
So, what did you find?
Pathos
This commercial is filled with pathos. The babies (are some children?) are meant to evoke happiness/warmth/etc. The song is jaunty and catchy - I don't know about you, but I actually like it. The imagery (other than the "bad" gas stations) is colored with pastels, giving it a very soft look. The BP gas pump is whistling (!) and the kids are smiling after they go to the BP station. There is a small attempt at humor at the end (the "baby" part of "gas stations, a little better, baby"). All of this is pathos.
Ethos
The only thing I could detect was at the end when BP put its brand on the screen "Beyond Petroleum." This is a weak attempt at establishing credibility, and I imagine not purposeful. They do that at the end of every commercial. There is no scientific information or even scientific-sounding information. No people in lab coats or statistics cited. Really, very little in the way of ethos.
Logos
There is not much in the way of logos either. The story does have a logical progression - happy kids run out of gas, pass gas stations with inferior gas, kids refuse the "bad" gas, then find a BP station and end up happy and high-fiving. I know, this story is ridiculous on its face, but it does tell a story with some logic to the structure. If there is a logic to the structure, then it has logos. BP is also saying that their gas is better, or at least a little better. You could also say that showing wind turbines at the end of the commercial are an attempt to associate renewable energy with BP, so perhaps the audience might think that BP supports wind turbines. This is a bit of a logical leap but could be considered logos.
There are a number of rhetorical strategies being deployed in this commercial, which to be honest, is to be expected. Please note that this is not meant to single out BP - as noted earlier in this lesson, print and video advertising is rife with rhetoric, pathos in particular. But is there anything that does not quite "sit right" with you when watching the video? Does it feel like part of the story is missing? Anything odd about an oil company using so much green imagery?
Greenwashing
To Read Now
This article provides a good introduction to what greenwashing is and how to spot it. Please read before continuing.
- "Greenwashing [533]" from Investopedia. Note the examples of greenwashing at the end of this article.
- (Optional) "About Greenwashing [534]." EnviroMedia Social Marketing.
Greenwashing can be thought of as:
- "the use of marketing to portray an organization's products, activities or policies as environmentally friendly when they are not."
- Greenwashing Index adds that it can also include "when a company or organization spends more time and money claiming to be “green” through advertising and marketing than actually implementing business practices that minimize environmental impact."
So, why would a company spend the time and money to convey a green image, and risk being viewed as insincere? As you might have guessed, it's good for business. Investopedia notes that: "The general idea behind greenwashing is to create a benefit by appearing to be a green company, whether that benefit comes in the form of a higher stock price, more customers or favored partnerships with green organizations."
Being (or at least putting on the appearance of being) "green" or sustainable has become a very good marketing strategy. Think about all of the times you've seen the term "green" or "sustainable" associated with a product or process. It is happening in basically all sectors of the economy - food, energy, transportation, housing, business, cleaning products, events, sports stadiums, and even fashion. Business pursuing sustainability is not a bad thing. If we are going to achieve a sustainable future, the business community will have to be on board, if not leading the way. The problem is when a business is using sustainability more as a marketing ploy than a legitimate attempt at addressing sustainability.
So, how do you know if a company is making a legitimate attempt at addressing sustainability? In short: it's complicated. The folks in the Greenwashing Index offer some good suggestions on how to investigate claims (see the "How Do I Spot It?" section in the reading):
- "If you see a green ad, take a look at the company as a whole. Can you easily find more information about their sustainable business practices on their website? Do they have a comprehensive environmental story? Is there believable information to substantiate the green claims you saw in the ad? If not, buyer beware."
- "Google the company name plus the word 'environment' and see what pops up. This is far from scientific, but if consumers or environmental advocates have a beef with the company’s track record, something’s bound to pop up."
- "'I know it when I see it.'...those are words to live by for the consumer and green marketing claims. If you spot a green ad, how does it strike your gut? Does it ring true and authentic, or is it obviously hype? Smart shoppers abound globally, and your own scrutiny of green marketing claims is one more item to throw into your shopping cart."
The best way to fight greenwashing is to become educated about sustainability and take the time to learn about companies. The 2:30 minute video below illustrates some facts about BP that could be found with a little research.
This video is the same video as what was shown above, but with speech bubbles thrown it that give you some true facts about BP. The speech bubbles are transcribed here. In 1991, BP was cited as the most polluting company in the U.S. So, by 1997, they decided to re-brand their name to Beyond Petroleum. But in 1999, they got caught for illegally burning gases and were fined 1.7 million dollars in addition to the 22 million dollars they already owed for the last 6 years. So, in 2000, they designed a green and leafy Helios Logo! But they then got fined another 10 million dollars by the EPA for more polluting that year. Therefore, they claimed that they would invest in 8 billion dollars in alternative energy pursuits through 2015. This sounded great...as long as they didn't mention grossing over 248 billion dollars a year. They got away with pledging less than 4 percent of an annual budget! And after spending another $200 million on our green PR campaign, the public bought it. They even bought-err- I mean, GOT support from the National Wildlife Federation. So, in 2005, they made it into Mother Jones' Top 10 Worst corporations for a pipeline burst in Alaska, and don't forget about the other explosion at a Texas refinery killing 15 and wounding over 100. Yeah, they got fined again in 2009 for another 87 million dollars for failing to correct these safety hazards even after the accidents. They made up for the fines by cutting investments in renewable energy by 30 percent in 2009. Then, in April 2010, their green image busted another leak, which was a big one, all over the Gulf of Mexico! Their decades of green cosmetics, greed, and noncompliance precipitated an unfathomable consequence, and they are only one oil company! The video then shows the BP logo leaking oil all over itself.
Even though BP is not directly making any claims other than being "a little better," the rhetorical strategies outlined above are used to indicate the company's "green-ness." To be fair, BP has been one of the more aggressive oil companies in regards to renewables. According to Bloomberg Business [537], they achieved their goal of investing $8 billion in renewables between 2005 and 2015. They heavily invested in wind farms, though they have recently put many of them up for sale. They had a solar division for decades, and only recently shut it down. They are still fairly heavily invested in biofuels. Whether or not it's wise for BP to invest in renewable energy may be debatable [538], but the point is that renewables are a tiny sliver of their business, so focusing marketing on that aspect is greenwashing.
You may be thinking "What are they supposed to do - advertise the negative climate change implications of their business?" That would be a fair question. But it is possible to be a little more reasonable in the message the company sends. If they oversell their "greenness," it is greenwashing.
To Read Now
This article from the Worldwatch Institute provides some examples of greenwashing, and some tips for how to avoid it.
- "5 Surprising Ways That "Green" Products Are Trying to Trick You [539]" Gaelle Gourmelon, The Worldwatch Institute.
Greenwashing is not only used by energy companies. Watch the 1 minute ad below and see if:
- you can pick up on any rhetorical strategies, and
- think about whether or not it is greenwashing (hint: think about what you know of the electricity industry from Lesson 1).
Please note that the presence of rhetoric does not mean it is greenwashing! Remember that rhetoric consists of techniques that are used to try to persaude an audience. Many times that persuasiveness is based on fact.
Okay, one more example. Once again, keep an eye out for rhetorical strategies (1:37 minutes).
As global warming becomes more of a concern, all of us in the petroleum industry are doing what we can to show that we care about the environment. Many of us have changed our logos from something like this, to this. See it looks like a flower!
And we in the plastics industry are doing our part by putting the word recyclable on all of our products. Where to recycle, how to recycle or what to recycle it into haven't been thought of yet, but we're spending millions researching where on our product the recycle logo is the most visible.
And I'm wearing a sweater instead of a suit, so I must love nature! And look where I'm standing, isn't it beautiful! Now when you think of oil refineries, hopefully, you'll think of this.
We're doing our part to look environmental, but we need you to meet us halfway and believe we're environmental, even when we lobby against pollution restrictions like the Kyoto Accord.
So when you hear about an oil spill that's killing thousands of birds or an oil spill that's destroying marine life or any oil related disaster, think of deer laying in a field.
Look dolphins! The more you think about these things, the less you're thinking about the island of plastic garbage in the middle of the Pacific that's twice the size of Texas.
Because, a clean ocean is a great photo opportunity...
For the children!
This message from the Canadian Resource Association of Petroleum and Plastic Producers. You can't spell green washing without green.
You probably figured out that this last one is a parody (a pretty funny one, if you ask me). But it actually makes some really good points by bringing light to the touchstones that many advertisers put in their commercials to persuade you. Again, this is not meant to single out the petroleum and plastic industries, as these techniques are used by many companies. But it is the only parody video I know of. Look, dolphins!
Again, the best way to detect greenwashing is to learn as much as possible about sustainability and to research companies' claims. The best way to reduce the incidence of greenwashing is for consumers to push back against companies that do it. By "voting with your dollars" you hurt profits, which is a good way to get a company's attention.
Why Should We Care?
Hopefully, it's pretty clear what greenwashing is, and how to spot it. But why does it matter? Of course advertisers are not telling us the whole truth, and are just trying to get us to buy their products. After all, that is literally their job (the part about getting us to buy their stuff is, anyway). The main problem with greenwashing is that it can trick people into doing things that they think is promoting sustainability, but it is actually not, or worse - it is promoting things that are bad for sustainability.
Most often, the best way to address sustainability is to not buy anything at all. But given that it's nearly impossible to go through life without buying things and that consumer spending constitutes somewhere around 70% of U.S. GDP [544], making wise consumer choices is important. Greenwashing makes this much more difficult.
One Final Note
Please note that the use of rhetoric and greenwashing are two separate things. Use of rhetoric does not constitute greenwashing. Of course they can and sometimes do appear at the same time, but these are separate concepts. That stated, they both call into question the credibility of the author.
Check Your Understanding
Why would a company risk being viewed as one that greenwashes?
Optional (But Strongly Suggested)
Now that you have completed the content, I suggest going through the Learning Objectives Self-Check list at the top of the page.
The Three Types of Lies
Learning Objectives Self-Check
Read through the following statements/questions. You should be able to answer all of these after reading through the content on this page. I suggest writing or typing out your answers, but if nothing else, say them out loud to yourself.
Hopefully, by now you see that there are a number of rhetorical strategies available to help convince people of an argument. Though this can be seen as manipulative in many cases, often times it does not involve actual lying. But what is lying, exactly? Merriam Webster's online dictionary provides two relevant definitions of a lie [546]:
lie (intransitive verb)
- to make an untrue statement with intent to deceive
- to create a false or misleading impression.
Seems pretty cut-and-dry, but for the purposes of this lesson, it is helpful to know that there are different types of lies. The three most commonly referred to are lies of commission, lies of omission, and lies of influence, aka character lies. The reading below neatly summarizes these and provides some examples.
To Read Now
These three types of lies are well-known, and there are many readings that illustrate them. This one from Vanessa Van Edwards is clear and offers a number of examples. I suggest going through the examples she provides to test your understanding.
The link will take you to the section of the website that you are required to read, but you are welcome to read the content above it as well.
- "Different Types of Lies [547]," by Vanessa Van Edwards, Science of People. You are welcome to read the whole article, but at least go to the "3 Types of Lies You Should Know" section. You can access this quickly by clicking on the link to the section on the slider on the left-hand side of the page.
Now that you have a good idea of what each of these three types of lies entail, take a second to think about which type of lie fits which of Webster's definitions above.
Optional (But Strongly Suggested)
Now that you have completed the content, I suggest going through the Learning Objectives Self-Check list at the top of the page.
Behavioral Economics
Learning Objectives Self-Check
Read through the following statements/questions. You should be able to answer all of these after reading through the content on this page. I suggest writing or typing out your answers, but if nothing else, say them out loud to yourself.
Try and think back to the very brief "Economics 101" lesson that was part of the explanation for externalities. If you recall, I noted that most economic decisions are based on weighing private benefit against private cost in an effort to maximize private benefit (remember the thrift store table?). This effectively summarizes the neoclassical economic model we've been using in the Western World for the past 150+ years, and it has changed very little in that time. When economics models people's decisions in this manner, the generic person in the model often referred to as "Economic Man" or "homo economicus," the latter of which is an obvious play on the term homo sapiens. Economic Man was described by Craig Lambert in Harvard Magazine [548] thusly:
Economic Man makes logical, rational, self-interested decisions that weigh costs against benefits and maximize value and profit to himself. Economic Man is an intelligent, analytic, selfish creature who has perfect self-regulation in pursuit of his future goals and is unswayed by bodily states and feelings.
As Lambert says, this is the "standard model...that classical and neoclassical economics have used as a foundation for decades, if not centuries." If you recall, I noted in the externalities lesson [549] that these conditions required for the behavior of what you now know as Economic Man "is generally not a reasonable set of assumptions, but that is a story for another day." Well, that other day has arrived, my friends! Most economics models are based on this assumed behavior, but there is at least one major problem with this. Lambert sums up the problem concisely: "But Economic Man has one fatal flaw: he does not exist."
So what does he mean by this? Well, for starters, the world is littered with irrational behavior. Some are relatively harmless like making an impulse buy of something you don't need (come on, admit it - we've all been there!), but some are more serious, like engaging in potentially life-changing or -threatening behavior such as heavy drug use or risky sexual activity. And of course, we don't always act in self-interest, for example donating to charity, making decisions such as water conservation that benefit the "greater good," and so forth. (Though it should be stated that some of this behavior can be at least partially driven by selfish consideration because it makes the decision-maker feel good.) There are many more examples, as you will read below. But the question is, how do we include this type of irrational behavior into economic models? In a more general sense, it begs the question: "How can we explain such behaviors?" Enter Behavioral Economics. Some of the principles of Behavioral Economics is described below by Alain Samson in the Behavioral Economics Guide 2015 [550]. (I added the emphasis in bold.)
In last year's BE Guide, I described Behavioral Economics (BE) as the study of cognitive, social, and emotional influences on people's observable economic behavior. BE research uses psychological experimentation to develop theories about human decision making and has identified a range of biases. The field is trying to change the way economists think about people’s perceptions of value and expressed preferences. According to BE, people are not always self-interested, cost-benefit-calculating individuals with stable preferences, and many of our choices are not the result of careful deliberation. Instead, our thinking tends to be subject to insufficient knowledge, feedback, and processing capability, which often involves uncertainty and is affected by the context in which we make decisions. We are unconsciously influenced by readily available information in memory, automatically generated feelings, and salient information in the environment, and we also live in the moment, in that we tend to resist change, be poor predictors of future preferences, be subject to distorted memory, and be affected by physiological and emotional states. Finally, we are social animals with social preferences, such as those expressed in trust, altruism, reciprocity, and fairness, and we have a desire for self-consistency and a regard for social norms
It's worth noting that the 2017 Nobel Prize in Economics was awarded to Richard Thaler, who is considered one of the fathers of Behavioral Economics. Here is an article from The Atlantic ("Richard Thaler Wins the Nobel in Economics for Killing Homo Economicus [551]") that explains some of his theories, if you are so inclined. These theories are starting to hit the mainstream!
Optional Reading
Read the Introduction to the Behavioral Economics Guide 2015 by Dan Ariely. This can be found in the link below, and on Canvas under Lesson 5 in the Modules tab.
- "Introduction: Behavioral Economics: An Exercise in Design and Humility [552]." Dan Ariely.
The Behavioral Economics Guide provides an excellent introduction to this topic, but the following sums it up pretty well (I added the emphases in bold):
- "...if people were simply perfectly rational creatures, life would be wonderful and simple. We would just have to give people the information they need to make good decisions, and they would immediately make the right decisions. People eat too much? Just give them calorie information and all will be well. People don’t save, just give them a retirement calculator and they will start saving at the appropriate rate. People text and drive? Just let them know how dangerous it is. Kids drop out of school; doctors don’t wash their hands before checking their patients. Just explain to the kids why they should stay in school and tell the doctors why they should wash their hands. Sadly, life is not that simple and most of the problems we have in modern life are not due to lack of information, which is why our repeated attempts to improve behavior by providing additional information does little (at best) to make things better.
- There are lots of biases, and lots of ways we make mistakes, but two of the blind spots that surprise me most are the continuous belief in the rationality of people and of the markets. This surprises me particularly because even the people who seem to believe that rationality is a good way to describe individuals, societies and markets, feel very differently when you ask them specific questions about the people and institutions they know very well. On one hand, they can state all kinds of high order beliefs about the rationality of people, corporations, and societies, but then they share very different sentiments about their significant other, their mother-in-law (and I am sure that their significant other and mother-in-law also have crazy stories to share about them), and the organizations they work at. Somehow when we look at a particular example of life up close, the illusion of sensible behavior fades almost instantly. And the more we look at the small details of our own life, the more our bad decisions seem to multiply.
The main thing Ariely is trying to get at here is that people make decisions that are irrational and/or are not good for their own well-being all of the time, and if you ask them they admit it. Yet, modern economic models assume that people always act rationally and in their own self-interest. He provides a lot of examples of this, including texting while driving, overconsumption of alcohol, overindulging in social media, over-eating and more. You may find it enlightening to go through the exercise he provides on p. viii. In it, he asks the reader to indicate how many times (really think about it and put a number behind it) in the past 30 days you've done things such as texting while driving, reading email while driving, mismanaged your time, drank too much, procrastinated, said something inappropriate then regretted it, stayed up too late and did not sleep well, and lied. (I know that I was surprised, okay, horrified when I went through the exercise!) The point is that there are a lot of damaging behaviors that people engage in despite "knowing better." This is indicative of something being amiss in economic models.
The Greenwashing Connection
You may be wondering how this all fits into this week's lesson. Okay, here goes: As it turns out, though the field of Behavioral Economics is only recently gaining steam in academics, and to a lesser extent public policy, advertisers have known about irrational behavior for decades. Though they did not call it Behavioral Economics, they have been using its principles to sell stuff to people. And if you ask the right person, they will openly acknowledge this.
Lucky for you, the good folks at Freakonomics Radio [553] have interviewed such a person, and some others familiar with this topic in a recent show. [Despite the funny-sounding name, Freakonomics Radio delivers a lot of legitimate, insightful commentary on modern economics. It is the brainchild of Dr. Steven D. Levitt [554], William B. Ogden Distinguished Service Professor of Economics at the University of Chicago (how's that for ethos?!) and author, journalist, and TV and radio personality Stephen J. Dubner [554].] In a more general sense, Behavioral Economics provides insight into how people can be influenced to act irrationally, and even against their own interests. The applications go well beyond advertising! I'm looking at you, in particular, politics.
To Read/Listen To Now
When reading or listening to the show below, pay special attention to the terms social norming, loss aversion, positivity, and perception of scarcity. Note this telling quote from one of the key players in this podcast, and who says it: "The problem with economics is that it’s designed for the perfectly rational, perfectly informed person possessed of infinite calculating ability. It isn’t really designed for the human brain as it is currently evolved."
- "The Maddest Men of All [555]," by Stephen J. Dubner, Produced by Christopher Werth. Click on the link and listen to the podcast, or read the full transcript below.
- (Optional) Read the full transcript [556].
Hopefully, next time you are looking at advertisements, listening to politicians, or even just listening to others speak, you will pick up on techniques like social norming, loss aversion, positivity, and perception of scarcity.
One final note: Always keep in mind that the only goal of advertising (other than public service announcements) is to get you to buy things. And it works, otherwise it would not be a multi-billion dollar industry! Do not believe everything you see or hear in ads.
Optional (But Strongly Suggested)
Now that you have completed the content, I suggest going through the Learning Objectives Self-Check list at the top of the page.
Summary and Final Tasks
Summary
That's it for this week! Please make sure you complete the required assignments listed at the beginning of this lesson. This week, we went over the rhetorical strategies of ethos, pathos, and logos, and learned how they can be deployed in speech and writing to persuade an audience. We also went over greenwashing, and some of its associated issues, and learned about lying techniques and principles of behavioral economics. You should be able to do the following after completing the Lesson 5 activities:
- define rhetoric, ethos, pathos, and logos;
- analyze claims made in speech, writing, and imagery through the lens of the rhetorical triangle;
- create rhetorical statements to enhance the persuasiveness of claims made in writing;
- define greenwashing;
- list ways that consumers can overcome greenwashing;
- identify the greenwashing content of advertising claims;
- define lies of commission, lies of omission, and character lies;
- define the term homo economicus; and
- analyze principles of Behavioral Economics.
The Language of Sustainability
We went over a lot of fairly heavy concepts this week. Hopefully, this list will help spark some memories of the content, both now and as we move forward:
- rhetoric, rhetorical strategies, rhetorical devices, persuasion, rhetorical triangle
- inductive reasoning, deductive reasoning, logical fallacy, logical appeal
- greenwashing
- the lie of commission, lie of omission, character lie/lie of influence
- homo economicus, Behavioral Economics, social norming, loss aversion, positivity, the perception of scarcity
Reminder - Complete all of the lesson tasks!
You have finished Lesson 5. Check the list of requirements on the first page of this lesson and the syllabus to make sure you have completed all of the activities listed before the due date. Once you've ensured that you've completed everything, you can begin reviewing Lesson 4 (or take a break!).
Complete all activities in Lesson 5. The quiz may include a variety of question types, such as multiple-choice, multiple select, ordering, matching, true/false and "essay" (in some cases these require independent research and may be quantitative). Be sure to read each question carefully.
Unless specifically instructed otherwise, the answers to all questions come from the material presented in the course lesson. Do NOT go "Googling around" to find an answer. To complete the Activity successfully, you will need to read the lesson, and all required readings, fully and carefully.
Each week, a few questions may involve research beyond the material presented in the course lesson. This "research" requirement will be made clear in the question instructions. Be sure to allow yourself time for this! You will be graded on the correctness and quality of your answers. Make your answers as orderly and clear as possible. Help me understand what you are thinking and include data where relevant.
For any other assignments (e.g., journal or discussion board), it will be helpful to look at the rubric before answering. You will see a button that allows you to view it below the assignment.
These activities are to be done individually and are to represent YOUR OWN WORK. (See Academic Integrity and Research Ethics [221] for a full description of the College's policy related to Academic Integrity and penalties for violation.)
The activities are not timed, but do close at 11:59 pm EST on the due date as shown on the Course Calendar.
If you have questions about the assignment, please post them to the "HAVE A QUESTION?" Discussion Forum. I am happy to provide clarification and guidance to help you understand the material and questions. Of course, it is best to ask early.