As you may recall, the wind is caused by differential solar heating across the surface of the earth (as well as the shape of the earth), which causes large- and small-scale high and low-pressure systems to form. Air moves from areas of higher pressure to areas of lower pressure, which is what causes wind to occur. (If you are interested, this National Geographic site explains some of the finer points of this process, including a lot of pictures.)
Wind, then, is just air that is moving. Simply put, this air has kinetic energy because wind has mass and is moving. (Anything in motion with mass has kinetic energy.) Because of the First Law of Thermodynamics, the energy in the wind must come from somewhere else. This "somewhere else," is solar energy. This energy (and power) can be quantified. See later in this lesson for an explanation of how to calculate this.
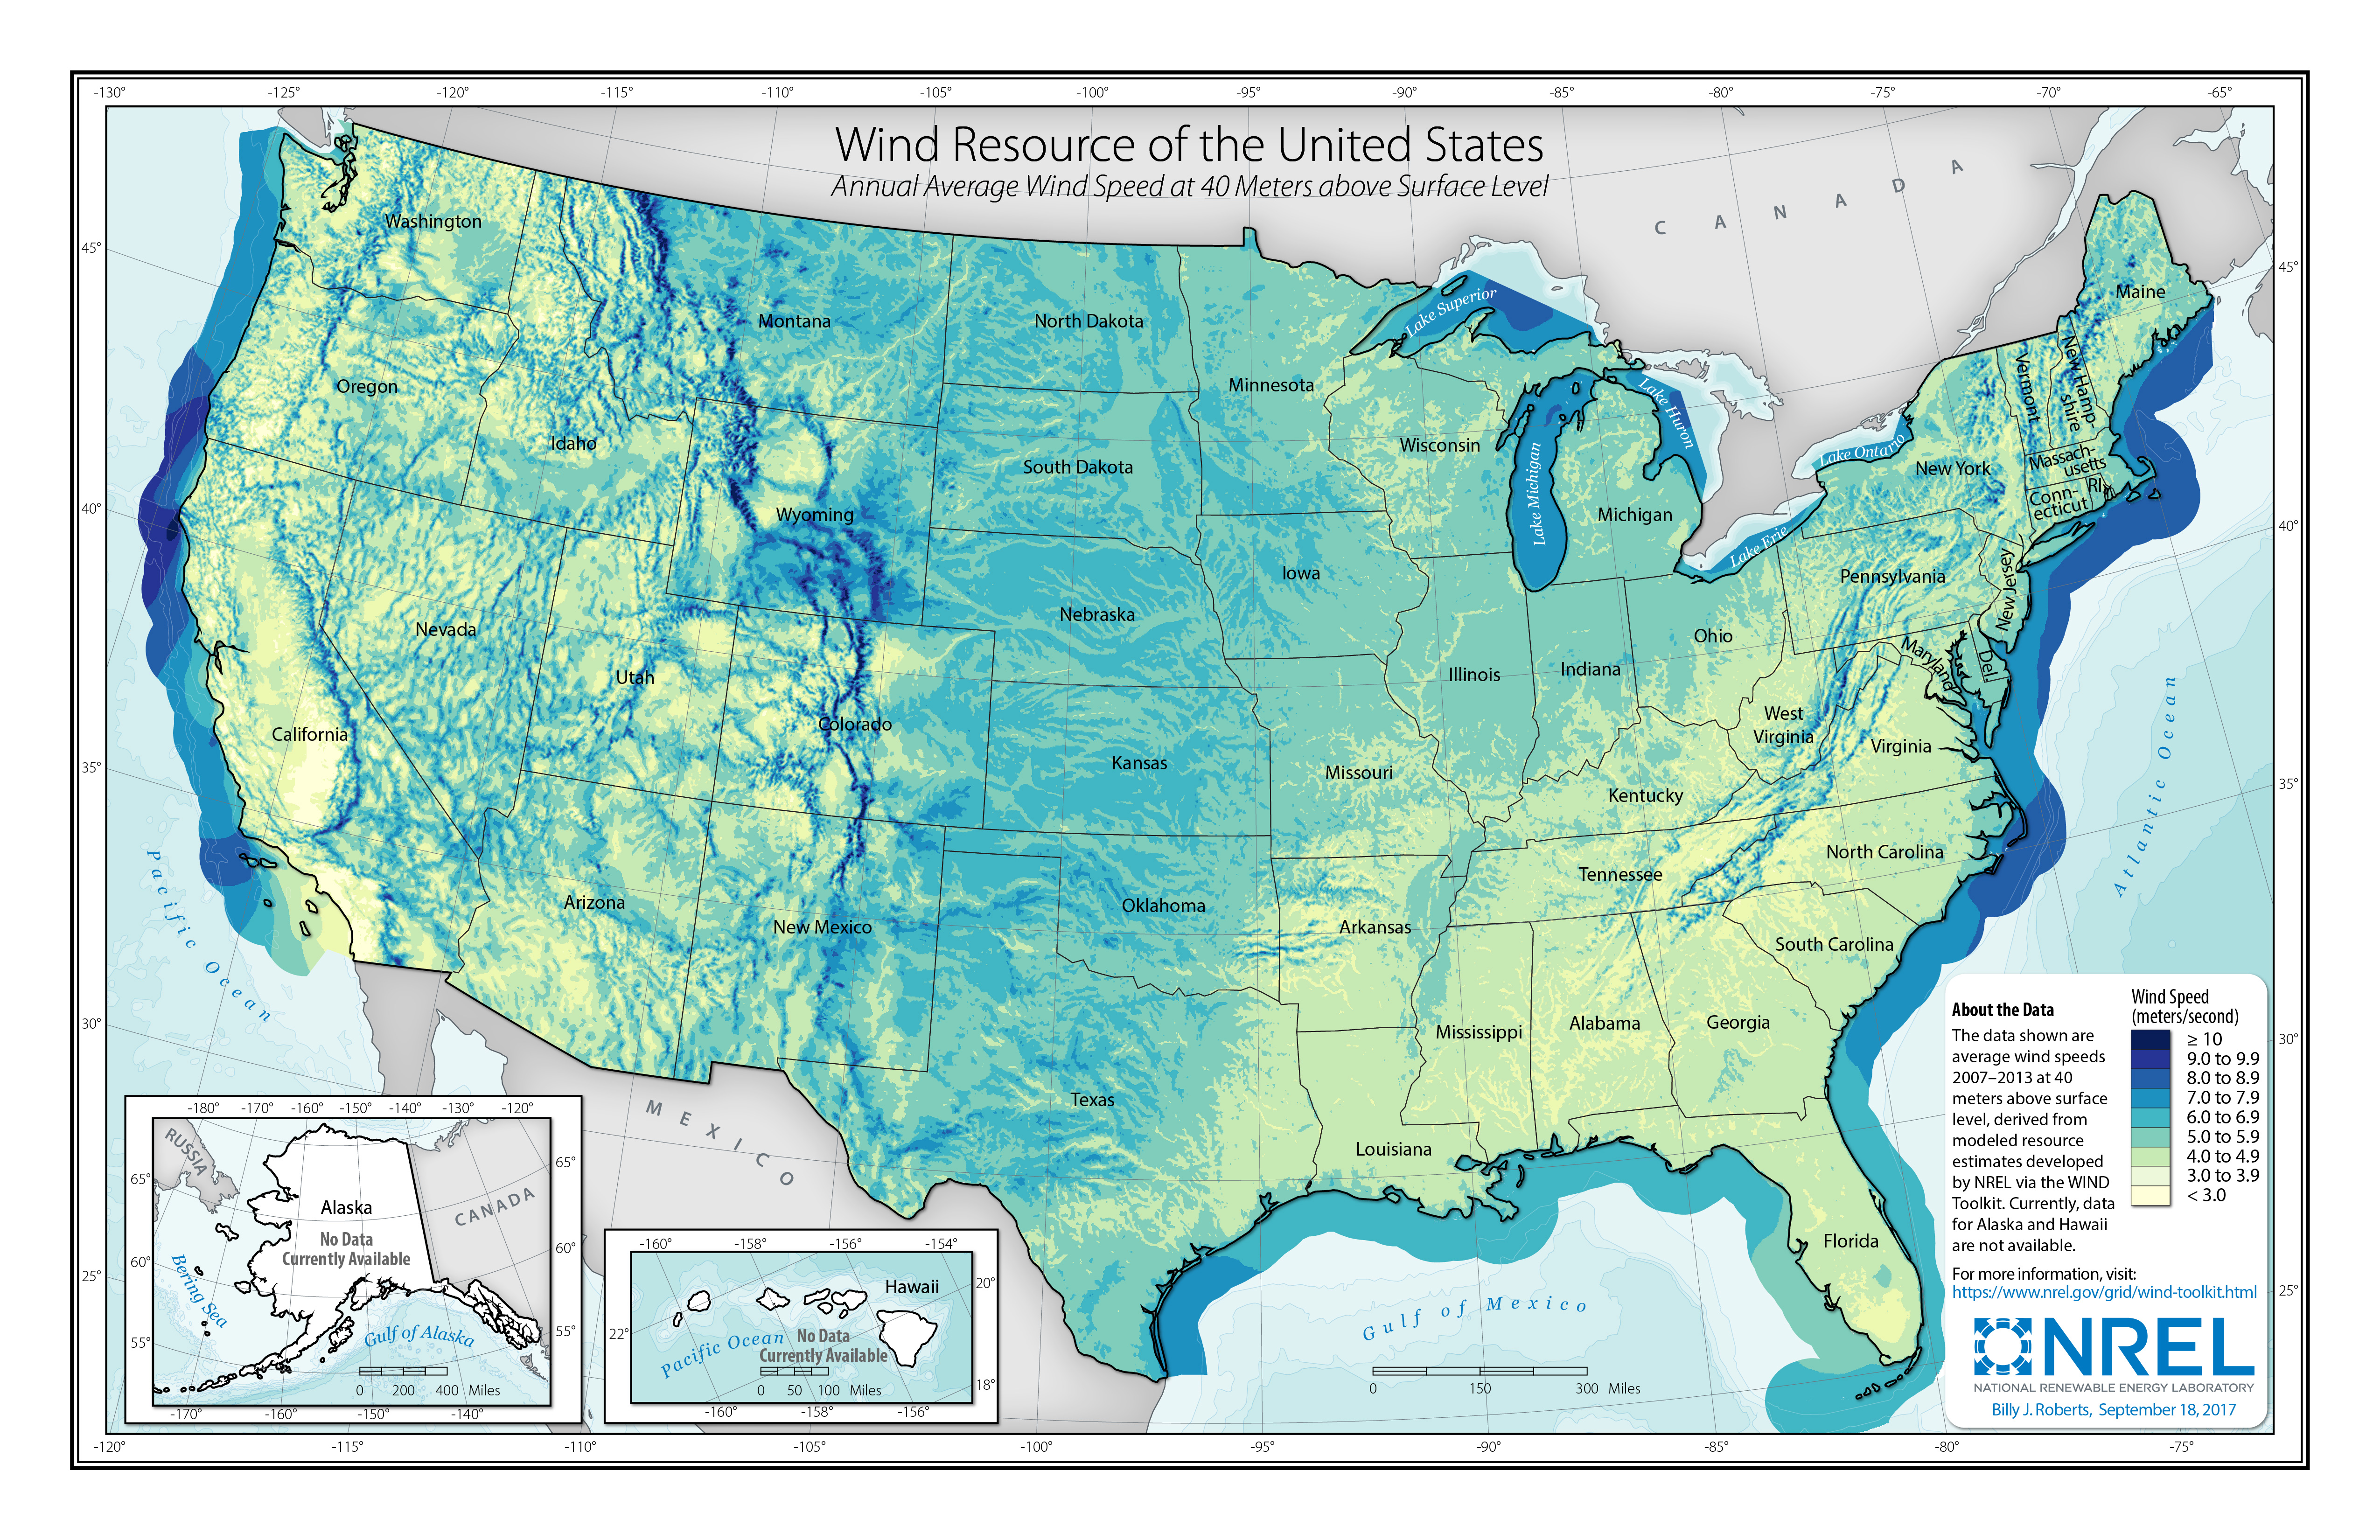
Wind Resources in the U.S.
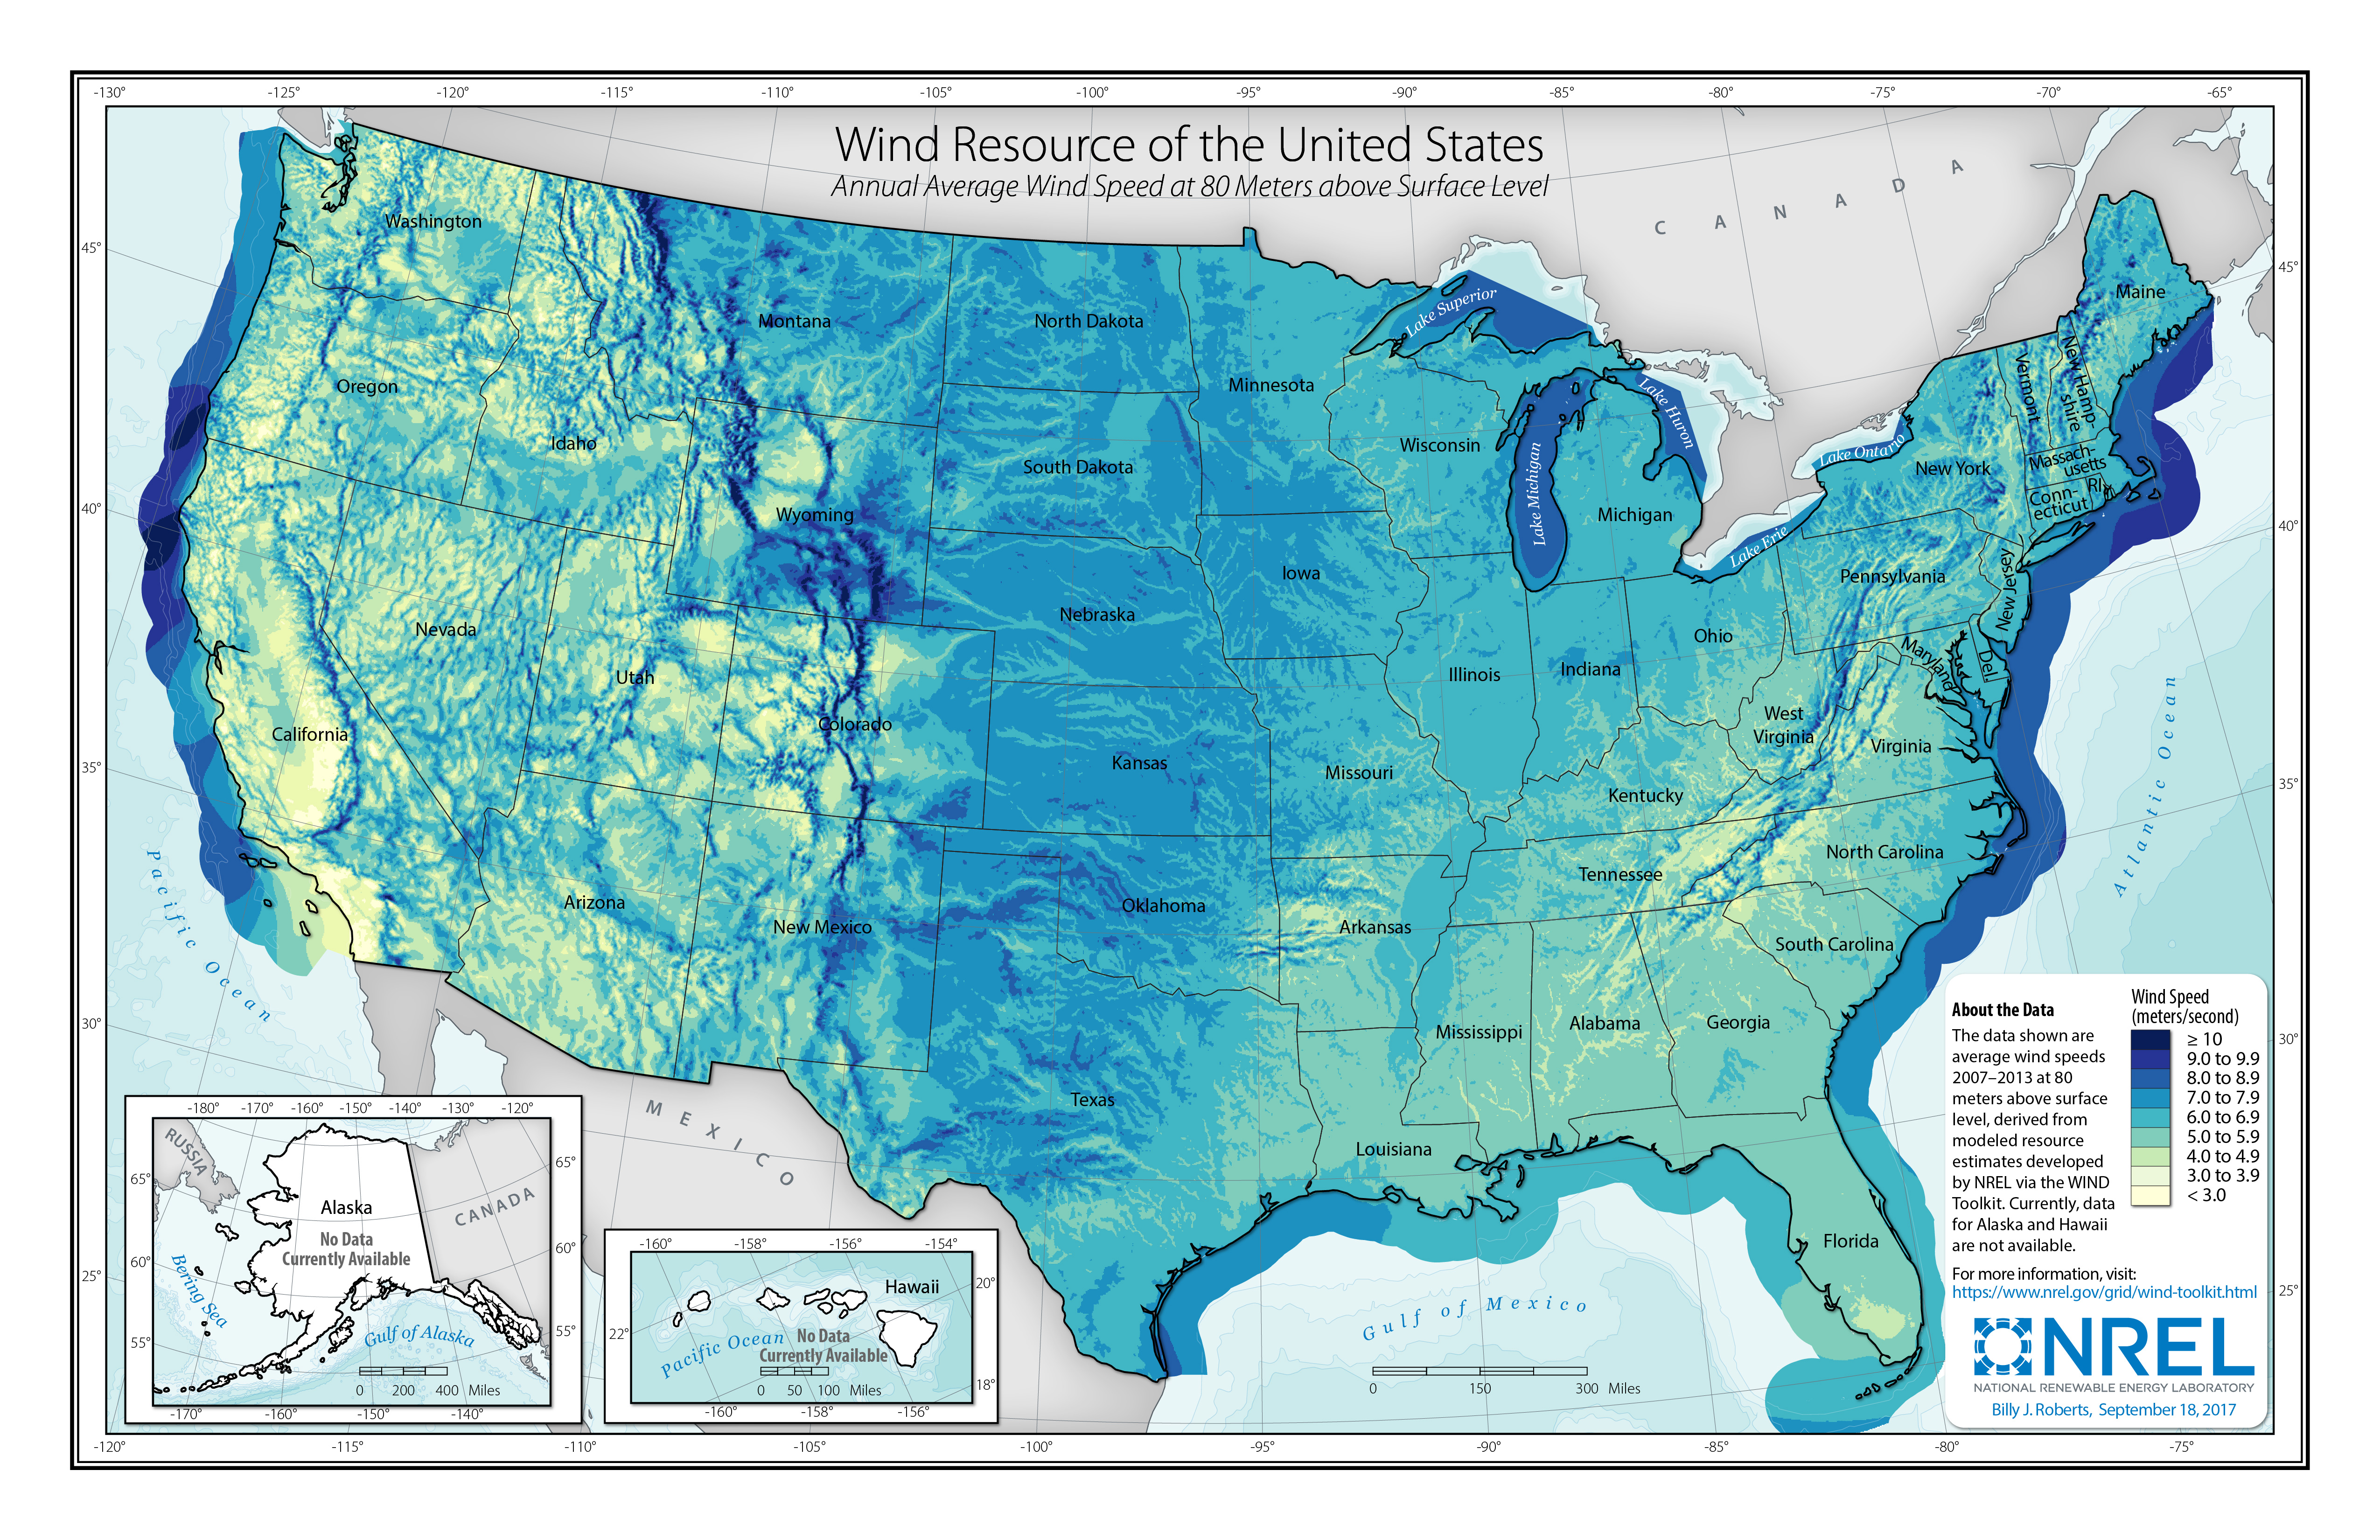
Average wind speeds vary widely by geographical location. Take a few minutes to inspect the wind speed charts from the National Renewable Energy Laboratory below. Note the location of the greatest and smallest wind speeds, and think about the physical characteristics of those areas (e.g., flat, mountainous, on-shore, off-shore, etc.). Click here for a larger version of the 40 m wind speed image and click here for the 80 m image. Note that the average wind speed is higher at 80 m at the same location. Wind speed generally increases with height due to the decreasing influence of friction from the earth's surface and things on it. Modern turbines are generally tall enough to take advantage of 80 m wind speeds.
In addition to variability being a barrier to wind deployment, the location of wind resources is as well. In general - and certainly, in the U.S. - the best onshore wind resources are not located near major population centers. Approximately 50% of the U.S. population lives within 50 miles of the coast, but as you can see in the maps below, this is generally not where the greatest onshore wind is located. This is a problem because transporting electricity over power lines results in energy loss (as heat) due to electrical resistance in wires. The longer the electricity has to travel, the more energy is lost. To minimize this loss, large (and very expensive) power lines must be built. As you can imagine, this type of infrastructure is lacking in areas of the country that do not have large populations.
However, it is clear from the second map that significant offshore wind resources are available very near the coast. Unfortunately, offshore wind is still expensive (remember from a previous lesson that the LCOE is the highest of those listed). That, combined with resistance from local inhabitants had kept the offshore wind at bay until 2016 when the first offshore wind farm (albeit a very small one) in the U.S. was opened in Rhode Island. There are over two dozen in the planning stages as we speak. This is likely an area of growth in the near future.