Lesson 9.4 Risk Management
Life is fraught with hazards. At the moment we are concerned with hazards in the workplace, e.g. the mine or the plant. What do we mean by hazard? A hazard is a situation that presents with a likelihood of adverse consequences. A weak and unsupported roof represents a ground fall hazard, accumulated rock on the walkway next to a conveyor represents a tripping hazard, and a cutting operation in a dimension stone plant represents a respirable dust hazard.
We talk about risk, but what do we mean when we use this term? Risk is a situation involving the chance of loss or injury. On the face of it, there seems to be little difference between the definition of a hazard and a risk. However, there is a subtle but important difference. Risk is taking into account how likely it is that a loss will occur. The weak roof mentioned earlier presents a hazard because it could collapse, and if someone is underneath that spot when the fall occurs, something bad will happen to that person. Whether or not this represents a risk depends on whether or not a collapse is likely to affect anyone. If it is in a remote area of the mine where no one works or travels, the risk is minimal. If it is in the main travel way into the mine, the risk is huge.
It is useful to talk about risk factors as part of this discussion as well. Risk factors are conditions or behaviors that increase the chance of loss or injury. As an example, consider accidents involving surface haul trucks. What are some of the risk factors that could individually or in combination increase the likelihood of an accident? Poor visibility (night time or foggy conditions), deterioration of the berms, operator impairment (drugs or alcohol), operator fatigue, equipment malfunction, and so on. The value of identifying the risk factors will become apparent shortly.
Risk is an inevitable part of our lives at work and play. The challenge is to reduce the likelihood that a risk will lead to a loss or injury, and we meet this challenge by managing the risks. Risk management first requires that we identify the risks. Then if practicable, we work to eliminate them, and failing that we endeavor to mitigate the risks. Elimination while most desirable is often not possible. Think about the risk associated with crossing a busy street. We can’t eliminate the traffic, but if we could build a pedestrian bridge over the street we would effectively eliminate the hazard posed by the traffic. Unfortunately, there are few instances where building such a bridge is practicable. Thus, we will need to mitigate the risk. We might do this using engineering controls such as putting in a traffic light with a pedestrian signal. We might also use a behavioral intervention, where we train everyone who will cross a street to look both ways before stepping off the curb, or we might also employ an administrative control where we have a policy that no one is allowed to cross the street except at intersections. These actions 6 to mitigate the risk will significantly reduce the likelihood of a pedestrian being killed while crossing the busy street. Despite our best efforts, however, a small amount of risk still exists. Indeed, this is the norm, and we ultimately accept some level of risk in our lives whether it is flying in an airplane, investing in the stock market, or eating too many sweets. The challenge is to know when we have reduced the risk as low as reasonably achievable.
The process of identifying risks, risk factors, and the options for mitigating the risk need not be performed in an ad hoc or casual manner. There are many well developed methods for analyzing risk, and each has its advantages depending on the application. There are two simple but powerful tools for analyzing mining risks.
The first is the so-called risk assessment matrix, and it is based on the principle that risk is a function of the probability of occurrence and the severity of the consequence if the event occurs. You can think of it as risk being equal to the product of this probability and consequence metrics. However, to be clear, for mining applications this is a qualitative assessment because we generally do not have quantitative knowledge of either the probability of occurrence or the severity of the consequence. Generally, we do have a qualitative understanding, and that makes this assessment matrix very useful to prioritize our risk management activities. Let’s take a look at Figure 9.4.1.
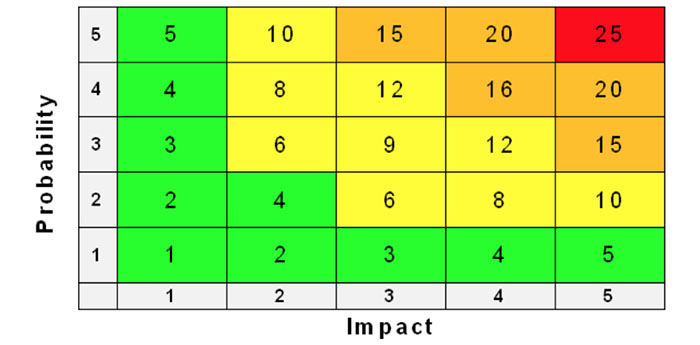
The rows are a measure of probability of occurrence and the columns represent the impact or severity of the consequence. The likelihood of occurrence begins with a “1” at the bottom row and increases to a “5” at the top row, in which the probability of the event occurring increases as we move from the bottom to the top row. Similarly, the impact of the occurrence begins with a “1”, representing the least impact, at the left-most column and ends with a “5” designating the greatest impact at the far-right column. The numbers in the cells represent the risk as the product of probability and impact. The larger the number, the more serious the risk. In this figure the colors have been added to underscore the severity of the risk with green representing minimal risk and red representing extreme risk.
You are probably wondering, how to assign the probability and impact score to a specific event. In most cases, we use a qualitative scale. As long as we are consistent in using the same scale, we can compare and assess the many risks that might be present at our mine. As an example, we might standardize on the follow scale of 1 to 5, where 1 represents the lowest level of probability or impact, and 5 represents the highest level:
| Probability | Impact | |
|---|---|---|
| 1 | very unlikely to ever happen | no injury or insignificant operational cost |
| 2 | unlikely, but such events have occurred | minor injuries or minor operational costs |
| 3 | likely, not common by does occur | significant injuries, operation costs |
| 4 | likely, these have occurred here | severe injury, likely fatality, significant costs |
| 5 | highly likely, they occur from time-to-time | multiple fatalities, major operational costs |
Another very useful tool for mining risk management is bowtie analysis (BTA). This tool combines in one diagram causes and consequences as well as control and recovery measures. A bowtie is illustrated in Figure 9.4.2. The center of the bowtie represents the event, e.g. haul truck accident, a mine explosion, or a conveyor belt fire. The potential causes of the event are placed on the left side of the bowtie, and the consequences of the event are placed on the right side. Dashed lines connect the causes with the event and the consequences with the event as shown.
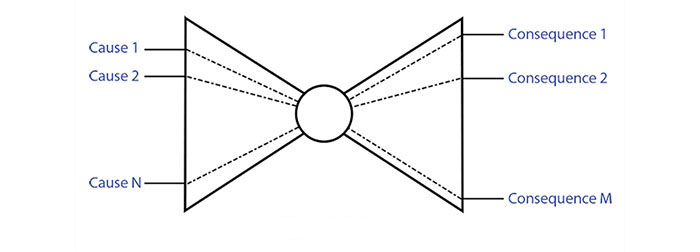
On the left half of the bowtie we will place “barriers” along the dashed lines. These barriers represent actions that we can take to prevent the cause from leading to the event. On the right half of the bow we will again place “barriers” along the dashed lines. These barriers represent actions that we can take to lessen the impact of the event or even to prevent certain consequences from occurring.
Let’s look at an example, and for this example, let’s choose a mine explosion as the event of interest, and we’ll keep it simple to illustrate the concept. First, let’s identify causes that lead up to a mine explosion, and similarly, let’s identify the consequences of the event, i.e. the mine explosion.
Causes of this event are:
- Explosive concentration of methane
- Ignition source
The consequences of an explosion are:
- Miners die from breathing toxic levels of carbon monoxide
- Fire
- Miners in immediate proximity to the explosion are killed by the force of the explosion
- Miners die while attempting to escape from the mine
Next, we’ll want to identify control and recovery measures. A control measure for preventing an explosive concentration of methane is adequate ventilation. A control measure to prevent an ignition source is to use only electrical equipment that is certified as permissible for use in explosive environments. Another control is to equip the machines with methane monitors, which will cause them to shut off if elevated levels of methane are detected.
Providing self-contained self-rescuers (SCSRs) is a recovery measure that virtually eliminates the outcome of dying from CO poisoning. Miners in the immediate vicinity of an explosion will be killed by the air pressure blast, and there are no known controls to change this outcome. Providing quarterly training to miners on self-escape will improve their chances of safety exiting the mine. If they have access to functioning wireless communications equipment to allow communication with the outside world, their chances of safely exiting the mine are improved.
Certainly, we can identify additional root causes, outcomes, control measures, and recovery measures. However, the ones that we have chosen to list here illustrate the technique. The bowtie shown in Figure 9.4.3 is populated with this information that we identified.
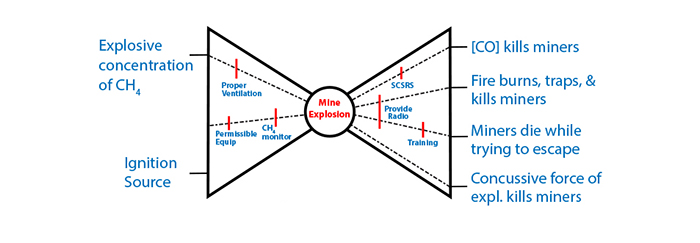
As you look at this bowtie, and the lists that we just made, you may be wondering what useful purpose is served by completing the drawing of the bowtie, rather than working from the lists. In relatively simple and straightforward cases like the one we completed for this example, the only purpose served is a graphic for others to examine and discuss. In more complicated cases, and cases in which all controls or recovery measures are not yet identified, the diagram does serve as a useful tool to facilitate the process. This is especially true if there are interactions between certain controls or recovery measures that need to be identified and taken into account. A more general representation of the bowtie is shown in Figure 9.4.4.
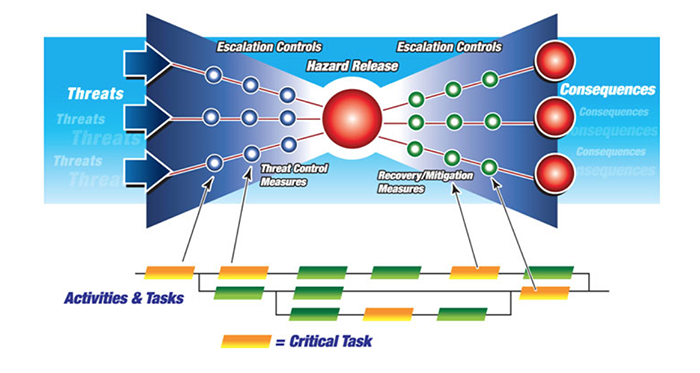
I’ve deliberately used different terms on this bowtie from those I used in my example. Many of these words are used interchangeably, and it is good to be aware of this. Threats and causes are substantially the same, as are consequences and outcomes. The hazard release is the event. The control measures and recovery measures represented on this figure are similar to the nomenclature that I used earlier. No doubt you noticed the addition of a critical path diagram at the bottom of the bowtie. This is not an essential part of bowtie analysis, but its addition to the graphic is a powerful complement to bowtie analysis and this further enhances the planning stage of risk management.
As I mentioned earlier, there are a couple dozen different tools available to do a risk analysis, but only a few lend themselves to the qualitative scenarios encountered in the majority of mining applications. In addition to the risk assessment matrix and bowtie analysis, job hazard analysis (JHA) and workplace risk assessment and control (WRAC) are commonly employed. JHA is particularly useful for studying specific jobs or tasks such as operating a haul truck or changing the bits on a cutting drum. WRAC is a useful tool to conduct a preliminary assessment of risk, but many who do this prefer to use bowtie analysis instead.
6The hierarchy of controls, going from the most to least reliable and effective is: engineering controls, administrative controls, and the use of personal protective equipment (PPE). PPE was not used in this example because it wasn't applicable. Examples of PPE would include respirators to limit dust exposure, earplugs to limit noise exposure, and safety glasses to reduce the chance of eye injury from foreign objects. Simplistically, the effectiveness of engineering controls at the top of hierarchy do not depend on people to mitigate the risk, whereas the bottom of the hierarchy, PPE, will be effective only if people remember to use it and use it correctly.