Strategies used to represent terrain surfaces can be used for other kinds of surfaces as well. For example, one of my first projects here at Penn State was to work with a distinguished geographer, the late Peter Gould, who was studying the diffusion of the Acquired Immune Deficiency Syndrome (AIDS) virus in the United States. Dr. Gould had recently published the map below.
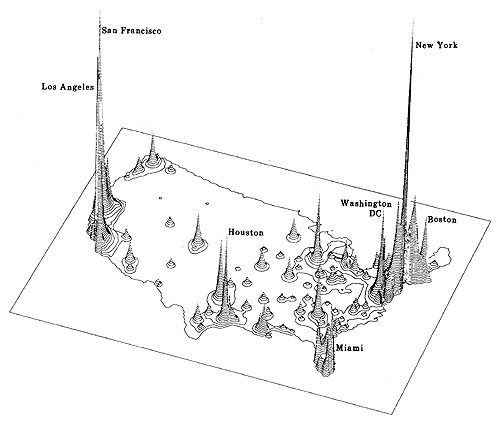
Oblique view of contour lines representing distribution of AIDS cases in the U.S. 1988. (Gould, 1989. © Association of American Geographers. All rights reserved. Reproduced here for educational purposes only).
Gould portrayed the distribution of disease in the same manner as another geographer might portray a terrain surface. The portrayal is faithful to Gould's conception of the contagion as a continuous phenomenon. It was important to Gould that people understood that there was no location that did not have the potential to be visited by the epidemic. For both the AIDS surface and a terrain surface, a quantitative attribute (z) exists for every location (x,y). In general, when a continuous phenomenon is conceived as being analogous to the terrain surface, the conception is called a statistical surface.