Energy
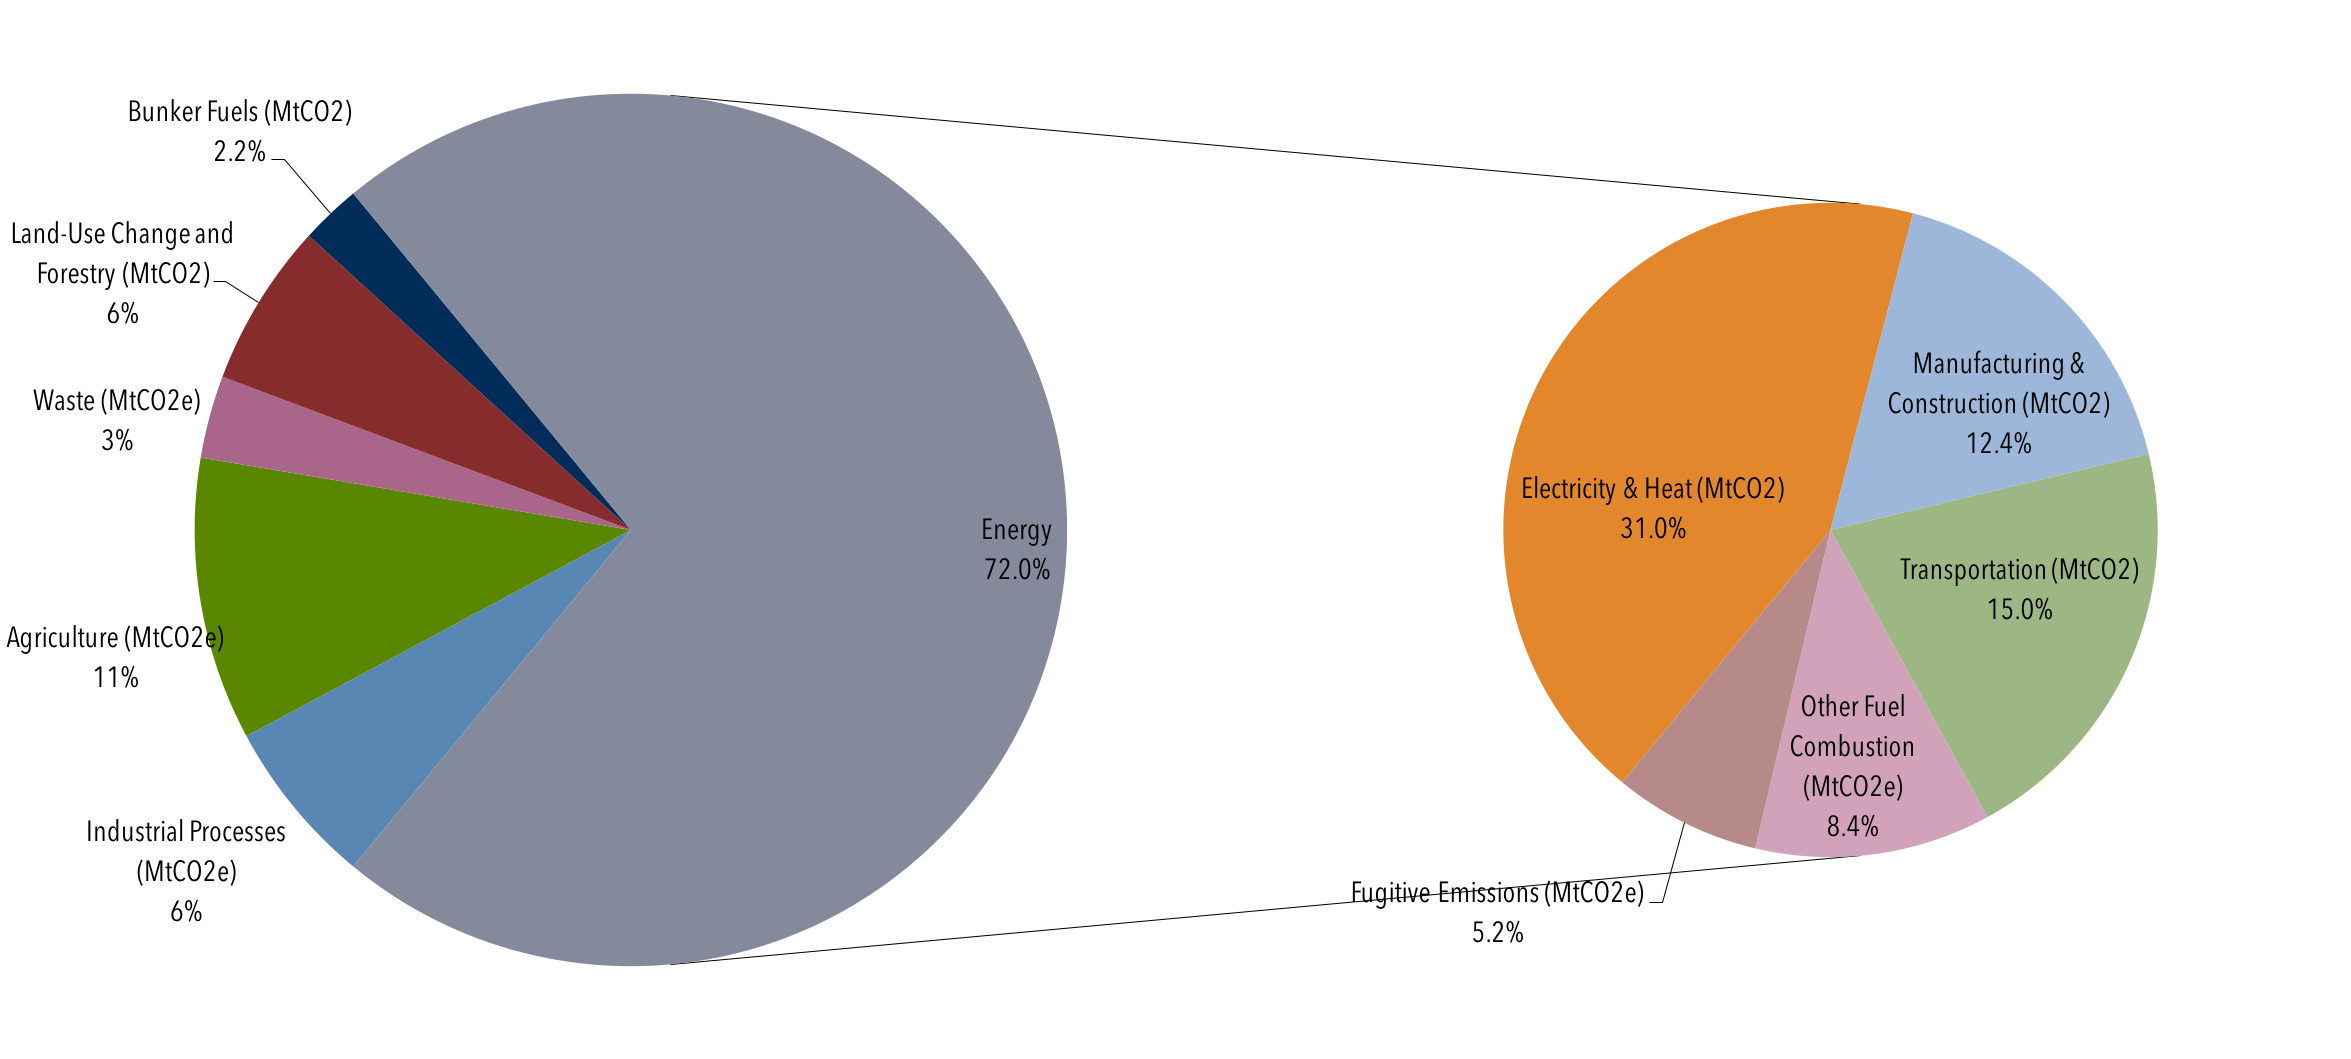
To understand emissions sources, it's useful to categorize those emissions. One such way to do that is by sector. This lesson is going to look specifically at Energy, which is the biggest source of anthropogenic GHG emissions (by far!). More specifically, we are going to break down energy into a few subcategories: power generation, transportation, and industrial processes, as shown below. This lesson, we'll be focusing on the subset of that big almost-the-whole-piece-of-the-pie energy sector.
| Sector | Percentage |
|---|---|
| Energy | 72% |
| Agriculture (MtCO2e) | 11% |
| Industrial (MtCO2e) | 6% |
| Land Use Change and Forestry (MtCO2e) | 6% |
| Waste (MtCO2e) | 3% |
| Bunker Fuels(MtCO2e) | 2.2% |
| Source | Percentage |
|---|---|
| Electric and Heat (MtCO2e) | 31.0% |
| Transportation (MtCO2e) | 15% |
| Manufacturing and Construction (MtCO2e) | 12.4% |
| Other Fuel Combustion (MtCO2e) | 8.4% |
| Fugitive Emissions (MtCO2e) | 5.2% |
Energy use and consumption produce more GHG emissions than any other realm of human endeavor. A brief look at the socioeconomic drivers of energy use and consumption helps explain some of the reasons why. Current technologies for generating energy focus on GHG-intensive fossil fuels; the economic system favors producing the greatest amount of energy at the lowest cost and does not account for the environmental costs of energy production; political and legal institutions promote and protect fossil-fuel industries and typically fail to foster alternative energy sources adequately, and Western lifestyles are energy-intensive but many non-Westerners aspire to a Western lifestyle. Add to that the exponential growth of Earth’s human population and it is no wonder that GHG emissions continue to grow rapidly.
Introduction to the Energy Sector and Its Greenhouse Gas Emissions
Global GHG emissions from energy use and production far outweigh emissions from other activities. The industrial processes, agriculture, land-use change and forestry, and waste management sectors together account for 37 percent of all global GHG emissions in the accompanying pie chart. However, a significant proportion of the emissions from agriculture and from land-use change and forestry involve fossil fuel consumption, so the percentage of emissions from energy is greater than the graphic implies. Consequently, far more than two thirds of all GHG emissions result from energy use and production.
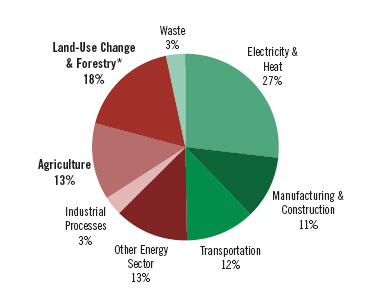
This is a pie chart showing the percent of GHG emission from various activities. Below it is represented as a table.
| Source of GHG Emission | Percent of total |
|---|---|
| Electricity and Heat | 27% |
| Manufacturing and Construction | 11% |
| Transportation | 12% |
| Other Energy Sector | 13% |
| Industrial Processes | 3% |
| Agriculture | 13% |
| Land-Use Change and Forestry | 18% |
| Waste | 3% |
In the pie chart, electricity and heat production is clearly the largest emitter of GHGs, being responsible for over one quarter of total emissions. Most of these emissions are attributable to society’s dependence on coal and secondarily on natural gas. The remaining energy categories –– manufacturing and construction, transportation, and “other” –– each contribute approximately equal proportions of the global GHG emissions.
Going beyond this particular graphic, when compiling the national GHG emissions inventory, the US breaks its energy sector emissions into three broad categories: mobile sources, stationary sources, and fugitive sources.
The stationary sources category is large and includes many activities.
- Most prominent in terms of GHG emissions is the electricity and heat generation subsector, mentioned above.
- Most of these emissions come from coal-fired power plants that generate electricity, heat, or both (through co-generation). Increasingly, because supplies are becoming cheaper and more plentiful, natural gas is replacing some of the generation capacity provided by coal, thereby reducing GHG emissions when there is a direct substitution of natural gas for coal.
- Power generation from natural gas emits about one half the emissions of coal, but is nevertheless still a potent source of GHGs.
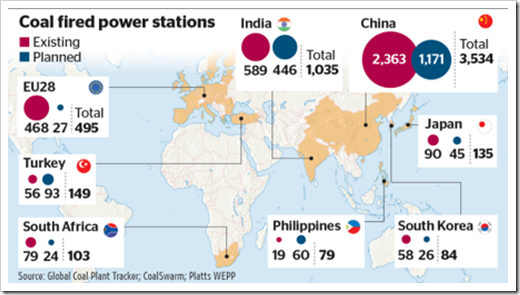
- Moreover, developing countries such as China and India are building huge numbers of coal-fired power plants and –– although the newer ones use more advanced technologies that emit about one third fewer GHGs than old technologies –– are adding vast quantities of GHGs to the atmosphere.
| Country | Existing | Planned | Total |
|---|---|---|---|
| EU28 | 468 | 27 | 495 |
| Turkey | 56 | 93 | 149 |
| South Africa | 79 | 24 | 103 |
| Philippines | 19 | 60 | 79 |
| South Korea | 58 | 26 | 84 |
| Japan | 90 | 45 | 135 |
| India | 589 | 446 | 1035 |
| China | 2363 | 1171 | 3534 |
There are many other important categories of GHG-producing activities:
- manufacturing and construction together are the second-largest emitters among the stationary sources behind electricity generation;
- mining (excluding coal mining) and the fossil fuel industries (including coal mining, petroleum and natural gas extraction, and fuel processing) are also major emitters;
- as noted earlier, agriculture and forestry consume fossil fuels;
- stationary sources involve food-processing and forest product-processing facilities, for instance;
- compared to the other stationary sources, commercial (e.g., corporate buildings, small businesses), institutional (e.g., government buildings, universities, prisons), and residential energy sources produce relatively modest quantities of GHGs through direct consumption of fossil fuels.
Even so, these enterprises consume huge amounts of electricity, and most of this electricity comes from fossil fuel-powered power plants, so these categories are indirectly responsible for a very large proportion of GHG emissions.
In addition to transportation and stationary sources, fugitive CH4 emissions from coalmines and from oil and natural gas drilling sites, as well as from natural gas pipelines, were thought to be a relatively small source of GHG emissions. Recent work, however, suggests that fugitive emissions may in fact be a major source of atmospheric CH4, so this part of the energy sector is coming under increased, intense scrutiny.
- Explained: Fugitive methane emissions from natural gas production [4](Carbon Brief, 2014) gives a nice overview of some of the more recent studies that have tried to answer this question.
- A close look at fugitive methane emissions from natural gas [5] (Bradbury and Obeiter, 2013) also gives a nice brief summary of the context of the problem and ways of trying to quantify its severity.
The relationships among energy production, energy storage and distribution, energy marketing, and energy demand and consumption are extremely complex. Thus, trying to pin GHG emissions to any one component in this complex web is arbitrary. Indeed, calculating emissions from the energy sector is fraught with error because of this complexity. It is best to think not in terms of exact proportions of GHG emissions from any one activity or subsector, but in terms of which categories are the big players.
Global Energy Demand and Consumption
The world consumes massive quantities of energy, with much of that energy embodied by GHG-emitting fossil fuels.[1] This image shows primary energy consumption by world region in 2015. Together, China and the United States represent 40% of global energy consumption. This is why our cooperation to solve climate change-related challenges is so pivotal.
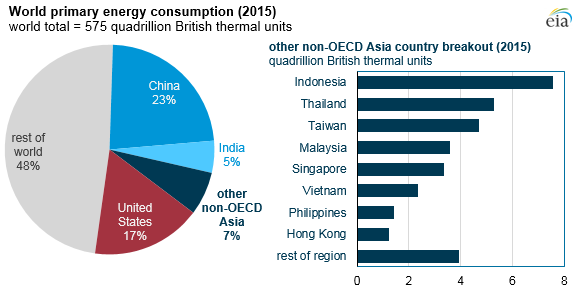
| United States | 17% |
|---|---|
| Other non-OECD Asia | 7% |
| India | 5% |
| China | 23% |
| Rest of the World | 48% |
| Country | Quadrillion British THermal Units |
|---|---|
| Indonesia | 7.5 |
| Thailand | 5.5 |
| Taiwan | 5 |
| Malaysia | 3.7 |
| Singapore | 3.5 |
| Vietnam | 2.5 |
| Philippines | 1.26 |
| Hong Kong | 1.2 |
| Rest of the Region | 4 |
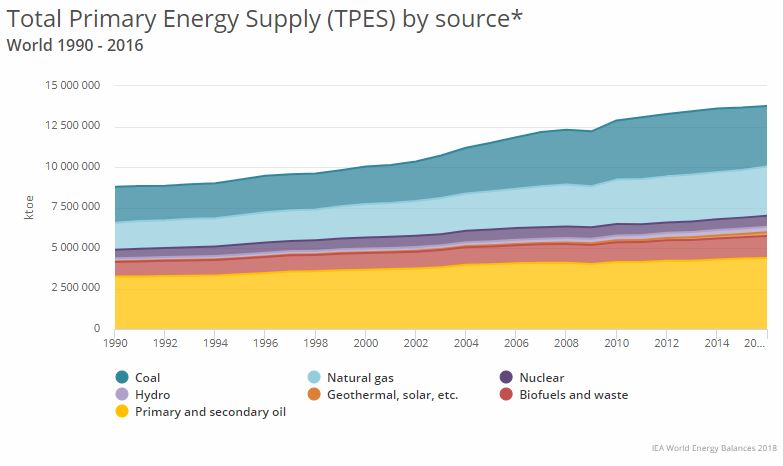
The next image shows a graph of global consumption by fuel type for 1990-2016. Overall consumption has almost doubled in this time period (and has more than doubled if we went back 40 years). The three fossil fuels (oil, coal, and natural gas) dominate, encompassing between 80 to 90 percent of energy consumption throughout the period. Oil provides the largest proportion of energy, but proportionally has lost ground to coal and especially natural gas (why might that be?). Coal has had an upsurge in the 21st century, especially after 2005, and may become the leading fossil fuel in the future as oil supplies drop and demand for energy increases in places such as China and India, with massive coal reserves but little oil and natural gas. Biomass and hydroelectric power grew a little. Other renewables are a trivial proportion of the global energy picture. Clearly, the grip of the GHG-producing fossil fuels on the world energy picture is strong.
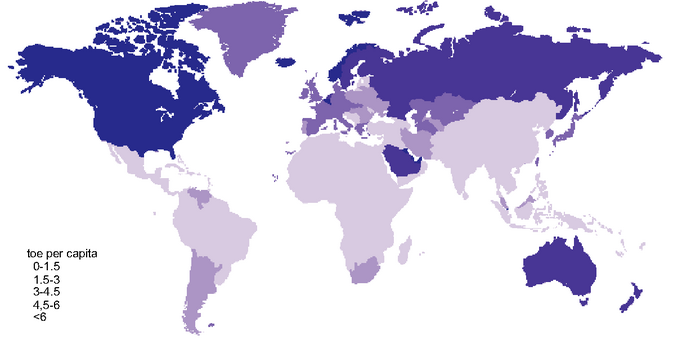
The next image shows a map of per capita energy consumption across the globe. An obvious general pattern emerges: low-latitude countries have very low per capita consumption –– and therefore low per capita GHG emissions –– while mid- to high-latitude countries have high per capita consumption and emissions. (Exceptions exist. For example, Saudi Arabia has anomalously high per capita energy consumption compared to surrounding countries because it is a wealthy, oil-rich country with a low population.) On the one hand, the pattern suggests that low-latitude countries with very low per capita energy consumption and very high populations such as China, India, and Indonesia, will become significant sources of GHGs as their per capita consumption figures rise. Indeed, China, which has the world’s largest population, has rapidly rising per capita energy consumption. Combined with its focus on coal as its primary energy source, China is now the world’s largest emitter of GHGs. India is hot on China’s heels, with a rapidly expanding coal-based economy. On the other hand, the pattern also suggests global inequities because the mid- to high-latitude countries have such very high per capita energy consumption figures. Opportunities exist for these countries to reduce per capita consumption by undertaking energy efficiency measures, adopting non-GHG-producing energy types, and modifying their energy-intensive lifestyles. This contrast between the low latitudes (the global South) and the mid- to high latitudes (the global North) is at the heart of the ongoing United Nations climate negotiations.
[1] Most of the remainder of this lesson is based on figures presented in Sims, et al., 2007. Energy supply. In: Climate Change 2007: Mitigation. Contribution of Working Group III to the Fourth Assessment Report of the Intergovernmental Panel on Climate Change [B. Metz, et al. (eds)], Cambridge University Press.
Greenhouse Gas Emissions from the Energy Sector
The next image shows CO2 emissions from fossil fuel combustion by country. In 2015, China's share was 28 percent of the world’s CO2, while the US share was 15 percent. The next closest country, India, emitted about 6 percent of the CO2. Clearly, to bring down global emissions from the energy sector, China and the US must lead the way.
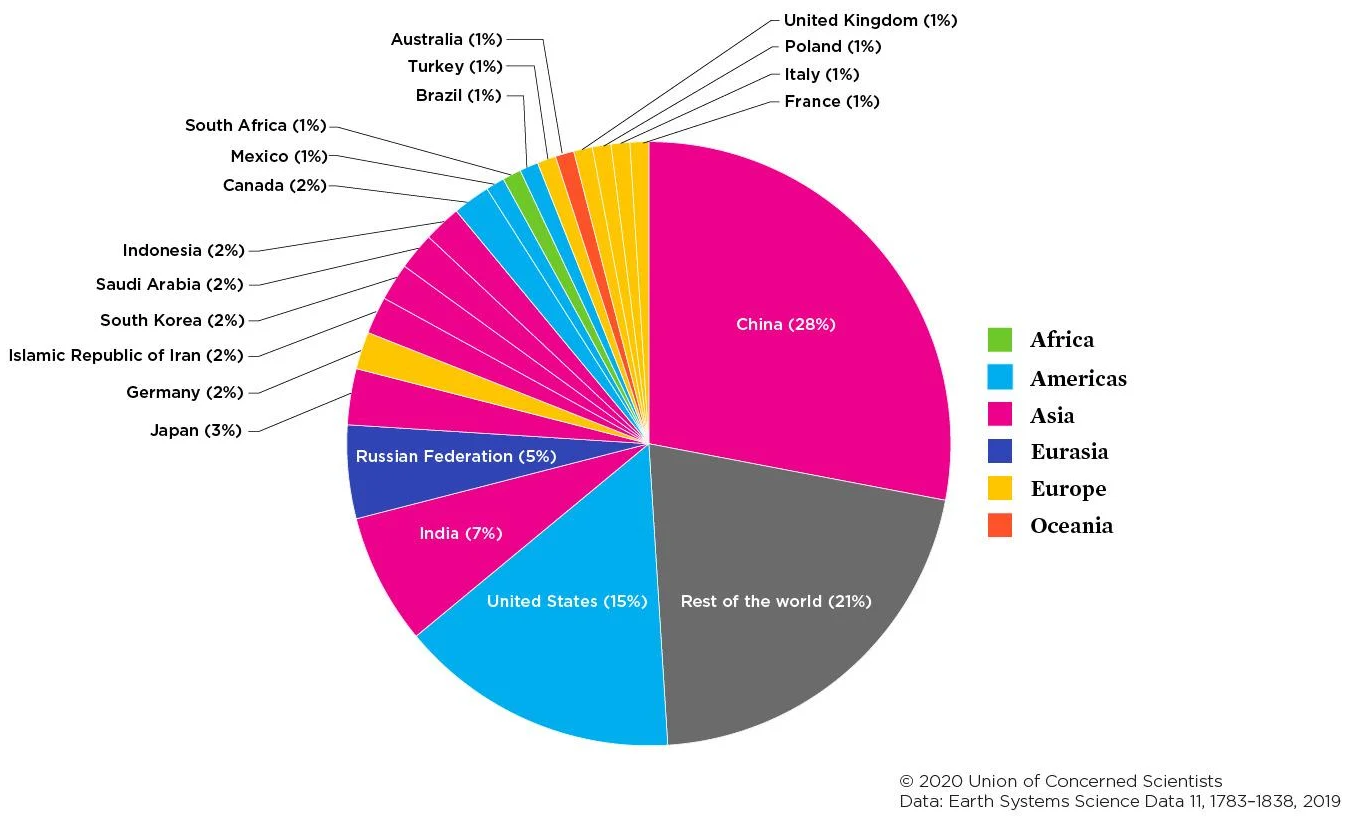
| Country | Percentage |
|---|---|
| China | 28% |
| USA | 15% |
| India | 7% |
| Russian Federation | 5% |
| Japan | 3% |
| Germany | 2% |
| South Korea | 2% |
| Iran | 2% |
| Canada | 2% |
| Saudi Arabia | 2% |
| Rest of the World | 30% |
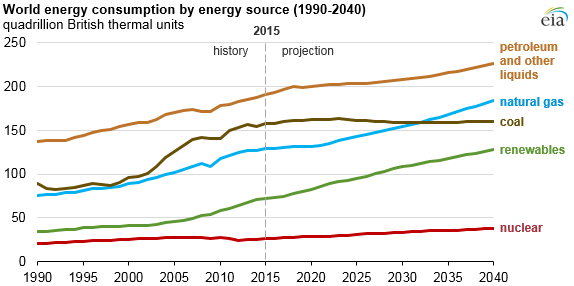
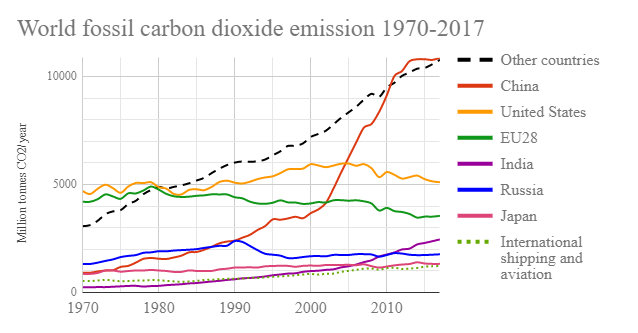
The next image is a graph depicting fossil fuel-based CO2 emissions for the US, China, several other key emitters, and the aggregate rest of the world between 1970-2017. What jumps out at you?
- China’s emissions rose sharply after the turn of the century, while the U.S. emissions started to flatten out and drop at the end of that same period. These trends have continued. It is important to note that estimates (Liu et al., 2013. Block, n.d.) attribute one-third of China’s emissions to their exports and 20 percent of those exports come to the U.S. Thus, this fact implies that U.S. CO2 emissions should be higher and China’s emissions lower. In any case, both nations dominate global carbon dioxide emissions.
The next image displays the GHG emissions from the various systems used to generate electricity. Clearly, coal and its close cousin lignite produce the most GHG per unit of energy produced. Fuel oil is the next most GHG-intensive generation system. Natural gas, which is often touted as the clean alternative to coal, certainly emits about half as many GHGs per unit of energy but is still extremely GHG-intensive compared to non-fossil fuel alternatives. Renewables and nuclear produce trivial quantities of GHGs compared to the three fossil fuel types –– coal, oil, and natural gas.
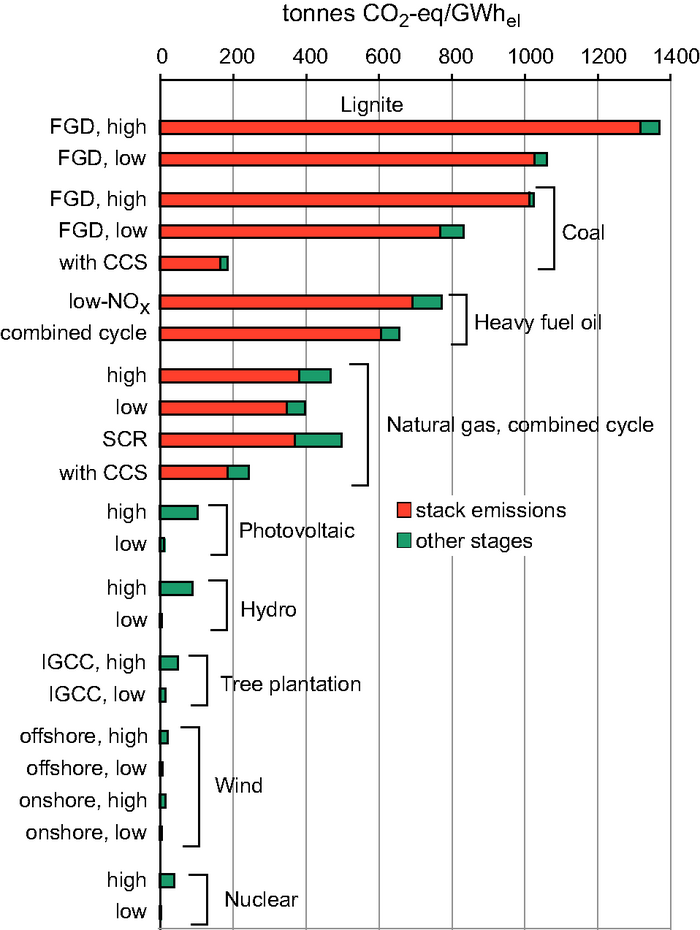
| Electricity Generation System | Stack Emissions (tonnes CO2-eq/GWhel) |
Other stages |
|---|---|---|
| Lignite (FGD, high) | 1300 | 1300-1350 |
| Lignite (FGD, low) | 1025 | 1025-1050 |
| Coal (FGD, high) | 1020 | 1020-1025 |
| Coal (FGD, low) | 750 | 750-825 |
| Coal (with CCS) | 150 | 150-175 |
| Heavy fuel oil (low-NOx) | 700 | 700-775 |
| Heavy fuel oil (combined cycle) | 600 | 600-650 |
| Natural Gas, combined cycle (high) | 375 | 375-500 |
| Natural Gas, combined cycle (low) | 350 | 350-400 |
| Natural Gas, combined cycle (SCR) | 375 | 375-500 |
| Natural Gas, combined cycle (with CCS) | 175 | 175-250 |
| Photovoltaic (high) | - | 125 |
| Photovoltaic (low) | - | 25 |
| Hydro (high) | - | 100 |
| Hydro (low) | - | 5 |
| Tree plantation (IGCC, high) | - | 50 |
| Tree plantation (IGCC, low) | - | 20 |
| Wind (offshore, high) | - | 25 |
| Wind (offshore, low) | - | 5 |
| Wind (onshore, high) | - | 20 |
| Wind (onshore, low) | - | 5 |
| Nuclear (high) | - | 50 |
| Nuclear (low) | - | 0 |
The final graphic in this section illustrates the fact that CO2 emissions go down as efficiency in burning fossil fuel in power generation goes up. For coal, new technologies improve efficiencies and reduce emissions –– but they are still exceptionally high compared to the alternatives. New natural gas power generation is about half as CO2-intensive as the best single-purpose coal-fired power plant. Cogeneration (also known as CHP, combined heat and power) is dual-purpose and drastically improves the efficiency of any fossil fuel power generating system, halving the efficiency of single-purpose systems.
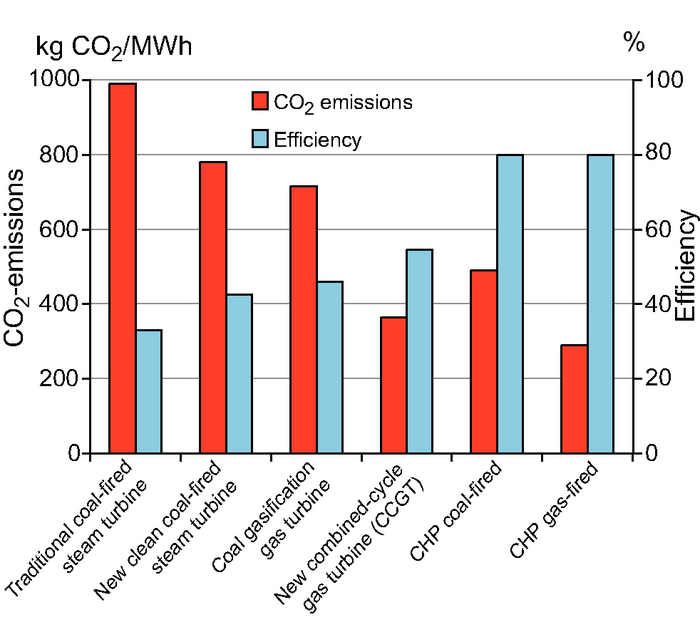
| Energy Generation System | CO2 Emissions (kg CO2/MWh | Efficiency (Percentage) |
|---|---|---|
| Traditional coal-fired steam turbine | 995 | 30 |
| New clean coal-fired steam turbine | 775 | 40 |
| Coal gasification gas turbine | 700 | 45 |
| New combined-cycle gas turbine (CCGT) | 375 | 55 |
| CGP coal-fired | 500 | 80 |
| CHP gas-fired | 275 | 80 |