When you bring in vector datasets to be drawn by the browser, you may need to do some work to define the symbol that will draw the feature. With data formats like GeoJSON that don't contain any styling information, you don't get ready-made styling like you would get if you just requested an image from the server. If you don't define a symbol for your graphics, you'll probably see your API's default symbol.
In Leaflet, it's common to define styles within functions. This makes them easy to re-use. Here's an example of how you could set up a style and apply it to a GeoJSON layer. This example shows urban gardens as polygons:
// Set up style for garden polygons
function gardenStyle(feature) {
  return {
    fillColor: "#FF00FF",
    fillOpacity: 1,
    color: '#B04173',
    weight: 4,
  };
}

// Create layer and add it to the map
var gardenLayer = L.geoJSON(myGardenJson,{
  style:gardenStyle
});

gardenLayer.addTo(map);
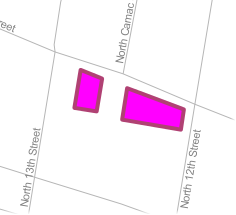
Notice that the properties include fill color, fill opacity (which controls transparency), stroke color, and stroke weight. The colors are defined using hex notation. In this case, the symbol is a magenta fill with a purple outline (Sorry! I wanted it to stand out...). When writing your own code, use an online color picker to get the hex values of the colors you want.
You can see a list of Leaflet's vector styling properties by reading the Path options documentation. You should be able to accomplish most of what you want to do using working examples and a little bit of experimentation.
The advantage of drawing vector layers in the browser is that you can quickly change the styling in response to certain events. For example, you can change the color of a single symbol when a user clicks it. Using Leaflet, you can define various styles and connect them to map events.
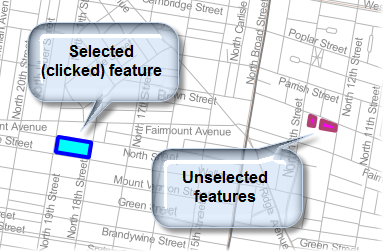
The code below demonstrates how a style map could be used to "highlight" a garden feature when it's clicked. The selected garden would change to a blue fill:
Don't worry about running this code right now, because you'll use some nearly identical code in the lesson walkthrough in a working example. Just pay attention to the code patterns and what is happening in each line.
First, create functions to define the unselected and selected styles:
// Set up styles for garden polygons
// Magenta symbol for gardens
function gardenStyle(feature) {
  return {
    fillColor: "#FF00FF",
    fillOpacity: 1,
    color: '#B04173',
    weight: 4,
  };
}

// Blue symbol for selected gardens
function gardenSelectedStyle(feature) {
  return {
    fillColor: "#00FFFB",
    fillOpacity: 1,
    color: '#0000FF',
    weight: 4
  };
}
Then create the GeoJSON layer and add functions to listen for click events on the GeoJSON features and the map itself. The code below contains a variable named selection, which holds the currently selected feature. The expression if (selection) checks to see if there is any selected feature. The expression e.target means "the feature that just got clicked". Notice how the resetStyle method can set a layer's style back to its original form, and the setStyle method can change a feature's style to something new.
var selection;

// define function to handle click events on garden features
function gardenOnEachFeature(feature, layer){
  layer.on({
    click: function(e) {
      if (selection) {
        gardenLayer.resetStyle(selection);
      }

      e.target.setStyle(gardenSelectedStyle());
      selection = e.target;

      L.DomEvent.stopPropagation(e); // stop click event from being propagated down to other elements
    }
  });
}


// Create layer and add it to the map
var gardenLayer = L.geoJSON(myGardenJson,{
  style:gardenStyle,
  onEachFeature: gardenOnEachFeature
});

gardenLayer.addTo(map);


// define and register event handler for click events to unselect features when clicked anywhere else on the map
map.addEventListener('click', function(e) {
  if (selection) {
     gardenLayer.resetStyle(selection);

     selection = null;
  }
});
A map user should now be able to click any garden and see it highlighted in blue. When the user clicks off the garden, it goes back to its original magenta symbol.
To summarize this part of the lesson, vector layers drawn by the browser require a little more work on the developer's part, because the developer must define the symbols. However, with that work comes a variety of options for interactivity that would not be possible with rasterized image tiles or layers drawn by the server. Although the resymbolize-on-click functionality seems rudimentary, think about the difficulty (if not outright futility) of getting this type of effect with a WMS or rasterized tile layer.
This section of the lesson has discussed uniform symbols for each feature in the layer (except for the occasional selected feature); however, Leaflet allows you to go further by defining style classifications based on attribute values. This opens the door for choropleth maps, proportional symbols, and so forth. Some of these techniques will be covered in Lesson 8.
Allowing developers untrained in cartographic principles to select map symbols may present some challenges of its own. It may be a good idea to have the developer consult with a cartographer in order to determine the most appropriate widths, colors, and fills for the vector symbols.