Lessons
Lesson 1: Introduction to Location Intelligence
1.0 Introduction to Lesson 1
Welcome to Lesson 1 and a quick overview of what you should expect in each lesson.
- There will be a brief Introduction to the Lesson, a list of Goals, a checklist of Activities for the week, along with Deliverables and Due Dates.
- "Post comment," found in the "Where to Complete" column, refers to your post in the Canvas Lesson Discussion Forum.
- You may find it convenient to print this page so you keep on schedule.
Please notice that Deliverables are due Tuesday nights (midnight State College time). This will help keep the discussions timely, lively, and meaningful.
Do not hesitate to contact me if you are having difficulty navigating the system. Also, please alert me if any links are not working or if text needs fixing.
Instill in yourself - and practice frequently - an addage from the FranklinCovey group to "Begin [each day, assignments, GEOG 850 Lessons] with the end in mind". Please read the Coda (pp.133-137) in Geography, Why It Matters by Alexander B. Murphy. The author highlights the importance of learning geography to understand changes in the world around us (2018: p.134):
We are awash in data about the transformations taking place, but we cannot hope to gain a handle on them if the population at large has little sense of Earth's geographical character and the changes that are happening to it; if students and scholars lack the analytical perspectives and tools needed to assess the evolving spatial organization and material character of places and regions; or if policy-makers and planners are not equipped to think geographically about issues and problems - to think knowledgeably and critically about geographical patterns, to consider why things happen where they do, and to appreciate how geographical context influences what happens.
On March 23, 2021, a massive container ship, Ever Given, ran aground blocking the Suez Canal. Work immediately began with every tugboat nearby to attempt to free the ship and minimize the impact on shipping traffic in the Suez Canal. At that time, little did the public know that this event would have a global impact on supply chains, sea traffic management, and disrupting deliveries of most industries. BBC News. (2021). How many people knew the location of the Suez Canal? How many people learned new geospatial information of global ship traffic from this grounding event? Suez Canal: Wedged container ship seen in busy waterway. 24 Mar 2021 [1].

Learning Objectives
At the successful completion of Lesson 1, you should be able to:
- provide examples of the use of location intelligence, GIS, and geography in business strategy/decision-making;
- identify principles of competition and the roots of business problems;
- discuss the principles of intelligence analysis;
- introduce location intelligence as a process for geospatial analysis of business problems;
- discuss the term project.
What is due for Lesson 1?
Lesson 1 will take us one week to complete. There are a number of required activities in this lesson. For assignment details, refer to the table below.
Note: Please refer to the Calendar in Canvas for specific time frames and due dates.
| 1.1 Introduction to Location Intelligence | ||
|---|---|---|
| Requirements | Details | Access / Directions |
| Read | Read the course content. | Use the Lessons menu or links below to continue moving through the lesson material. |
| Murphy: Geography, Why It Matters, Coda (pp.133-137) | The Geography: Why it Matters reading is from the required textbook for this course. | |
| Why Where Matters, Companies Ask Geospatial Questions | Registered students can access the reading in Canvas on the Lesson 1 Readings page | |
| Deliverable | Discussion comment on Video, Due Tuesday. | Post in Canvas to the Lesson 1.1 - Location Analysis Video forum. |
| 1.2 Location-based Business Problems | ||
|---|---|---|
| Requirements | Details | Access / Directions |
| Read | Read the course content. | Use the Lessons menu or links below to continue moving through the lesson material. |
| When it Comes to Analytics Success, X Marks the Spot | Registered students can access the reading in Canvas on the Lesson 1 Readings page. | |
| Deliverable | No Deliverable | N/A |
| 1.3 Intelligence Analysis Principles | ||
|---|---|---|
| Requirements | Details | Access / Directions |
| Read | Read the course content. | Use the Lessons menu or links below to continue moving through the lesson material. |
| First Principles of Intelligence Analysis | Registered students can access the reading in Canvas on the Lesson 1 Readings page. | |
| Deliverable | No Deliverable | N/A |
| 1.4 Location Intelligence | ||
|---|---|---|
| Requirements | Details | Access / Directions |
| Read | Read the course content. | Use the Lessons menu or links below to continue moving through the lesson material. |
| Read | Murphy: Geography, Why It Matters, Ch. 1 (pp. 1-30) | The Geography: Why it Matters reading is from the required textbook for this course. |
| Deliverable | Post your comments on the definition of Location Intelligence, Due Tuesday. | Post in Canvas on the Lesson 1.4 - Location Intelligence Definition forum. |
| 1.5 Term Project Overview and Weekly Deliverables | ||
|---|---|---|
| Requirements | Details | Access / Directions |
| Read | Read through Term Project Overview. | Post any Questions to Canvas Term Project module - Term Project Discussion forum. |
| Deliverable | No Deliverable | N/A |
Questions?
If you have any questions about course mechanics, where to do something, or how to do something, feel free to send me an email via the Canvas system at any time.
1.1 Introduction to Location Intelligence
Today’s location-based situations or problems are complex and the information decision makers need is often obscured in their organization’s Big Data. There may be a quick, apparent solution found in an organization’s operating agreement, checklists, or previous decisions. Yet, tough business problems benefit from a systematic approach.
Location intelligence starts with a question. What location-based challenge or opportunity is my organization trying to solve? An American inventor and businessman, Charles Kettering, may have been the first to note that a problem clearly stated is a problem already half solved. Most business data connects physical locations, dates, and times—linking business operations to place and time.
Geospatial analysts ground themselves in the problem. Then, through effective research and applications of geospatial science, analysts uncover patterns in data that link observations, hypotheses, and information to a solution. Understanding a scientific method of study or workflow method of analysis is foundational to examining and solving complex problems.
GEOG 850 focuses activities on location intelligence for business, dealing with sectors of an economy, business principles, location-based problem solving, risk assessment, and digital technology to enhance location analytics. This is not just about omni-channel marketing using smart phones. So, throughout the course reflect on how the process, technology, and output of location intelligence apply to all facets of business, e.g. developing strategies, local to global operations, manufacturing, even recycling and waste management, sales force alignments, and communications.
In a 2010 text Why 'Where' Matters: Understanding and Profiting from GPS, GIS, and Remote Sensing, Bob Ryerson and Stan Aronoff, welcome readers to the new economic era - the GeoEconomy.
The GeoEconomy is how we define the economy that is increasingly being driven by, and dependent on, geospatial or geographic information - inofrmation that is tied to or linked to a geographic location. This location based information is termed geospatial or geographic information or geo-information. In some significant ways the GeoEconomy is a throw-back to prehistoric time when individual and societal survival depended on them having a thorough understanding of the geography of the places in which they lived. However, in the past much of the geographic advantage was based on what we call geo-luck - those in ancient times that happened to have the advantage of being located close to water and good soil, or who had an easily defended home were lucky - those that did not, died or lived so close to the subsistence level that they could not develop more advanced civilizations.
Simply put: today those who "get it," those who understand the GeoEconomy and how to use it to their advantage, will do well. Those who do not will, as our ancestors did, depend on geo-luck. Luck, geo or otherwise, like hope, is not a strategy.
However, today individuals, businesses, and governments at all levels can now make geodecisions based on better information that is more easily accessible than at any time in history. Not only do we all have access to the data, we also have ready access to low or no cost tools that enable the non-specialist to use that data. Anyone capable of accessing and using the Intenet can access and use geospatial information relevant to themselves, their community, business, country, or the global environment.
The authors outline a series of typical business questions corporations will ask relating location, geospatial technology, and information. Geospatial data scientists follow the scientific process and organized analysis methods to prepare geospatial data for use in business decision making. Reflexive inspection of an organization offers an insight to business questions from many categories to include marketing, resource management, consulting, or risk management. The objective of this course is to teach and reinforce critical thinking in geospatial business contexts; not to train graduate students on a particular location intelligence platform.
Contemporary professional journals include new references of location intelligence using various types of information and analysis methods, e.g. crowdsourcing, human geography, visual analystics, forecasting, geospatial modeling, risk assessment, sustainability, and decision making. As an introduction to Location Intelligence for Business, we offer an insight to business sectors and career fields relating to Location Intelligence:
- Geospatial Intelligence (GEOINT)
- Geo-Marketing
- Urban Planning
- Environmental Concerns and Sustainability
- Cartography and Webmap Design
- Real Estate Management
- Remote Sensing
- Business Analysis
- Consumer to Customer Digital Transformation
Former Penn State student—now instructor—Rob Williams shares his Capstone work. Enjoy and process the presentation.
Hi, I'm Rob Williams from Penn State. I'm going to demonstrate how to use geospatial intelligence for a business problem. In this case, where to locate a new metropolitan airfield where we want it, say near a business center, and not where the airports are today. So the analytical problem is, what's the location within an urban area to put a new air service that doesn't need a runway? And I'll talk about that runway in a second. But as I looked through this problem, I discovered that I had to amend the problem statement. Instead of location, I really need to address places. And the place includes where are the people, what are they doing, what's happening in that region? And not just the downtown urban area, but the entire metropolitan region. I also saw that looking at airline service was too narrow. And what really is important is the entire air transportation system, both the private sector and the public sector, and this is now our problem. So what are these aircraft that we're talking about? These are vertical takeoff and landing aircraft. The ones on the left, you can see, are familiar to us. Traditional helicopters, either the small executive class or the larger transport class for people or cargo. And there's a new class of aircraft that could be coming in the future, tilt rotors, which take off and land like a helicopter vertically. But as you can see in the upper picture, the rotors tilt forward and the airplane can fly like a commuter at high speeds. So the opportunity here is, where can we locate these vertical take off and landing aircraft, in urban areas, that adds to the economic wealth of an area? These could be either in downtown areas like the Manhattan heliport you see in the center or maybe out on a ring-road like the Hotel Vertiport located on the right. We're going to look at the benefits to the economic development both from the traveler's standpoint as well as the community and the economic benefits. There's also costs for this kind of service, either environmental, noise, safety, and the cost of infrastructure. But for this particular problem, we're only going to focus on the benefits, using our GIS methods. The value then would be what's the value to a traveler, either by shortening their travel distance on the ground, making it more convenient, there's also benefits to the business trade areas, and finally, the overall economic activity. These can all be evaluated using Geospatial Intelligence methods. The specific methods we use are business location analytics and network analysis. A tool suite which is good for this purpose would be ESRI's Business Analyst Online, and they also happen to provide a lot of the data. I'm going to speak specifically about this very interesting set called Tapestry. So the overall approach is three steps. We're going to look at a sample metropolitan area. We're going to do a coarse evaluation to figure out where in that metropolitan area might we want to locate such an airfield, and we do use this through either direct measurements of data or maybe proxies, we'll create the data layer maps, and then pick a general target area. And then, finally, using fine tune analysis, we'll look at the benefits of specific spots on the ground, specific places, and determine which is the best. So, to start off, the sample market I was looking for: a urban area, with a single airport, that had lots of good data about the demographics. I selected the Philadelphia region for this purpose. So, in the Philadelphia area, one of the first things we can evaluate is who travels by air? ESRI and the online system has a data set for exactly this. Who has traveled more than three times in the last 12 months? And it's divided by zip code. So, here you can see in the green spaces, households by zip code that have traveled three times or more in the last year. Philadelphia airport is at the airplane icon in the center, so you can see north and west of the city is a large density of travelers and then to the far northeast up near the Trenton area, you can see another center. We're going to focus on this area north and west of Philadelphia Airport. To do this, I'm going to use the Tapestry data set. This is a really interesting dataset that looks at demographics, population, wealth, income, types of jobs, types of mobility, residences, and, in particular, this group called the affluent estates on the left. This is the wealthiest group, and the premise is that these folks probably do the most travel and would be most interested in having this kind of service available to them. So, looking again at that map of Philadelphia with Philadelphia spotted in the center. Again, north and west of the city, in red, in that circle, you see zip codes in red that have the highest density of the affluent estates residents. So that is an initial indicator. Second, I also looked at US census data, the NAIC code for finance and industry or insurance industry, and you can see in that same region, just a sample, but you can see how dense that same area is for these kind of businesses. So, this area north and west of Philadelphia airport looks like a good place to look more closely. So, as we hone in, I picked one spot in the center of that region. And now, it's a question of where to put that first initial look. I'm looking for, in particular, short driving times, ten to fifteen, ten minutes or so, and, in particular, I'm looking at who lives in this region? What kind of residents? The blue and the yellow colored regions are the highly mobile people in the Uptown Individuals and GenXurban from the tapestry data set. They would probably be most interested in having this kind of air mobility right in their neighborhood. But more interesting is the green and the orange segments in the surrounding areas. These are the folks who have, say ten to twenty minute drive times to such a location. And this is the population we're very interested in. So, MIT did a study on which industries have the highest propensity for air travel compared to trains, compared to automobile. And, you can see the industries here that use the air transportation the most. So, now that we have identified these industries, we can use US Census Data, the North American Industry Classification System to actually identify on maps where these folks and businesses live. So, wholesale trade, finance and insurance, and professional services, we'll focus on those three. In the first case, wholesale trade, you can see in three different maps whether the number of businesses, the number of employees, or sales by ZIP code, you can see this concentration around that blue dot that we selected for this study of where to site a new airfield. This looks like a nice concentration right exactly where we placed our marker. In the next industry, finance and insurance, again we see the same pattern. Number of businesses and employees. This again looks like a good segment. Finally, we verify it. A third segment, professional services. This looks like a good pattern. So, we're happy with where that dot is located. We're going to now look more in detail. So, three sites were selected for detailed analysis. These are three areas that are available for development. They're all in that same general area, but which one is the best? So Riverside, King of Prussia, Norristown. We're looking again; these are all three far from the Philadelphia airport. But we're going to look at these 20 minute drive times. If we go back to the tapestry data, there's a different look at the same population, and it's called the urbanization groups. And these are the concentrations that we're looking for. Where is the densest groupings for the same US populations? We already identified the affluent estates. So, this is one group, but they may not be the only group we're looking for. There's also people who are upwardly mobile, who are going to want to travel, who are rising in their careers, these folks too would want to be located near this kind of air facility. So we're going to look at these population groups in the tapestry. So for a specific analysis, we're looking at 10, 20 and 30 minute drive times. From either the Philadelphia airport or these three possible airfield sites. And as you can see in the 20 minute drive time, both the riverside and the King of Prussia look like they have the best collection from these population groups. The 30 minute drive time, you have over 100,000 households that are possible users of this air facility. You'll also notice that Philadelphia Airport increases as well, but my belief is that those people actually live in a different side, perhaps down in the Delaware and the New Jersey region. So I think these three sites are still very good. So then, the final analysis, we see the 20 minute drive time, and of all the different demographic groups, it seems like the majority align best with the King of Prussia site as having the largest numbers at the shortest driving times. So, I think the King of Prussia site is going to be our choice. So, in conclusion. Using the Geographic intelligence analytic methods seems to be a very good way to analyze this particular problem. We used a sense of place, meaning what's the travel propensity and the household incomes and the types of travelers. Seems to be adequately covered. The coarse site selection yielded our general location of where we wanted to site the airfield, and then the fine analysis, we actually could figure out exactly where we want the locations and what is the best site. Thank you.
Read:
- Ryerson, et. al., Why Where Matters, p. 274.
- Questions Companies May Answer with Geospatial Information and Technology
Note: Readings can be found in the Canvas on the Lesson 1 Readings page. This reading applies to geospatial analysis and your Term Project. Throughout the course, you're asked to examine a geospatial/location problem, translate this into an analytic question, and design a workflow to offer solutions to the problem.
As you watch the video and read the selections, consider the following questions:
- Video: What surprised you about the Capstone video?
- Video: What did you take away from the presentation?
- Video: Can you outline the process in as few key steps as possible?
- Lesson: Regarding Ryerson's list on p. 274, "Questions Companies May Answer ..."
Deliverable:
Upon completion of the readings, post 2 comments to the Lesson 1.1 Discussion Forum in Canvas,
Step 1: Read the threads already posted.
Step 2: Pick from the above questions and answer 1 based upon the video and your reading of the material. Please remember to respond to 2 of your classmates' postings as the discussion thread evolves.
Due Tuesday 11:59 pm (Eastern Time)
Please refer to the Calendar in Canvas for specific time frames and due dates.
Note:
You needn't answer every question explicitly, but do consider these broad themes in your responses.
Also Note: It takes a week or two for us to get a rhythm established in our discussions. I'll say this now and remind everyone later: I'm more concerned that everyone participates in some way in the discussion than I am that everyone answer exactly the same question (in which case, we might end up with 10 very similar answers.) Let your conversations evolve naturally as you read and respond to others' posts.
We don't have to agree with another's posting, but we do have to respect each other in the process.
1.2 Location-based Business Problems
Businesses organize to provide a product or service to fulfill customers’ needs. Similarly, analytical problem solving starts with user requirements and needs. In the case of business problems, who are the users and stakeholders? A business strives to lead in its industry, to gain loyalty from customers who prefer and purchase that business’ products or services. Competition boosts innovation, spurs companies to develop the most favorable products, and drives creative pricing and delivery options for consumers.
Inventors and companies learn from observing and actively participating in a competitive environment. Imitation certainly occurs and some great ideas are stolen by dishonest people; however, commerce, business, and patent laws protect original ideas and support the free economy that thrives on vigorous competition. Businesses succeed when they develop desirable products and services, offer competitive pricing, and deliver on their commitments. Competition also creates opportunities for collaboration to optimize certain products/services for customer or market needs.
Business insights—assessments to understand business situations—are connected to location, markets, and product distribution. Analyzing the business environment requires an understanding of the market, available products or services, customer preferences, behaviors, and expectations.
To produce location intelligence, one examines geospatial and business components to fully realize the situation, identify key factors, uncover patterns and relationships, and present possible solutions. Figure 1.1 depicts how Location Intelligence for Business is built on the principles of intelligence, geography, and business.
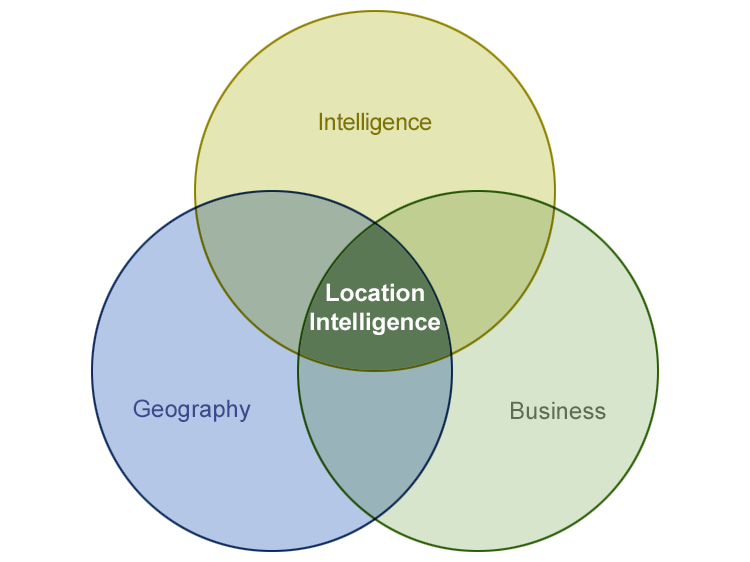
Note. Geospatial Intelligence (GEOINT) and Business Intelligence (BI) are separate areas of information and intelligence which should be recognized and not confused with Location Intelligence. GEOINT and BI are not examined in detail during GEOG 850, Location Intelligence for Business.
These three disciplines of intelligence, geography, and business have some unique foundational principles and share other, similar principles. Prunckun, Bacastow, and Lowenthal describe first principles as the fundamental concepts on which a theory or discipline functions. Fundamentally, geography is a spatial study of the earth’s surface; however, in practice, the science examines physical geography, human geography, and the environmental relationships of both.
Distance hinders interaction between places, events, and entities. Often described as the friction of distance, a consumer’s choice to purchase products locally rather than travelling a further distance can be measured in time and transportation costs. (Tobler, 1970: 234-240)
Geography is involved overtly and intuitively in business planning and operations. Geographic data, describing the location and attributes of things in the world, comes in many formats for use in analysis, creating maps, solving problems, sharing observations and insights.
Todd S. Bacastow, Teaching Professor of Geospatial Intelligence, Penn State University, introduced first principles of geospatial intelligence (GEOINT) that form a knowledge paradigm of the profession. Geospatial intelligence as a human process follows a methodology, is conducted in secrecy, and seeks to achieve an information edge or decision advantage. Integrating imagery, imagery information, and any available geospatial information, GEOINT reveals how “human behavior is constrained by the physical landscape and human perceptions of the Earth.” The discovery of relationships in space and time improve our understanding and anticipation of human patterns of life. (Bacastow, 2016)
Both human geography and census geography contribute to location intelligence. It’s a branch of geography studying patterns and processes that shape the human society; modeling human, cultural, societal, political, and economic factors.
Most business data points are linked to physical locations and times. Ryerson highlights the geoadvantage which an entity gains from analysis of geographic phenomena, human activity, and economic productivity.
A location-based research process starts with gathering all relevant internal business information and enriching it with relevant geographic information.
- Ask pertinent questions to identify key factors, data gaps, drivers which will influence the decision process.
- What business information relates to the problem?
- What business objectives are impacted by the problem?
To enrich the data for analysis, obtain geospatial information from within the organization, open sources, and reliable third-party vendors. Research geographic information, georeferenced data, specialize data, statistics, and references, in this case, business information. A geographic information system (GIS) is often used to manage, analyze, visualize, and gain an understanding of geospatial data. Relate how and where location is linked to the business information.
Conduct data enrichment to expand a resource of consumers, customers, demographics, market segmentation; often suitable to uncover customer patterns, behaviors, and trends.
An effective analysis process begins before an organization faces a problem or opportunity. Approach the situation with an educated, experienced process to develop relevant business questions, collect and enrich data, perform geospatial analysis, prepare to present findings with mapping and visualization.
A foundation for geospatial thinking in commercial settings begins with educating analysts and establishing a base for subsequent technical training in specific location intelligence applications.
The geospatial professional must practice and demonstrate critical thinking and geospatial reasoning to each problem analysis. The basis of Location Intelligence reflects core geospatial and business principles:
- Events are related by space and time.
- Objective is to engage customers and gain an advantage for the business, in some cases, to disadvantage competitors.
- Determination is made as to which references, rules, regulations, laws apply to the business question.
Read:
- Pitney Bowes. 2017. When it Comes to Analytics Success, X Marks the Spot: Location Intelligence is Driving New Insights and Providing Surprising Benefits. [3] Harvard Business Review: Analytic Services. 3 Oct 2017. White Paper.
Note: Readings can be found in Canvas, Lesson 1, organized by topic.
Waldo Tobler. (1970). A computer movie simulating urban growth in the Detroit region. Economic Geography 46(Supplement): 234-240.
Mark M. Lowenthal. (2015). Intelligence: From Secrets to Policy. Thousand Oaks, CA: CQ Press. Sixth Edition.
Bacastow, Todd S. (2016). Viewpoint: A call to identify first principles [4]. NGA Pathfinder.
1.3 Intelligence Analysis Principles
Intelligence is the result of information analysis. Information alone does not drive decision-making or inform leaders of the optimal course of action necessary to achieve strategic goals. An analyst or group of specialized professionals collect, analyze, and evaluate information to produce intelligence which benefits their organization.
Competitive Intelligence
Information, human behavior, and geopolitical forces are in constant flux. The timeliness of intelligence significantly impacts the outcomes of a leader’s decisions. Thus, intelligence is a formal process, a continuous cycle, as information is gathered, accessed, and resulting outcomes are disseminated and used to set new collection requirements. The cycle is a framework for competitive intelligence, conducted in secret to gain a decision advantage over adversaries.
An entity conducts intelligence when competition exists, and power is the leverage to maintain security against an adversary’s threats. The key is to develop and apply intelligence to achieve strategic objectives; converting power to an advantage for the nation or organization. National intelligence supports policymakers and exists to avoid strategic surprise and maintain the secrecy of information, needs, and methods. (Lowenthal, 2015: 2)
First Principles
To Prunckun, secret research is founded on the first principles of intelligence. Competition between adversaries drives decision makers’ priorities and defines the intelligence requirements. The result of intelligence analysis must be that “Intelligence enables the analyst to present solutions or options to decision makers based on defensible conclusions.”
First principles of intelligence research and analysis coexist in the intelligence cycle and production of assessments to meet policymaker requirements:
“The theory’s six propositions state that intelligence research is: 1) conducted in secret, 2) identified within the intelligence cycle process so that data collection and analysis can be problem focused. In this regard, intelligence analysis can be 3) offensive as well as 4) defensive, but 5) it must be timely, and 6) its findings need to be defensible.” (Prunckun, 2015: 31)
Intelligence is typically conducted in secrecy to conceal information, uncover hidden information, and identify other governments' methods of espionage or discovery. Denying an opponent’s access to key information is critical to maintaining secrecy and is as important as exposing that adversary’s hidden information, capabilities, and intentions. (Lowenthal, 2015: 400)
Propositions can also be referred to as conditions in Prunckun's theoretical work.
Whether to support a nation’s strategies or an organization’s business objectives, the purpose of intelligence is to collect and analyze information which decision makers require and gain an advantage.
A formal intelligence process forms a cycle of identifying requirements, collection, processing and exploitation, analysis and production, dissemination, consumption, and feedback. Requirements and priorities focus the effort of an organization or intelligence agencies and, ostensibly, improve the effectiveness of intelligence production.
Lowenthal describes collection as the bedrock of intelligence; influenced by the variety of collection means, intelligence methods, and effective feedback from policymakers. (Lowenthal, 2015: 87) We will review methods of collecting geospatial information and business data in Lessons 3 & 4.
Read:
Prunckun, Henry. 2015. First Principles of Intelligence Analysis: Theorising a Model for Secret Research [5]. Salus Journal. 2015: Issue 3, No. 1.
1.4 Location Intelligence
Throughout the course, I encourage you to note examples of geospatial, intelligence, and business principles in the development of location intelligence. Businesses leverage spatial patterns and relationships in data to improve their operations and marketing. Business leaders also have a responsibility to optimize the spending or costs of research, operations, marketing, sales, and distribution. Analysis results and assessments from Location Intelligence provide advantages relating to business costs, return on investment, and profits.
Creating an Advantage
Businesses depend on creating an advantage for their organization or disadvantaging the competition. Location intelligence produces insights for a business to optimize their performance, leveraging advantages of geography with their product or service. Enterprise-wide databases now link geospatial attributes to assets, product features, operational tables, and customer relationship management (CRM) data. The next steps for integrating mapping services with key functions include web GIS, APIs and SDKs, multiple mapping visualizations (2D, 3D, webmap), dashboards, connected sensor data collection, IoT with real-time services, field data collection for asset management, and interior space mapping.
Location intelligence is not a formal discipline, nor universally defined or presented. It is also not a new concept since it is estimated that 80% of all data may have a location component. A key point to understand is Intelligence is not collected; it is produced after collected data or information is evaluated and analyzed. There is growing momentum for commercial applications in geospatial technologies, geospatial intelligence, and widely incorporating GIS into operations and databases. Beyond traditional site planning, location intelligence is now a blend of science, location data, human geography, and business information. Location-based studies begin with these elements and go on to identifying principles at work in a business problem.
We see location intelligence described or practiced in three ways:
- Location intelligence as a process
- Location intelligence as a product
- Location intelligence as platforms or software systems that perform geospatial analysis
Location Intelligence has applications in many disciplines and is generally considered to consist of five fundamental components:
- clearly stating a location-based analytic question
- data management, georeferencing, web mapping of key information
- geospatial analysis for patterns or significant factors
- visualization, presenting, reporting for decision making
- integration into the organization’s strategy and operations
Location Intelligence provides insights for businesses on markets, consumers, product adoption, relative location information, and customer needs, behaviors, interactions. Analysis is performed to identify and understand patterns; not solely to provide use cases to support planned courses of action.
Using location intelligence gives a business a decision advantage to achieve business objectives; results of the geospatial analysis provide insights for the business to organize, operate, and/or perform better than their competitors. Understanding and applying a scientific method of study or workflow of analysis is foundational to examining geospatial data for patterns, solving complex problems, and anticipating threats.
Location Intelligence Workflow
Fundamental to GEOG 850, the process of location intelligence is a problem solving and discovery process. You will apply a conceptual model or workflow to develop Location Intelligence for each activity and your term project. Your ability to communicate results, recommendations, or decisions is as important as your skills in research and analysis. For each deliverable, apply effort to provide effective visualization and presentation of your discoveries.
Consider the elements of this location intelligence workflow:
-
Identify a location-based business problem or situation
-
Restate the problem as a business question with goals and objectives (that lead to an actionable decision)
-
Gather and enrich all relevant data: internal business information, geospatial information, open source, third-party
-
Perform geospatial analysis to model; discover patterns and relationships
-
Predictive analysis to anticipate outcomes
-
Expected future behavior of consumers
-
Prescriptive analysis to recommend courses of action
-
-
Map, visualize, chart, and present for actionable decision
Location intelligence has different meanings, purpose, and terminology. Depending on context, location intelligence is a definition, a method of geospatial analysis, a subset of business intelligence, or software application for business analysis. It is an intelligence activity, conducted confidentially to gain an advantage for the business.
A succinct definition of location intelligence must also be sufficiently broad to apply to many disciplines. The foundation lies in principles of intelligence, geography, and the discipline under investigation—in this course—business. Location intelligence is the collection and analysis of many sources of geospatial data that are transformed into strategic insights to solve a variety of business challenges.
Location Intelligence Definition
Location intelligence in business is the practice of collecting, enriching, and analyzing business information, georeferenced data, and geospatial information to discover contextual insights for location-based challenges or opportunities. The process of location intelligence is often conducted confidentially to gain a decision advantage for the organization or to disadvantage competitors. Human geography is also a factor; to recognize and appreciate relationships between human behavior and our environment.
Read:
- Murphy, Alexander B. Geography: Why It Matters. Chapter 1 (p. 1-30). Cambridge, UK: Polity Press. 2018.
The Geography: Why it Matters reading is from the required textbook for this course.
Deliverable:
1. Post a comment to the Lesson 1.4 Discussion Forum in Canvas, including:- How well does the definition of Location Intelligence describe the process for business?
- your rationale;
- citations of pertinent references you used.
2. Don't forget to read, and then comment on another student's definition of location intelligence.
Due Tuesday night 11:59 pm (Eastern Time)
Please refer to the Calendar in Canvas for specific time frames and due dates.
1.5 Term Project - Overview and Weekly Deliverables
Throughout this course, a major activity is a location intelligence project that you will develop and research on your own (with some input from everyone else taking the course). To ensure that you make regular progress toward completion of the term-long project, I will assign project activities for you to complete each week.
The topic of the project is completely up to you, but you will have to get the topic approved by me. Pick a topic of interest and use the different methods applied during this class to better understand the topic. Some topics considered include:
- Location intelligence, Resources & Synergies Development (R&SD), operations, services, sales and business development, marketing, C-suite decision making, procurement, supply chain management, or telecommunications;
- Not just digital customer experiences, also optimizing the use of building and manufacturing space;
- Production machines talking to one another through connected sensors and IoT;
- City infrastructure sensing activity or phenomena, reporting the occurrence locally, and responding with safety, efficiency, recommendations for correction.
You will need to demonstrate what you have learned throughout the course. Your grade will be based upon demonstrating an understanding of:
- demographic and psychographic/behavioral profiling and market segmentation;
- trade areas; natural and man-made features affecting business opportunities; sales forecasting/market penetration;
- site characteristics typically investigated in the site selection process;
- solving or contributing to the solution of a business problem using geospatial analysis methods; and
- tools such as reports and maps; and how they inform market research, site selection, or support business decisions.
Take time this week to consider the following:
- What would you like to focus on—a broad market analysis, a site selection problem, leveraging indoor or digital location analytics, or something else?
- What level of geography would you like to work with? What location?
- What steps might you take in your research? Is the data readily available (or can you gather it and incorporate it, using the tools at our disposal)?
This week, the project activity is to become familiar with the weekly term project activities and to think about possible topics. Each week, the project activity requirements for that week will be spelled out in more detail on a page labeled Term Project, located in the regular course menu.
Note: All Term Project related work and deliverables will be submitted in Canvas during weeks 2, 3, 4, 6, 8 and 10.
Approach to a Location Intelligence Project
Design and follow a systematic approach to your project as you examine the problem, objectives, and decision making process. Lessons 1 – 4 will introduce geospatial and business principles used to form location intelligence. The lessons build a case for solving your location-based problem by asking a relevant business question, gathering and enriching data, applying geospatial analysis, uncovering factors, patterns, and contributing phenomena.
Week by Week Activities of the Term Project
Below is an outline of the weekly project activities for the Term Projects. You should refer back to this page periodically as a handy guide to the project 'milestones'. NOTE: I highly recommend keeping a regular diary of your activities on the Term Project. If you do this carefully enough, then the final report for the project should almost write itself!
| Week/ Lesson |
Points | Detailed Description of weekly activity on term project |
|---|---|---|
| 1 | — | Read this overview! Start thinking about your term-long project, researching location intelligence topics, and identifying data sources. |
| 2 | 20 | Brainstorm a few ideas you have for your Term Project and share them in a post to the 'Term Project: Brainstorm Project Ideas' forum in Canvas (Lesson 2). Respond to several colleagues’ ideas. |
| 3 | 20 | Submit a brief project proposal (a few paragraphs) to the 'Term Project: Topic Idea" forum in Canvas (Lesson 3). Provide feedback to at least two classmates on their Project Topics. This week, you should start to obtain the data you will need for your project. |
| 4 | 30 | Finalize your project proposal. Submit your project proposal with abstract to the 'Term Project Discussion – Project Proposal with Abstract' drop box in Canvas (Lesson 4). |
| 5 | — | Continue revising your project proposal, research key references, identify data sources. No deliverable is required for your term project. |
| 6 | 55 | A revision to your project proposal with data sources is due this week. This will commit you to some targets in your project and will be used as a basis for assessment of how well you have done. The final proposal with data sources should be submitted to the 'Term Project: Revised Project Proposal with Data Sources' drop box in Canvas (Lesson 6). |
| 7 | — | You should aim to make steady progress on your project this week. No deliverable is required for your term project. |
| 8 | 75 | Create a 5-7 minute PowerPoint or similar presentation and email me a URL link to your .mp4 or video. Submit your presentation to the 'Term Project: Project Update Presentation with Audio' forum in Canvas (Lesson 8). |
| 9 | — | Continue revising your project proposal, research key references, identify data sources. No deliverable is required for your term project. |
| 10 | 100 | This week, you should complete your project work and submit it as a Word or PDF file to the 'Term Project: Final Project Report' drop box in Canvas (Lesson 10). |
| 300 | Total Points |
Term Project Deliverable:
No Deliverables Due This Week: Not a deliverable; but please take time to familiarize yourself with the schedule for the term project.
Lesson 2: Business Modeling and Market Segmentation
2.0 Introduction to Lesson 2
It is important to remember that the marketing function in an organization is charged with the following responsibilities:
- Capture prospective customer needs, wants, desires and values (commonly known as the voice of the customer or the voice of the market).
- Create a product/service (something of value) that satisfies (meets or exceeds) the prospective customer’s expectations.
- Collect payment for product/service delivery (sell).
It also important to remember that a customer is a person/organization who not only has needs, wants, desires, and values but is willing to spend her/his money to fulfill those needs, wants, desires, and values (i.e., there is an exchange of value).
Raffi Amit, Wharton School of Business, and Christoph Zott, University of Navarra IESE Business School in Spain, were recently interviewed to discuss business modeling and changes the COVID-19 pandemic causes in an economy.
The COVID-19 pandemic triggered a severe, multifaceted global crisis--both a health crisis and an economic crisis. The shocks to the economy were both on the demand side as well as on the supply side. A catastrophic pandemic such as COVID-19 is very likely to alter the preferences, habits, and risk attitudes of consumers, in part because of the long stays at home and the social distancing measures that were applied. What seems very likely is that many companies--both large and small, both private and public, bothe for-profit and not-for-profit--will be prompted to reimagine themselves, to reinvent themselves, in order to survive and prosper in the future.
The way they engage with their customers might change dramatically. For the last almost year, we didn't go to malls. We didn't go shopping. We did everything online. If you are a mall owner, you will ask yourself, "Will consumers come back to malls? Will they need the mall? Will they need to go when they are so used to shopping online today?
There are profound behavioral changes that might occur as a result of this pandemic. Companies need to look at themselves and say, "Should we find new ways to interact wiht our partners, with our customers?" Therefore, "Do we need to design a new business model?" There is no doubt that the pandemic has prompted companies to reimagine and redesign their business models. I think that we don't really know how the new normal will evolve. That's work in progress, right? There are so many things that are happening, both politically, socially, and otherwise, and there is a record level of uncertainty as a result. That, for sure, will affect how companies will decide to engage with their stakeholders. Raffi Amit
Knowledge@Wharton. (2021). Business Model Innovation Matters More Than Ever. Podcast. 15 Feb 2021. https://knowledge.wharton.upenn.edu/article/business-model-innovation-ma... [6]
Learning Objectives
At the successful completion of Lesson 2, you should be able to:
- discuss how location relates to consumer behavior;
- discuss market segmentation;
- define segment, cluster, variable, and attribute;
- discuss Census geographies, demography, and the origins of market segmentation;
- locate and enumerate demographic (and psychographic) attributes of a given zip code;
- list the attributes for a selected segment and compare segments based upon variables; and,
- define demographic and psychographic profiling: and
- brainstorm ideas for a Term-long Project relating to location intelligence;
What is due for Lesson 2?
Lesson 2 will take us one week to complete. There are a number of required activities in this lesson, listed below. For assignment details, refer to the lesson page noted.
Note: Please refer to the Calendar in Canvas for specific time frames and due dates.
| 2.1 Business Modeling | ||
|---|---|---|
| Requirements | Details | Access / Directions |
| Read | Read the course content. | Use the Lessons menu or the links below to continue moving through the lesson material. |
| Moreno, “Location Intelligence: Mapping the Opportunities in Data Landscape” | Registered students can access the reading in Canvas on the Lesson 2 Readings page. | |
| Deliverable | No Deliverable | N/A |
| 2.2 Census Geography, Demographics, and Attributes | ||
|---|---|---|
| Requirements | Details | Access / Directions |
| Read | Read the course content. | Use the Lessons menu or the links below to continue moving through the lesson material. |
| Do | US Census geographies and population data activity | The activity is on the Lesson 2.2 Census Geography and Attributes course content page. |
| Deliverable | No Deliverable is required for this activity. | N/A |
| 2.3 Market Segmentation and Clustering in the U.S. | ||
|---|---|---|
| Requirements | Details | Access / Directions |
| Read | Read the course content. | Use the Lessons menu or the links below to continue moving through the lesson material. |
| NetMBA “Market Segmentation” | Registered students can access the reading in Canvas on the Lesson 2 Readings page. | |
| Mashable.com The End of Demographics” | Registered students can access the reading in Canvas on the Lesson 2 Readings page. | |
| Andrade-Walz, “Geodemographic Segmentation: The People Behind the Coordinates” | Registered students can access the reading in Canvas on the Lesson 2 Readings page. | |
| Optional Reading | Links to other examples of segmentation | Links to the readings are on the Lesson 2.3 Market Segmentation and Clustering in the U.S. course content page. |
| Do | Claritas "My Best Segments"part I, PRIZM | The activity is on the Lesson 2.3 Market Segmentation and Clustering in the U.S. course content page. |
| Deliverable | Presentation, Due Tuesday. | Submit in Canvas to the Lesson 2.3 Activity: PRIZM "My Best Segments" drop box |
| 2.4 Comparing Segmentation Systems | ||
|---|---|---|
| Requirements | Details | Access / Directions |
| Read | Read the course content. | Use the Lessons menu or the links below to continue moving through the lesson material. |
| Mosaic USA, Experian | Registered students can access the reading in Canvas on the Lesson 2 Readings page. | |
| Experian Business Strategies, Mosaic USA | Registered students can access the reading in Canvas on the Lesson 2 Readings page. | |
| Do | "My Best Segments" part II, P$YCLE and ConneXions * | The activity is on the Lesson 2.4 Comparing Segmentation Systems course content page. |
| Comparison with Experian Mosaic and CACI ACORN systems | The activity is on the Lesson 2.4 Comparing Segmentation Systems course content page. | |
| Deliverable | Quiz 1: Geography, Location Intelligence, and Segmentation due Tuesday. |
Registered students can access the quiz in Canvas in the Lesson 2 module. |
| 2.5 Term Project Brainstorm Project Ideas | ||
|---|---|---|
| Requirements | Details | Access / Directions |
| Read | Read the course content. | Use the Lessons menu or the links below to continue moving through the lesson material. |
| Deliverable | Post Term Project - Topic Idea, Due Tuesday. | Post in Canvas to the Lesson 2.5 Term Project – Topic Idea forum. |
2.1 Business Modeling
Business Modeling
This is not a business course; I encourage you to continue your research and consider other graduate courses to understand business fundamentals. In Location Intelligence for Business, we’re examining methods of geospatial analysis that develop location intelligence for business decision makers.
Through geospatial analysis, location intelligence provides a way to reveal relationships between data sets to arrive at actionable insights. Throughout the course, you may build a list of advantages a business gains from effective location intelligence projects or studies.
- Exploit data to create competitive advantage.
- Make better, more actionable business decisions.
- Link datasets to reveal relationships.
A business organizes departments, staffs, and roles to understand customer needs, create valuable products, market thier products or services, and distribute their product to the most likely locations for profitable sales. This is complicated, organized, established over years, risky, and often rewarding. An efficient organization performs business development, marketing, management, and reporting; constantly evaluating their performance to business elements, principles, and objectives. Analyzing data and situations with location intelligence to achieve business goals requires a connection to marketing SWOT analysis, needs assessments, risk and crisis management policies, and decision-making.
Examples of how this process benefits companies and customers include:
- reducing direct marketing costs through address verification;
- improving customer experiences with in-store location technology;
- enhancing civic & community engagement with targeted messaging for local events;
- modeling risk assessments to anticipate opportunities and threats; location intelligence is linked to SWOT analysis and needs assessments.
Business Advantage
A business promotes its products through marketing campaigns, alliances with partner businesses, and highlighting the advantages its products or services offer over competitors. Significant marketing effort is designed to transform consumers to customers. Sam Walton focused on consumers and relates in Sam Walton: Made in America that a company may need to redesign the entire business model with an understanding that "the whole thing is driven by the consumer, who are free to choose where to shop."
Competitive businesses in the digital age focus effort to fulfill two strategic goals for the organization and customers:
- The business wants to deliver Personalized Consumer Experiences, offered via digital marketing.
- Consumers desire customized products available through multiple channels, delivered in a simpler experience.
As an example, Amazon provides a standard for personalized marketing with:
- personalized Amazon page;
- chat connection for each experience; and
- recommendations based on previous purchases and preferences.
Digital transformation of marketing operations requires more data sources, relevant information, and geospatial connections to effectively segment markets and consumers. A buyer makes individual choices on the products or services needed; global businesses group buyers into collective segments to understand needs, preferences, purchasing behaviors, locations, and economic characteristics.
Business Metrics and Sales Reporting
One of the key accounting reports for a company is the Income Statement that reports the amount of revenue earned minus expenses paid for a given period of time (e.g. month, quarter, calendar year, or fiscal year). Another significant report is the company's periodic Statement of Cash Flows which reports the operating, investing, or financing activities during that time period. [These activities and reports are pertinent to Anti-Money Laundering/Counter Terror Finance investigations.]
- Operating expenses refer to the activities related to running the company to generate a profit.
- Investing activities include purchasing investments, lending resources, or buying long-term productive resources (e.g. purchasing large pizza ovens for a restaurant, earth moving equipment and trucks for a quarry).
- Financing refers to borrowing from institutions, receiving shareholder contributions, or paying dividends.
Resources owned by a company are Assets. In basic financial accounting, the Assets a company owns must equal what the company owes to creditors (Liabilities) and Equity (or Shareholders' Equity), as seen in (1). Creditors are anyone or any institution to whom money is owed. Typical creditors are banks, suppliers for the company, or finance companies. Depending on the type of business and how it is organized in its Articles of Incorporation, shareholders own shares in a company's stock. Limited Liability Company (LLC's) are formed with Articles of Organization; but do not have shareholders. LLC members share in the profits of the business.
Assets = Liabilities + Equity (1)
As a company sells its products or services, it generates or receives Revenue. For a company to be profitable, its revenues must exceed its expenses, as seen in (2). Profit is also called Net Income; and a company's profits accumulate as Retained Earnings (RE). When a company distributes RE to shareholders, this is called a Dividend. Dividends are not an expense for the company, they are a distribution of earnings.
Net Income = Revenue - Expenses (2)
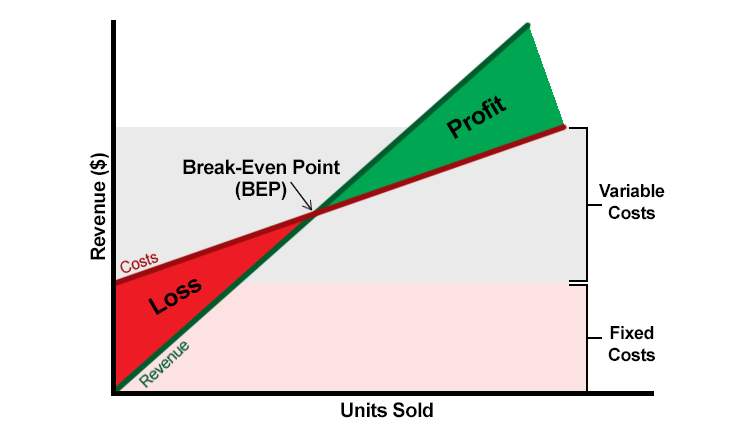
To maximize profits and minimize losses, a business aligns its structure, costs, and production. Profit and Loss formulas are calculated based on costs (fixed and variable) and sales forecasts (unit volume and revenue) (Figure 2.1). The inflection point in a company's profit and loss chart, where costs (expenses) and revenue (sales) meet, is referred to as the Break-Even Point (BEP). Revenue is calculated as the number of units sold times the product's unit price. Revenue = Units sold x Unit price, (ex. $280.00 = 80 units x $3.50/unit). Any point in the graph that is below the BEP is a loss and any number above the BEP shows a profit.
Customers vary in their needs and ability - or willingness - to pay for a product or service. Human behavior studies provide information for marketing managers while determining a product's introductory market cost; as well as statistical modeling, competitive research, and historical sales data. At the base level, business leaders perform profit and loss calculations to determine their requirements for capital, marketing budgets, payroll and operational costs, and manufacturing requirements. "To turn a profit, our company must sell x Products A and y Products B. How many potential customers must we reach?"
Company earns a Profit:
Revenue > Variable Costs + Fixed Costs
At Break-Even Point:
Revenue = Variable Costs + Fixed Costs
Company experiences a Loss:
Revenue < Variable Costs + Fixed Costs
Business Location Analysis
Business owners conduct Location Analysis or Site Selection to determine where to locate their stores, factories, distribution hubs, or offices. This is not just about finding a commercial property with the cheapest rent and insurance costs. With a focus on customers, where is a business selling products to their customers?
- At a physical site, an address where business will take place
- Through e-Commerce, as an Online business with a website domain, web hosting services, and presence in search results (IP address rather than a brick-and-mortar site)
Online location is definable in a digital sense as having the right domain name with online advertising. This enhances search engine optimization (SEO) so prospects can find that business and successfully consider purchasing products or services.
Ryerson, et. al., in Why Where Matters, Sections 6.1 and 6.4, describe how companies use geospatial data to gain a Geo-Advantage over competitors.
As previously noted, the GeoEconomy has come about, in part, as a relatively rapid evolution of our societal information infrastructure. In many respects this evolution is akin to the introduction of computers in the 1960s and 1970s. During that period governments, financial services, and some businesses rapidly adopted the technology - and some didn't. Some implemented the technology in effective and creative ways that catapulted them ahead of their competition. Some started off poorly and then reinvented themselves. Some didn't understand that computerization was not an option but an imperative, and when they failed to adopt the technology quickly enough they failed and disappeared. The history of the introduction of computers also tells us that among the suppliers of the technology there were some hugely successful long-term survivors and myriad small players (and a few large ones) that disappeared. Those who benefited the most were the ones who discovered how to use it before others caught on.
The GeoEconomy is no different. Those who first figure out (or who have already figured out) how to create and use geo-information will do better in the GeoEconomy than those who don't. ... In all cases it starts with one simple question: where?
In grappling with the explosion of Big Data in volume and velocity, companies perform geospatial analysis to leverage location data and location intelligence for business decision makers. Current examples include smartphone penetration; location infrastructure of cell towers, beacons, global positioning system (GPS), radio-frequency identification (RFID); distribution networks of 5G cellular connectivity; and the Internet of Things (IoT) with connected sensors.
Market Targeting
Market targeting; traditional, multi-channel, and digital channel selection.....strategic audience decisioning ... consumer experience.
Marketing principles
Why omni-channel marketing is optimal for some business.
How customer engagement and location intelligence tools assist.
Site Selection
In the remainder of this lesson, we focus on Site Selection at the physical address where business will take place, raising the questions that Moreno (2017) highlights:
- Why here?
- How can I succeed here?
As a response to the 2020 Covid-19 pandemic and to reduce exposure risks to the public, elected officials closed businesses, enacted regulations on food service and beverage sales, and emplaced bans on significant commercial activity. Contemporary studies will highlight the effects on small businesses, regional vs. global commerce, supply chains, and large retailers (e.g. Costco, Whole Foods - Amazon, Walmart).
Read:
- Moreno, Hugo. 2017. Location Intelligence: Mapping the Opportunities in the Data Landscape [7]. Forbes Insights, Thought Leaders. 19 Jan 2017.
Note: Readings can be found in Canvas in the Lesson 2 module, organized by topic.
First, let’s establish our base understanding of census geography, regions, and geographic terms.
2.2 Census Geography, Demographics, and Attributes
Activity: US Census Geographies and population data. Create and compare reference maps of various Census geographies of your hometown/neighborhood
Let’s start with the geographic coverage or the “where” of a problem. People have many ways of describing their environment, hometown, and surroundings. Terminology ranges from colloquial references to specific definitions in gazatteers.
- Regions, designated areas, tracts
- Census geography – neighborhoods, blocks
- Hot spots, corridors, areas of influence
The U.S. Census Bureau establishes a hierarchy of geography in the main Census website (www.census.gov [8]) and advanced search methods of census data:

Figure 2.2.1 - Advanced Search, US Census data. Credit: US Census Bureau website (https://data.census.gov [9])
U.S. Census Entities and Descriptions - understanding geography.
Urbanized Area - A continuously built-up area with a population of 50,000 or more. Urbanized areas are defined as densely developed territory to provide a better separation of urban and rural territory.
Census Tract - A statistical subdivision of counties; serves as framework for assigning census block numbers. Small, relatively permanent subdivision of a county or equivalent entity (e.g., district, parish, canton). Generally has a population size between 1,200 - 8,000 people.
Block Group - A statistical division of census tracts, generally containing 600 - 3,000 people. These are used to present data and control block numbering. Block groups consist of clusters of blocks within the same census tract that have the same first digit in their 4-digit census block number.
Blocks or Census Blocks - The smallest Census Bureau geographic entity. Generally bounded by visible features such as streets, streams, railroad tracks, legal or statistical entities. Census blocks nest within all other geographic entities; serve as the basis for all tablulated data.
Note:
If you're feeling a little "rusty" with regard to Census geography, here are some resources:
- You may want to look up the definition for each of the boundary features in step 3 below—use the US Census "2010 Geographic Terms and Concepts [10]" resource.
- In 2020, the U.S. Census Bureau decomissioned it's American FactFinder statistics and information search engine. The new site to explore Census data is found at data.census.gov [9] where citizens and researchers can still find: American Community Survey, Decennial Census results, population and housing unit estimates.
- For a more in-depth study of boundary features, refer to Chapter 2 of the "Geographic Areas Reference Manual (GARM) — 1990 Census [11]." It is a bit dated, and you'll find that some definitions differ from those currently used for the 2010 Census, but the GARM does a nice job of contextualizing Census geography. The diagram on pages 2-9 of Chapter 2 provides a nice visual understanding of how small-level boundaries nest.
- There is a wealth of other resources at the "Resources for Understanding Census Bureau Geography. [12]" I've linked to some of these resources in the Lesson 2.2 Readings - Census Geography and Attributes page in Canvas.
Step 1. Exploring Census Data.
Remember that the U.S. census has been conducted every 10 years since 1790 as required by the U.S. Constitution. In addition to that data, the Census Bureau conducts a number of surveys annually that pull together a great deal of information about the nation that is vital for government programs, policies, and decision making. Census data is available in a number of formats such as: thematic maps, reference maps, shapefiles, KML's, table data, as well as other types. We will begin by walking you through a simple data search in order to get you more familiar with the process of finding census data. As you are working with the site, pay close attention to the datasets and formats that could assist you in a particular interest or future project.
a. Navigate to the Explore Census Data [13] at the US Census Bureau's website (data.census.gov).

This search bar works best using keywords: geography, places, data table ID, NAICS code.
Enter: Centre County, PA
b. The next page starts with All Results: tables, maps, pages (along the top banner).

c. Click in the Blue Box "Explore Data Centre County, Pennsylvania Profile".

You can see the image is zoomed to the area of interest. This is a great place to start for popular information in one snapshot.
d. Scroll down in the data entries for Centre County.
Left Menu - Topics of Interest Right Menu - Data and Table ID's
(pause while the page is loading, give it time to complete)
Select: Income and Poverty > Scroll down on the right to Employment and Labor Force Status
Note that this is Table DP03 (Data Profile 3)
Step 2. Selecting the Data Table.
a. To go back to the United States Census Bureau [13] landing page, click the logo at the top left > Explore Census Data.

Enter: DP03 > click DP03: SELECTED ECONOMIC CHARACTERISTICS (TableID DP03 is the "Data Profile 3")
b. Select the Tables tab and Tables on the left menu. By default, data is for the entire United States.
Step 3. Drill Down in Geography.
a. To drill down in Geography and compare data in a hierarchy of geographic entities, select Filter (in Table Results) of the left menu. Use the check boxes for specific geography selections.
Geography > County > Pennsylvania > check Centre County, Pennsylvania
also select
Geography > State > check Pennsylvania
also select
Geography > Zip Code Tabulation Area (ZBTA) > 16802 (State College, PA) for demographic information at the zip code level
b. Done with geography selections, click the chevron at the top right to hide the Geography topic menu

Step 4. Selecting a Census Product.
a. The American Community Survey (ACS) 1-Year Estimates provide data on a selected geography with a population >= 65,000 people. For more information on the ACS, reference Understanding and Using American Community Survey Data [14] (US Census Bureau, 2020).
b. The ACS 5-Year Estimates cover all geography in the United States and Territories.
select 2019: ACS 5-Year Estimates Data Profiles
c. Examine the data you have selected (perform Exploratory Data Analysis - EDA)
select Customizable Table button, then
Columns of Estimated totals, Percent of Population, and Margin of Error by geography (PA, Centre County, Zip 16802, State College)

d. This table is customizable:
Turn off Margin of Error, click +/- Margin of Error
Use Hide to unclick columns, e.g. you could unselect Estimate and leave Percent checked to view a percent of the Population rather than estimated totals.
Click the > symbol before Topics to expand or collapse information
Change the width of columns to your choice of layout or style
Export to CSV, Excel, or PDF; Print first page of data and/or table notes
Your result may look like :

Step 5. Analyze Demographic Data by ACS Topic and Geography.
a. Comparing statistics between Pennsylvania, Centre County, and State College
| Topic | Criteria | Pennsylvania | State College |
| Employment Status | Population >= 16 | 6,199,456 | 21,927 est. |
| Occupation | Service Occupations | 17.3% of workforce | 16.1% |
| Industry | Education, Health Care | 25.9% of workforce | 46.4% |
| Class of Worker | Government | 10.4% of workforce | 17.3% |
b. You could also add other zip codes in State College or the surrouding area to examine differences in economic data and factors. Changing the Employment Status and age groups introduces perspectives on demographics, citizens, sources of tax revenue, and possibly commuting patterns. A closer examination of the Industry criteria adds statistics of sectors of the economy, data on retail vs. University employment, and can be matched to other economic features.
Concluding Thoughts.
As you create maps, pay close attention to the actual geography these boundary features represent. We'll delve into this topic more thoroughly later in the course, but consider:
- Which boundary best represents what I think of as my "neighborhood"? Which boundary best represents what I think of as my "region"?
- Choose one boundary feature and consider, with attribute data captured at that level, for what purpose might it be useful? For example, what level of detail might I want to consider if I were planning to open a store?
- What considerations might I have to take into account when using data from a particular boundary feature?
- Consider the differences in what people think of and what geographic entities are available in the US Census database when you are showing a "neighborhood," a "region," "trade area," or "sales territory," etc. Keep in mind, we'll come back to geographies and scale throughout the course, and you'll likely refine your understanding.
Jot some notes as you work through these questions.
There is no Deliverable required for this Census activity.
2.3 Market Segmentation and Clustering in the U.S.
Market segmentation is a business strategy that involves dividing prospects (potential customers) into subsets or segments that have common needs, wants, desires, values, and priorities. Market segmentation enables organizations (organizations ranging from for-profit to not-for-profit) to target different categories of prospects who perceive the full value of certain products and services differently from one another.
Targeting or target marketing then entails deciding which potential customer segments the organization will focus on. Marketing segmentation always comes before targeting so an organization can be more selective marketing their products. It is assumed that by aggregating prospects into segments that have common characteristics and requirements, they will respond similarly to a marketing and selling action.
Business location analysis directly relates to other geospatial sciences and studies:
- Demographics and Geodemographics
- Psychographics (consumer behavior)
- Census data and segmentation
- Other geospatial information, e.g., physical geography, human geography, transportation networks, internet access, or infrastructure
Designing an effective Market Segmentation relates to business requirements and situation—a challenge or opportunity—which the business faces. How does the problem relate to market, location, consumers, customers, products, business operations, or supply chain distribution?
Customers have different needs and, for market segmentation to be practical, market segments should be evaluated against defined criteria or requirements. Early in my pharmaceutical sales career, a VP of Sales encouraged us to monitor our sales daily and understand the metrics used by the company to evaluate its performance. The VP added, "If something you're doing isn't measurable, it's a hobby." In the NetMBA reading, several criteria for segmenting customers, markets, or products include the following characteristics:
- Identifiable
- Accessible
- Substantial
- Unique Needs
- Durable
Elements of the segmentation may include business reporting, transforming consumers to customers, expanding current customer product choices, and reevaluating business goals. Analysts often need more data sources for marketing segmentation. Consider ideas on creating customized consumer experiences through omni-channel marketing:
- Asking questions: intelligent, pertinent, relevant
- Enrich data into useable, valuable georeferenced information
- Segmentation
- Data – location data
- Areas of interest – areas of influence
- Demographics
- Geography – relative or applicable regions of geographic relevance
- Consumer-driven commerce
- Digital economy
In Section 2.1, Moreno described applications of location data for enriching, analyzing, and visualizing georeferenced data. That’s important for an organization’s business development, marketing, and management departments. Current combinations of marketing and business principles establish market targeting as traditional, multi-channel, digital channel or omni-channel; improving a business strategic audience decision making and customer experiences.
Many economic sectors are grappling with the explosion of data from multiple sources and formats. We will examine the value of location data & location intelligence which geospatial analysis provides business decision makers, e.g., through Smartphone penetration, location infrastructure (cell towers, beacons, RFID, GPS), and the Internet of Things (IoT). Throughout the lessons, consider methods of enriching, analyzing, and visualizing location data.
Read:
- NetMBA's primer on "Market Segmentation [15]."
- Jamie Beckland's Mashable.com post "The End of Demographics: How Marketers Are Going Deeper With Personal Data [16]."
- Alex Andrade-Walz. 2018. Geodemographic Segmentation: The People Behind the Coordinates. Spatially. 7 Mar. 2018. Blog.
(Registered students can access the Andrade-Walz reading in Canvas on the Lesson 2 Readings page.)
Optional Reading:
- If these topics interest you, you may wish to bookmark the Center for Spatially Integrated Social Science: CSISS Classics [17].
- Patchwork Nation website [18] and associated work is often cited on PBS, in the Christian Science Monitor, and by other media outlets. Patchwork Nation "divides America's 3,141 counties into 12 community types based characteristics, such as income level, racial composition, employment and religion. It also breaks the nation’s 435 congressional districts into nine categories, using the same data points and clustering techniques."
The Claritas segmentation data is sourced from third-party national online surveys collecting population, financial, insurance, technology, and energy track data. Varied audiences or customers seek different data for understanding consumer preferences, market and geographic trends, and relationships in data to demographics. Claritas produces PRIZM Premier, P$YCLE Premier, ConneXions products for commercial customers.
- PRIZM Premier provides insights on demographics, household lifestyle and media preferences, shopping behaviors, and technology usage in 68 segments, 11 LifeStage Groups, and 14 Social Groups.
- P$YCLE Premier is built for financial marketing services connecting data on financial needs and behaviors of US households.
- ConneXions is designed for the technology and telecommunications industry to relate technology behaviors of connected consumers and adoption rates of new technology.
Activity: Explore Claritas PRIZM "My Best Segments."
This lesson is an introduction to demographic segmentation. You may or may not be familiar with Nielson Claritas segment information tool from previous courses. Claritas Zip code look-up tool lets you view your neighborhood's household segments by zip code. This data includes quick facts such as: population, median age, median income, and consumer spending in addition to the information shown nationally by segments within the segmentation system.
For this lesson, we will access the ZIP code look-up page and begin an overview of Claritas' segmentation. Please scroll to the bottom of the MyBestSegments [19] page where there is a grey box. Under the header "Tools", select "Segment Details" for information on segments or "ZIP Code Look-up."
(Note: you may have to launch the Segment Details and ZIP Code Look-up webpages using the links found inside the grey box shown in Figure 2.6 below. At times, a Stripmenu will appear for navigation so you will not have to use the links at the bottom of the page. It depends upon how you are redirected to MyBestSegments when you first launch the webpage. Additionally, if the site does not launch, try using a different browser.)
MyBestSegments Bottom Navigation Menu
- Learn More
- Using MyBestSegments
- What is Nielsen Segmentation?
- Claritas PRIZM | PSYCLE | ConneXions
- Using Segmentation
- Frequently Asked Questions
- Tools
- Segment Details
- ZIP Code Look-up
- More Info
- Nielsen.com
- Claritas360.claritas.com
You can practice by following the steps below:
- Go to MyBestSegments Zip Code Look-up.
- In Figure 2.7 below, the State College ZIP Code 16801 has been used for a sample Look-up (State College actually covers 4 ZIP Codes: 16801, 16803, 16804 & 16805).
- Now try a 5-digit ZIP code of a place with which you are familiar.
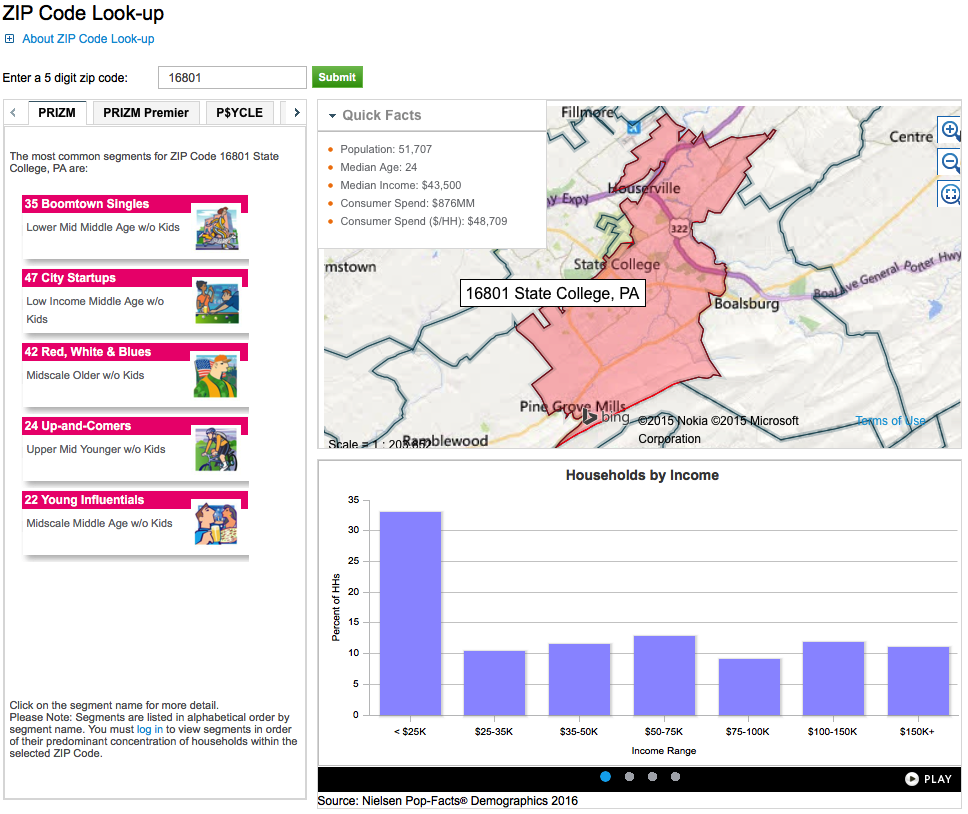
ZIP Code Lookup for 16801
- Quick Facts
- Population: 51,707
- Median Age: 24
- Median Income: 43,500
- Consumer Spend: $876MM
- Consumer Spend ($/HH): $48,709
- Common Segments for ZIP Code 16801 State College, PA
- 35 Boomtown Singles (Lower Mid Middle Age w/o Kids)
- 47 City Startups (Low Income Middle Age w/o Kids)
- 42 Red, White & Blues (Midscale Older w/o Kids)
- 24 Up-and-Comers (Upper Mid Younger w/o Kids)
- 22 Young Influentials (Midscale Middle Age w/o Kids)
- Households by income
Income Range Percent of HHs <$25K 33% $25K-35K 10% $35K-50K 12% $50K-75K 13% $75K-100K 9% $100-150K 12% $150K+ 11%
You will notice that there are some help links and tutorials in the top portion of the zip code look up page that may be beneficial for new users.
ZIP Code Data
The right side of the page (the portion that includes the map and the graphs below the map) contains information specific to the ZIP Code that was entered in the search field (see Figure 2.8). Below the map are four different graphs that display the data for the ZIP Code. These graphs can be manually scrolled from left to right by clicking on one of the four dots at the bottom of that section, or allowed to be scrolled through using the play-pause feature.
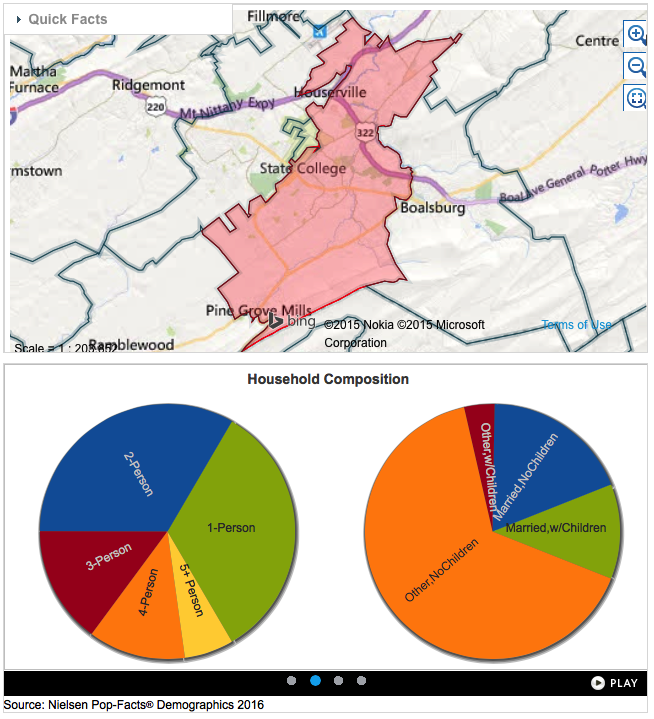
National Data Segments within the PRIZM Segmentation System
The left side of the page contains four segmentation system tabs: PRIZM, PRIZM Premier, P$ycle, and ConneXions. These tabs contain nationally based data that can be used in comparison to the local data (see Figure 2.9). Notice how the PRIZM tab data segments demographic collections which are the "most common" data segments for that particular zip code.
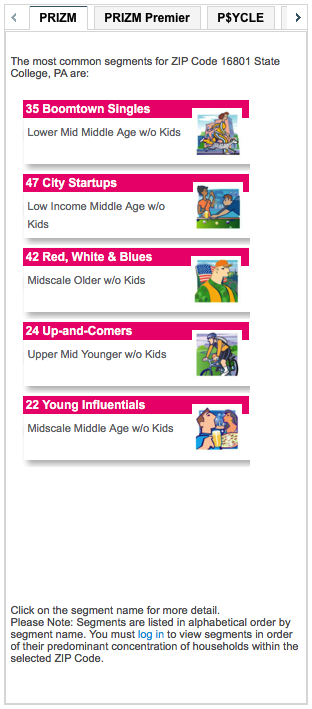
Select one of the PRIZM segment collections to view additional information. This will open a new web page with additional information. Keep in mind that the information contained in the tabs (PRIZM, P$ycle, and ConneXions) is national. You will notice a brief explanation of the segmentation with some clarification. Although there are a number of tabs, the free version of the zip code look-up site only displays data on the "snapshot" tab.
Your PRIZM Segment - Your Household
Review the segment page (Boomtown Singles, Country Squires, Traditional Times, Suburban Sprawl, etc.) within the PRIZM segmentation tab to find what segment best represents you or your household (see sample in Figure 2.10). Ask yourself the questions:
- What are the similarities and parallels between the data and how it relates to you or your neighborhood?
- What are the characteristics of the segment (that you chose) that relate to you?
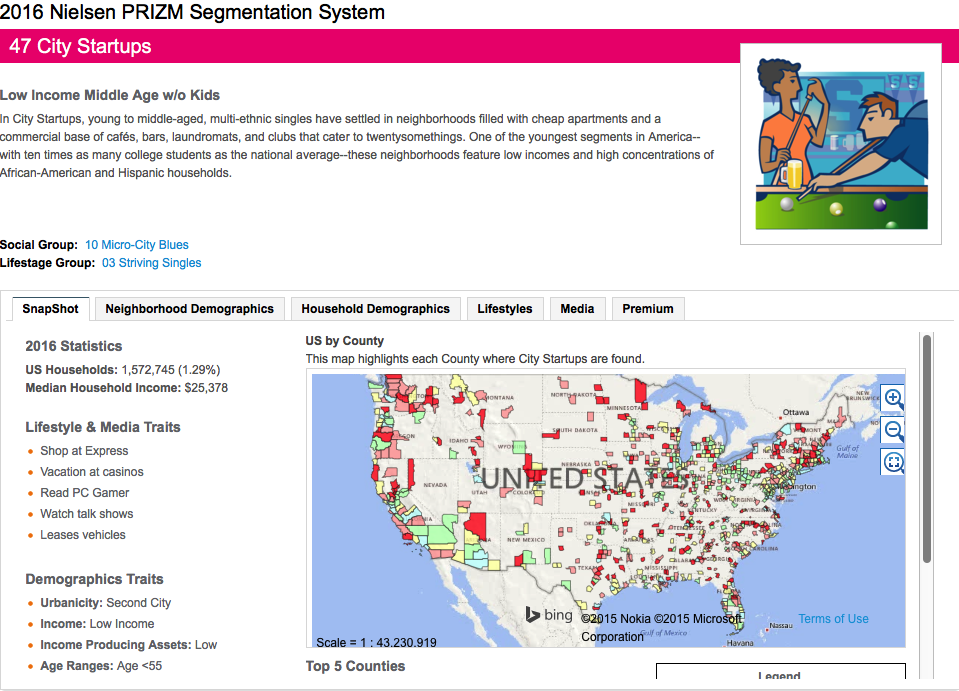
Snapshot of 47 City Startups
2016 Statistics
US Households: 1,572,745 (1.29%)
Median Household Income: $25,378
Lifestyle & Media Traits
- Shop at Express
- Vacation at casinos
- Read PC Gamer
- Watch talk shows
- Leases vehicles
Demographics Traits
- Urbanicity: Second City
- Income: Low Income
- Income Producing Assets: Low
- Age Ranges: Age <55
Social and Lifestage Groups:
Open the social group link for the segment that you have chosen. The link is located about a third of the way down on the segment page. This social group is an aggregation of multiple segments that have a common element. Consider what it is that these groups have in common to involve this segment. These groups are a coarser representation, grouping by factors that they have in common with the segment. Think about what is distinguishing the social and lifestage groups for your presentation. As we aggregate segments into a social or lifestage grouping, what patterns are we noticing that are in common?
It is also important to consider your Weiss readings and your work thus far the answer to the question, "What is different about Social and Lifestage groups? Do you see patterns, similarities, differences?"
This was a quick introduction to PRIZM. There will be additional exercises where you will be required to gather information from Claritas and PRIZM so be sure to practice with it and explore all of the features to become a little more familiar with it.
Important Note:
The "My Best Segments" search tool does NOT return all segment matches for your ZIP code. This free search tool provided by Nielsen/Claritas returns only the most common segments for each ZIP code, and these are NOT ranked--rather, they are listed alphabetically.
There could be more segments present in any given ZIP code--in coming weeks, we'll work with a different data, Esri Tapestry, for which we have full access, allowing us up to the top 20 segments. Again, for demonstration purposes here, if you don't find a segment which you feel adequately describes your household, choose one segment which you can clearly see present in your ZIP code.
Additional Help:
You may wish to refer to the Claritas 360: "Helping Companies Find Customers" Learn More [20]. You can also search for individual segments at the "Segment Look-Up" if you need to refer back after you've closed the search tool.
Deliverable Lesson 2.3 Activity: PRIZM "My Best Segments"
Using your screen captures from above, create a Word report or presentation with images to show your results to the class. Please submit your file in Canvas to the Lesson 2.3 Drop Box Presentation. The Drop Box is set so you will be able to see all submissions.
Slide one should show your ZIP code's list of PRIZM segments OR the single segment you felt best matched. On this slide comment on:
- which segment(s) best profile(s) your household (or which is clearly present in your ZIP code);
- your perception of the accuracy of at least one demographic variable and one psychographic trait/characteristic.
Slides two and three should show the "Social" Group and "Lifestage" groups which contain your chosen segment. (You may choose to include both groups on one slide, but please comment on each, in which case you will only have two slides total.) On each of these, comment on:
- any patterns you notice in the group (across all segments);
- what is different about Social versus Lifestage groups? (What characteristics is each grouping methodology focused on?)
Due Tuesday 11:59 pm (Eastern Time)
2.4 Comparing Segmentation Systems
2.4a. "My Best Segments"—Explore Nielsen/Claritas PRIZM, P$YCLE, and ConneXions.
Unfortunately, you cannot repeat your ZIP code search in "My Best Segments" and choose the "P$YCLE" tab from the three segmentation system choices to gain the actual segments in order unless you are a subscriber. Fortunately, the Segment Details page provides an interactive tool that lets you examine the four segment groups which belong to a "Lifestage Group."
- Determine the Nielsen PRIZM segment that best matches your household.
- Determine the Nielsen PRIZM Premier segment that best matches your household.
- Determine the Nielsen P$YCLE segment that best matches your household.
- Determine the Nielsen ConneXions segment that best matches your household.
Compare your findings across all four segmentation systems. The names for the like/similar segments won't be the same—they're different segmentation systems—but, if you chose carefully, you should see some consistency across the descriptions.
- What is different in the descriptions?
- Pay close attention to the "psychographic"/"behavioral" descriptions in each of your three segments.
2.4b. Introduce Claritas PRIZM with other market segmentation systems, e.g. MosaicUSA and CACI's ACORN.
Step 1.
Review your PRIZM segment, Lifestage Group, and Social Group.
Step 2.
Access the 2006 MosaicUSA Group and Type Descriptions [21] pdf. Review the MosaicUSA group structure, noting that there is only a single spectrum.
- Using the attributes which describe your PRIZM group(s), see if you can determine which MosaicUSA group compares to one of your PRIZM groups.
Step 3.
Once you've identified a corresponding MosaicUSA group, examine your previously used geography.
Step 4.
Access the MosaicUSA marketing brochure [22] and turn to page 5. Note the graphic for MosaicGlobal in the upper right corner. The two primary demographic dimensions (urban vs. rural and level of affluence) should now be quite familiar.
- Using your MosaicUSA selections and the graphic, identify which of the 10 MosaicGlobal groups your household likely falls within.
Step 5.
Now access CACI's ACORN [23] system which is used in the United Kingdom. Review page 3 of the PDF to get an understanding of the group structure in this system.
- Again, see if you can match your PRIZM group(s) to a specific group in ACORN. Also, see if you can match your PRIZM segment to a specific ACORN segment.
No Deliverable required for this activity
There are no deliverables for 2.4 Comparing Segmentation Systems. However, you must complete Quiz 1 as part of this week's assignments. (See Deliverable below.)
Deliverable:
Quiz 1: Geography, Location Intelligence, and Segmentation
Before moving on to this week's information about the term project, please remember to return to Lesson 2 module in Canvas to take the Quiz 1: Geography, Location Intelligence, and Segmentation
Due Tuesday night, 11:59 pm (Eastern Time). Check the calendar in Canvas for specific time frames and due dates.
2.5 Term Project – Brainstorm Project Ideas
In addition to the weekly activity, it is also time to start to think about your term project.
- Brainstorm a few ideas you have for your Term Project and share them with your classmates. For your idea or ideas, simply state in a sentence what location intelligence problem you would study.
- Respond to several classmates' ideas. I hope you also gain some insights to select and expand the goals of your personal topic.
Deliverable:
Post topic ideas to the 'Term Project — Project Topic Discussion Forum'. One new topic for each student, please! Even at this early stage, if you have constructive suggestions to make, then by all means make them by posting comments in reply to their topic.
Due Tuesday 11:59 pm (Eastern Time)
Note: Please refer to the Calendar in Canvas for specific time frames and due dates.
Questions? Please use the General Issues discussion forum to ask any questions now or at any point during this project. You'll find this forum listed under 'Term Project Discussion Forums' in the 'Modules' section in Canvas.
Lesson 3: GIS and Geospatial Analytical Modeling
3.0 Introduction to Lesson 3
Market Research provides relevant data to address the challenges that organizations face today and tomorrow. It is nearly impossible to segment a market or differentiate a product/service without market research. As such, it involves gathering, organizing, verifying, analyzing, and interpreting information that relates to the creation, delivery, and maintenance of products/services that meet or exceed customer expectations as they are positioned in the marketplace with respect to competitors.
For our purposes to develop location intelligence to solve business problems, brainstorm various sources of geospatial data which are relevant to the business question. Geospatial intelligence (GEOINT) analysts examine imagery and imagery products, imagery intelligence, and geospatial information for patterns, observations, changes, and to develop assessments. Similarly, geospatial analysts in the business, humanitarian, healthcare, or municipal sectors examine maps, geospatial data, GIS records, census data, imagery when applicable, geographic studies, and volumes of disparate data to develop location intelligence. Consider both geospatial concepts and business principles through the course to address each problem or assignment.
In this lesson, we will examine a geographic area within which an organization operates and draws most of its business. Site selection for a business doesn’t always refer to determining the most profitable real estate for a new store, coffee shop, or distribution center. It may also reflect:
- growing or shrinking a business chain in the right places & right ways (optimal for that business);
- identifying geospatial or human geography factors that influence Latin American customers to prefer certain product lines over South Asian customers;
- proximity isn’t always a least distance in a global eCommerce market.
A key feature is the advantage that location provides to the business: proximity to customers, markets, competitors, services, opportunities. Location intelligence is applying geospatial analysis to location-based business topics. To successfully accomplish this, you must have a thorough understanding of business strategies, geospatial science, and the analytical process involved. The purpose of a location intelligence study for business is not just marketing. The rationale may be using principles of location intelligence to discover customer behaviors and trends to predict future opportunities.
- Business expansion
- Planning and evaluating marketing campaigns
- Sales prediction and forecasting
- Store planning
- Product mix for customers, markets, or retail stores
- Supply chain networks
- Risk assessment
- Product inventory and asset management
As previously stated, begin each project or location intelligence project with the end in mind. How will the geospatial analyst present the results of their business problem modeling and location intelligence analysis to the project team, a decision maker, or requesting client? Geographic information systems (GIS) are often used to manage, analyze, visualize, and gain an understanding of geospatial data. Other courses in your graduate studies present far greater depth in the design of GIS, integrating GIS platforms into business operations, and managing data for an organization.
Learning Objectives
At the successful completion of Lesson 3, you should be able to:
- identify a trade area based upon demographic profile;
- identify a trade area based upon psychographic profile;
- identify physical and man-made features in a region (e.g. transportation networks) and discuss how these features can create a barrier to trade;
- describe how geocoding, thematic mapping, and buffer zones apply to market research;
- identify a Term Project topic relating to location intelligence.
- summarize ethics standards for data management
What is due for Lesson 3?
Lesson 3 will take us one week to complete. There are a number of required activities in this lesson, listed below. For assignment details, refer to the lesson page noted.
Note: Please refer to the Calendar in Canvas for specific time frames and due dates.
| 3.1 GIS & Geospatial Analysis | ||
|---|---|---|
| Requirements | Details | Access / Directions |
| Read | Read the course content. | Use the Lessons menu or the links below to continue moving through the lesson material. |
| Murray, Peter, 4 Ways Data Enrichment Can Improve Your Raw Business Data [24]. CARTO Blog: Location Intelligence. | Registered students can access the reading in Canvas on the Lesson 3 Readings page. | |
| GIS & Geospatial Analytic Modeling, Ch 1 | Registered students can access the reading in Canvas on the Lesson 3 Readings page. | |
| Links to other examples of Geospatial Analytical Modeling | Registered students can access the reading in Canvas on the Lesson 3 Readings page. | |
| Deliverable | No Deliverable | N/A |
| 3.2 Orientation to ESRI Business Analyst Online | ||
|---|---|---|
| Requirements | Details | Access / Directions |
| Read | Read the course content. | Use the Lessons menu or the links below to continue moving through the lesson material. |
| Miller, Case study and instructions, Getting to Know Business Analyst, Chapter 1 | Registered students can access the reading in Canvas on the Lesson 3 Readings page. | |
| Church, Business Site Selection, Location Analysis, and GIS, Chapter 1 (pp. 1-16) | Registered students can access the reading in Canvas on the Lesson 3 Readings page. | |
| Buckner, Site Selection, Chapter 6 "Prioritizing Markets" (pp. 74-84) | Registered students can access the reading in Canvas on the Lesson 3 Readings page. | |
| Murphy, Geography: Why It Matters, Chapter 3 "Places" excerpt (pp. 75-86) | The Geography: Why it Matters reading is from the required textbook. | |
| Optional Reading | Esri, Tapestry Life Mode Reference Tables. Tapestry Segmentation | Registered students can access the reading in Canvas on the Lesson 3 Readings page. |
| Spaeder, “How to Find the Best Location” | Registered students can access the reading in Canvas on the Lesson 3 Readings page. | |
| Deliverable | No Deliverable—post questions or comments if you wish. | Optional: post comment in Canvas on the Lesson 3.2 Open Discussion (Ungraded). |
| 3.3 Exploring Your Own Market, Part 1 | ||
|---|---|---|
| Requirements | Details | Access / Directions |
| Read | Read the course content. | Use the Lessons menu or the links below to continue moving through the lesson material. |
| Do | Exploring Your Own Market, Part 1 | Course text and in Canvas on the Lesson 3 Readings page. |
| Deliverable | Part I—Exploring Your Own Market, due Tuesday. | Submit in Canvas to the Lesson 3.3 Activity: Exploring Your market drop box. |
| 3.4 Ethics of Data Management | ||
|---|---|---|
| Requirements | Details | Access / Directions |
| Read | Read the course content. | Use the Lessons menu or the links below to continue moving through the lesson material. |
| Links to Ethical Decision Making references | Registered students can access the reading in Canvas on the Lesson 3 Readings page. | |
| Deliverable | No Deliverable | N/A |
| 3.5 Term Project Identifying Topic and Providing Peer Feedback | ||
|---|---|---|
| Requirements | Details | Access / Directions |
| Read | Read the course content. | Use the Lessons menu or the links below to continue moving through the lesson material. |
| Deliverable | Term Project – post your Project Topic and provide feedback to peers, due Tuesday. | Submit in Canvas to the Lesson 3.5 Term Project: Topic Idea drop box. |
3.1 GIS & Geospatial Analysis
One of the main objectives in this course is to enable you to:
- Design, develop, and critique geospatial analysis workflows to perform tasks, answer questions, and solve location-based business problems.
- To successfully accomplish this, you must be grounded in geospatial data science, be comfortable working with new geospatial software packages, use critical and analytical thinking.
- Evaluate and manage location data; enriching, analyzing, storing, and visualizing.
Segmenting Markets and Customers for business objectives causes a corresponding reorganization of geospatial data. Recognizing this connection expands one's ability to identify key factors, perform geospatial analysis, and design models of the business problem. Often the goal is to discover customer behaviors and trends to predict future opportunities and identify how location impacts the business strategies. Current analysis techniques include digital transformation of the organization's data, connected sensors, and the Internet of Things (IoT).
In Geography: why it matters, Murphy repeatedly emphasizes how people develop attachments to places and regions. Consider the human factor in geography and geospatial studies to understand why people live there or how a town formed at the confluence of a major river, convenient rail and road transportation routes, with arable land and space for large manufacturing operations. The base or foundation of a successful geospatial analysis examining a business problem begins with understanding the context of the market, demographics, consumer needs, history of that business and a connection to its location, and possibly unique factors that impede or support the organization's success.
People do not simply occupy or visit places; they develop attachments to them that influence what they do, how they think about the world, and even how they construct their own identities.
It follows that grasping the nature of places requires consideration not just of their overt characteristics, but also of the way people think about and experience them. In an influential 1976 study entitled Place and Placelessness, University of Toronto geographer Edward Relph looked at the proliferation of look-alike commercial strips in and around North American cities. Terming these "placeless landscapes" (because they are ubiquitous and ignore the individual characteristics of the places where they sprang up), Relph invited us to think about what happens when landscapes reflecting people's geographical and historical sensibilities are replaced with cookie-cutter urban developments that can be found anywhere. (Murphy, 2018, pp.75-76)
Geospatial Data Sourcing
A business directly and indirectly collects significant volumes of data on its market, customers, products, operations, and operating environment. Analysts are apt to find the data is both structured and semi-structured, requiring capabilities to store, process, and analyze non-conforming and dissimilar data formats. In order to perform a valid analyis of the data and form hypotheses or models of the business problem, additional information is typically required to connect location-based relationships, relate context to differences in quarterly sales reports, and discern anomalies from random observations. The additional information might include geospatial reference data, imagery, consumer marketing, social media, demographics, and typological physical and human geography features.
Advanced data sourcing provide opportunities to improve location intelligence and leverage the volume and velocity of geospatial data collected by IoT sensors, enterprise computer networks, and data mining techniques.
-
Human geography and social networking - studying human behavior with operational technologies to recognize, categorize, and interpret relationships of individuals, groups, and organizations.
-
Forecasting - process from operations research to anticipate events, trends or trendlines, or expected future results.
-
Crowdsourcing - operationalized process where individuals gather, share, and analyze geospatial information in a connected or online network. Access is provided for others to view or use the raw information and results of developed assessments.
Budgets often impact a department's access to business and geospatial data. Some businesses have large cash reserves or cash flow to purchase the volume and detailed data they require to effectively and profitably make decisions. Others must decide between purchasing data or operating the business. The timing of reports and subsequent analysis can provide an advantage to an organization that invests in current and well-organized third-party data. Savvy analysts seek alternative sources of geospatial data to return value to the organization, e.g. Cloud-based data services included in software licenses, crowdsourced information, and trade organization data.
Geospatial Analysis
Geospatial analysis is evolving with technological advances in:
-
Data Collection: prolific remote sensing, IoT smart communities, business data;
-
Data Management: cloud computing, AI, coding, and computing speed (SSD, 5G, storage);
-
Data Enrichment: access to open source imagery, news, and geospatial information;
-
Geospatial analysis;
-
Crowdsourcing, volunteered geographic information (VGI), alternatives to major or expensive location intelligence sources.
Collecting relevant and accurate data starts the geospatial analysis process. What is related to the business question, is data available, and who determines access? What data formats meet your analysis department’s IT system and schema? Typically, a business does not have all the georeferenced information available to fully develop location intelligence. What information is required to develop the next fiscal year's retail distribution strategy, to array an optimal bank branch distribution to reach consumers, or site planning for the healthcare industry?
Data enrichment adds geospatial, imagery, consumer marketing, social media, demographics, physical and human geography information to examine factors of the business problem. The geospatial professional designs, stores, and accesses a GIS that meets the needs of the business and geospatial analysis.
Data enrichment process that enhances, refines, or otherwise augments existing data, typically with imported datasets. Geospatial analysts geocode inconsistent data, augment routing information, enrich point data with Areas of Influence Analysis (isolines of relative information), and often incorporate demographic measures to get a better picture of the customer or target audience. (Murray, 2017)
O’Sullivan and Unwin describe geographic information analysis as investigating patterns found in spatial processes that may be operating in the space of points, lines, and fields. (O’Sullivan & Unwin, 2003:3) There are many methods of geospatial analysis; it's important to understand the functions of each analysis and match your choice to the factors of the business problem. What questions must be answered to reach a solution for that problem? Recognize how important the concepts of space and time have in analysis. Spatial analytics merge GIS with other types of data and analysis; at times requiring specialized geospatial software to dependably preserve network relationships. Spatial-temporal patterns indicate physical activiites and social behavior which relate to the business problem or modeling.
Geospatial analysis for location intelligence can be:
-
Descriptive: what happened?
-
Diagnostic: what’s happening now?
-
Predictive: what could happen?
-
Prescriptive: what should happen?
-
Optimized: what’s best to fit certain quantifiable business criteria?
Geo-Awareness
In your research, seek the most relevant, useful geospatial data sources or collections. Determine how the geospatial data meet your needs for metadata, scale, currency or timeliness. Location intelligence structured and unstructured data sources may be found in business systems, social media, embedded sensors (e.g., vehicle telematics), company portals, mobile apps, open source, third-party geospatial information, and complimentary information (e.g., insurance FIC scores, building repair costs, business formation data).
Today there is more geo-awareness - and those who are both aware of and using geospatial technologies enjoy a significant advantage - the geo-advantage. Geo-advantage comes from not only being aware of the technologies, but also of the data or information available, having access to that information, and knowing how the information can be used to provide a competitive advantage in the GeoEconomy. Together these can collectively be referred to as the geospatial infrastructure. (Ryerson, 2010, p.39-40)
Read
- Murray, Peter, 4 Ways Data Enrichment Can Improve Your Raw Business Data [24]. CARTO Blog: Location Intelligence.
Optional Readings
- David O’Sullivan and David J. Unwin. 2003. Geographic Information Analysis. Hoboken, NJ: John Wiley & Sons.
- Nathan Heazlewood. GIS GIGO (Garbage In Garbage Out): 30 checks for data error [25].
3.2 Orientation to Esri Business Analyst Online (BAO)
Read:
Miller, Getting to Know Esri Business Analyst, "Part I: Trade area analysis and site reporting with Esri Business Analyst Online" (pp. 2-6)
Registered students can access the reading in Canvas on the Lesson 3 Readings page.
The above reading is the introduction to a scenario from Miller's text which you can use to orient yourself to Esri's Business Analyst Online.
In this lesson, we provide a brief overview of Esri's Business Analyst Online (BAO). BAO includes Esri's most current business, demographic, and lifestyle data:
- Business Data: Refreshed data for the United States and Canada from Dun and Bradstreet.
- Esri's 2020/2025 US Updated Demographics: Accurate, current-year estimates and five-year projections capture changes to the US population such as growth and decline; increased diversity; aging; and changes to household types, home values, employment, and income.
- 2019/2024 US American Community Survey (ACS): Updated survey data from the Census Bureau. Variables include households with/without a disabled person and households using food stamps.
- Esri's 2020 Tapestry Segmentation: Tapestry reflects changes in the US population such as increased diversity, changing households, aging, and nontraditional families.
You will be receiving an email from the instructor with directions to access the Penn State licensed Esri Business Analyst Online, using your PSU username and password. The email provides access to the BAO system and class group work, so please be sure to check your Penn State email. Once logged into the site, you will notice that additional help documentation is available as well as instructional videos on the website.
- Log into Esri's BAO.
- Select the "Maps" tab.
- Choose "Define Areas for Reports."
- Select "Geography," search for your geography, enter ("Minneapolis, MN"), Go.
- Select the radio button for "Metropolitan Areas (CBSAs)," check Minneapolis-St. Paul, Click "Next."
- You should now have a polygon on the map around Minneapolis MN (see Figure 3.1).
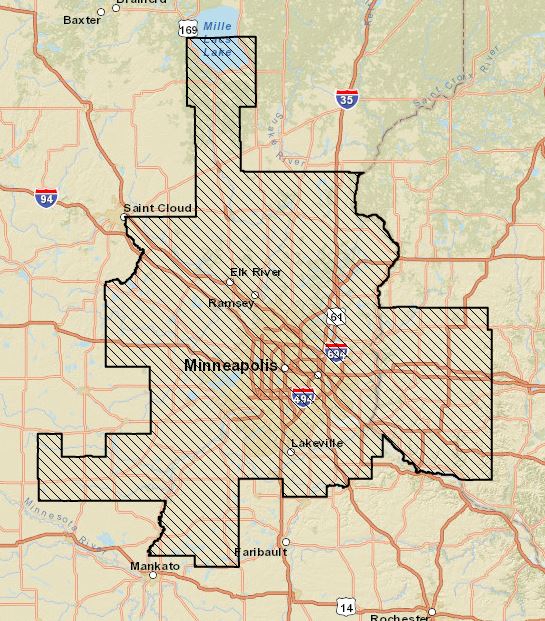
You can practice and improve your business analysis of a geographical area using Esri's BAO.
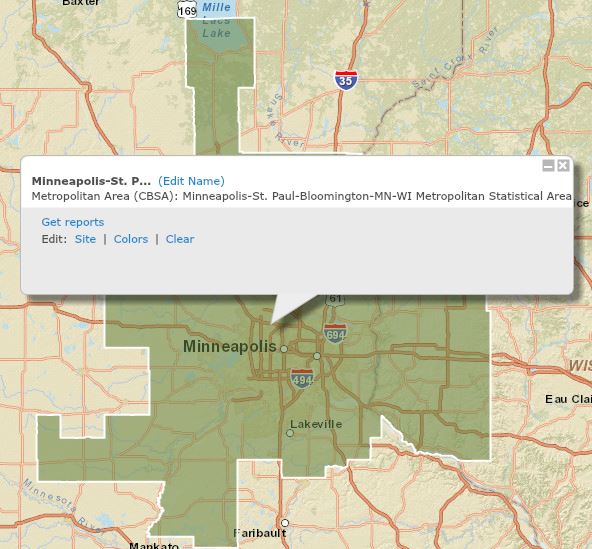
Upcoming assignments will involve creating choropleth maps and using Esri's Tapestry data on BAO. Familiarize yourself with those two topics by utilizing Esri's documentation and instructional videos to help you better understand how to display the information.
There are many techniques for statistically segmenting populations and geographies, each based on the collected or calculated data, scientific methodology, standards, and purpose of the segmentation. Esri builds their Tapestry market segmentation system from demographic and socioeconomic variables; identifying and labeling unique consumer markets throughout the U.S. (Esri Demographics, 2022). The Tapestry includes 67 market segments which are then summarized in 14 LifeMode and 6 Urbanization groups. Esri describes these where "LifeMode groups share similar demographic characteristics and consumer behavior patterns while Urbanization groups are based on the segment's geographic and physical features".
Tapestry Segmentation from the Esri website, Esri Demographics [26]:
LifeMode Groups
LifeMode groups represent markets that share a common experience-born in the same generation or immigration from another country, for example—or a significant demographic trait, such as affluence. Tapestry segments are classified into 14 LifeMode groups:
- LifeMode 1 Affluennt Estates
- LifeMode 2 Upscale Avenues
- LifeMode 3 Uptown Individuals
- LifeMode 4 Family Landscapes
- LifeMode 5 GenXurban
- LifeMode 6 Cozy Country Living
- LifeMode 7 Sprouting Explorers
- LifeMode 8 Middle Ground
- LifeMode 9 Senior Styles
- LifeMode 10 Rustic Outposts
- LifeMode 11 Midtown Singles
- LifeMode 12 Hometown
- LifeMode 13 Next Wave
- LifeMode 14 Scholars and Patriots
Urbanization Groups
Tapestry groups are also available as Urbanization summary groups, in which markets share similar locales, from the urban canyons of the largest cities to the rural lanes of villages or farms. Tapestry segments are classified into six JUIrbanization groups:
- Principal Urban Centers
- Urban Periphery
- Metro Cities
- Suburban Periphery
- Semirural
- Rural
There are open resources for learning Esri's Business Analyst Online:
- Be sure to visit the Esri site which offers a tutorial on the basics of creating a color-coded map that reviews all segments of the search without the specific search criteria [27].
- This one page will direct you to just about every feature in BAO. [28]
- See a demonstration of a few of the capabilities of BAO software as a service for small business for site-based location analysis. [29]
- A great video for GIS-trained people interested in how Business Analyst Online can integrate with ArcGIS Desktop. [30]
Note:
We will only complete the first part of this activity this week (Exploring Your Own Market, Part 1), continuing on with site selection next week.
Read
- Murphy, Geography: Why It Matters, Chapter 3 "Places" excerpt (pp. 75-86)
- Church/Murray, Business Site Selection, Location Analysis, and GIS, Chapter 1 (pp. 1-16)
- Buckner, Site Selection, Chapter 6 "Prioritizing Markets" (pp. 74-84)
- Esri. 2019. Tapestry Life Mode Reference Tables [31]. Tapestry Segmentation. Esri.
The Geography: Why it Matters reading is from the required textbook for this course.
Registered students can access the other readings in Canvas on the Lesson 3 Readings page.
Optional Readings
- Spaeder, Karen. E. 2019. How to Find the Best Location: A guide to scouting out a location for your food or retail business, sizing up demographics and getting the help you need [32]. Entrepreneur.
- Kerski, Joseph & Clark, Jill. 2019. GIS Guide to Public Domain Data. Esri Press.
- ArcGIS Hub open data portal. Esri. www.arcgisonline.com [33]
Registered students can access the reading in Canvas on the Lesson 3 Readings page.
Deliverable:
There are no deliverables for 3.2.
3.3 Exploring Your Own Market, Part 1
Activity - Exploring Your Own Market with Esri's Business Analyst Online (BAO), Part 1
Now is your chance to explore your own market!
Returning to some of the questions which came up as we worked through the material on segmentation, now turn to your own area of interest and investigate further. In this activity, you are free (and encouraged) to explore different data variables, levels of geography, data classification, and map design to illustrate your own market.
Spaeder (2019) reiterates that at startup, location may be the most important thing in preparing to open a food or retail business with a storefront. This activity reinforces four points the author highlights:
- Start with questions to develop criteria.
- Examine demographic data.
- Identify competitors.
- Seek professional help.
Your goal is to examine the demography of your area of interest with what you uncovered about your ZIP code in the previous activity. Though you do have the option to look at other levels of geography as well.
This activity will take place in two parts. In Part 1 (this week in Lesson 3), we will look primarily at demography and in Part 2 (next week in Lesson 4), we will continue with a deeper look at Esri's Tapestry segmentation.
Suggestions
- Do investigate your market in BAO first at the ZIP code level. Following the ZIP code, you will add to your investigation with other levels of geography.
- Do include an analysis of demographic attributes as you "ground truth" your market. You'll want to look at some of the key demographic variables (population, marital status, income, home tenure, children, etc) we discussed last week. However, small level Census geography results for the 2020 Census may not be available. It's fine to choose to use the Esri "20XX/20XX Demographics" modeled data OR the "ACS 20XX-20XX" averages (where "XX" represents the most current data years available), as the 2010 Census data may not be current enough for our purposes, and the 2020 data may not be fully available yet for smaller geographies.
- You may wish to spend a moment reviewing Esri's Tapestry Segmentation [34]. You'll find both a handy poster overview and a reference guide. In addition, you may wish to try to "match up" your PRIZM segment (much the way you did with Mosaic) to a corresponding segment in Tapestry BEFORE you start making maps. However, your goal this week is to consider demographic variables in Esri's software service. (You'll look at Tapestry segments for your area next week in more depth.)
- Feel free to have a discussion about the datasets you draw from, share tips, and pose questions in the discussion forum.
- DON'T wait until the last minute—DO start early, sharing findings and tips with each other, and asking questions if you get stuck.
Deliverable Lesson 3.3 Activity:
A Word .doc/.docx submitted to the Lesson 3.3 Drop Box - Exploring Your Own Market, Part 1 in Canvas. Your submission should include the following:
- A write-up describing what you found using your Esri BAO demographic research. Your write-up should be about 3-5 concise paragraphs and should include:
- The ZIP code or any other identification information you used in your search (choices of geographies by county, tract, block group, etc.)
- Highlight any key demographic variables that were included in the segment description.
- After introducing your observations at the ZIP code level, please choose one other geographic level that does an even better job of characterizing what you think of as your segment, and elaborate as you did with the ZIP code information.
- Characterization of your "place" (this may be your metropolitan area, city, town, etc.). Please consider if it is a CBSA and how it relates to the larger area (is your area core/central city, suburb, commuter town, etc?)
- Your BAO generated maps—at least 2 but no more than 4 images please—submitted as .jpg/.pdf.
- While your maps needn't be publication quality, please do make conscious choices about map extent, data classification and design (including a legend).
- Please include at least one map at the ZIP code level (showing your ZIP code, of course).
- Please include at least one map at the tract or block group level (justifying your rationale).
- Make sure your maps support your case!
Due Tuesday night 11:59 pm (Eastern Time).
3.4 Ethics of Data Management
As geospatial professionals, we have a duty to act responsibly, meet ethical standards in our work, and to respect the privacy of others. Simply because one can access data in a search does not automatically authorize an organization to use that data. An integrity challenge exists when researching open source, third-party, and proprietary data for analysis and writing.
An analyst must recognize the ethical considerations to understand whose information they found, how their actions may adversely impact the organization, and what is allowed. These ethics standards of business data apply to the collection, storage, and use of data for business decisions. Ensure that you understand the licensing rules of openly sourced data for proper citation, individual use, or dissemination.
When performing searches for geospatial or business information, one must ask questions to reflect on the ethics of storing, managing, and sharing the data:
- What information is allowed to be collected for this project or by my organization?
- What is the objective, what will be achieved using the data?
- Who's data did the search uncover?
- Will disclosure of the data harm any person or entity?
- Should I proceed? Do we have the right to include this?
- How can I achieve the project objective without creating an adverse event?
When designing a GIS, collectively planning business strategies, or creating a geospatial database for a specific project, one must consider the ethics of data:
- collection - citation, credit, attribution
- storage - permission for use, scope of access to one user or all in an organization
- use of data - copyright, trademark, secrets, ownership
The Geospatial Data Act of 2018 created a unifying policy covering the use and open sharing of geospatial data. The U.S. National Spatial Data Infrastructure (NSDI) establishes:
- National infrastructure for geospatial applications and services;
- Source of current and accurate geospatial data for open use from local to global access;
- Foundation of geospatial data to improve decision making in public and private sector;
- Resource for people and organizations working towards common goals.
While there are many stories and movies created to glamorize corporate spying, it is illegal under the Economic Espionage Act of 1996 to steal, misappropriate, sell, or pass along trade secrets that have a monetary value to a business.
Professional research conducted legally is appropriate, assists companies to optimize their operations and budgets, and potentially benefits consumers with access to products that meet their needs.
Read:
- Penn State University. Ethics Education for Geospatial Professionals Products [35]. GISProfessionals.org.
- University Consortium for Geographic Information Science (UCGIS). 2019 Professional and Practical Ethics of GIS&T [36].
- Tewelow, William. 2018. Geospatial Data Act will bring huge changes to America, and the world [37]. Geospatial Solutions. 14 Nov 2018.
- U.S. Department of Commerce. 2004. Business Ethics: A Manual for Managing a Responsible Business Enterprise in Emerging Market Economies [38]. Washington, D.C.: International Trade Administration.
Registered students can access the readings in the Lesson 3 Readings page in Canvas.
3.5 Term Project - Identifying a Topic and Providing Peer Feedback
Deliverable:
You will post your topic for the term project in Canvas to the Term Project: Topic Idea forum.
- Only a minimal description of the project is required at this stage, identifying a topic and its geographical scope. When I say minimal, I mean one or two paragraphs.
- Timely submission of your preliminary project topic and scope is worth up to 20 points of the total 300 points available for the term-long final project.
- You may find Esri BAO useful in your project, the economic and demographic data is available as a Penn State graduate student.
Then, comment on 2 other students' topic ideas. The more feedback given at this early stage the better your final project will be.
Due Tuesday 11:59 pm (Eastern Time)
Additional Term Project Notes:
Peer Review and finalizing your project proposal. Over the next few weeks, you will be refining your term project and receiving feedback from me and your peers.
Lesson 4: Competitive Factors in Business
4.0 Introduction to Lesson 4
As Buckner explained in Chapter 2, both "location" and "site" are market concepts that are rich with broad sets of data to characterize these geographic entities. In Lesson 3, your initial inquiry into the market you selected should have demonstrated the breadth of possible viewpoints one can use for market exploration and analysis. Site selection, therefore, can be amply supported by vast sources of relevant data. The business analysis challenge then becomes choosing the right factors to analyze and in which combinations.
Here, Church's 3 Laws of Location Science guide the market analyst to selecting the best suited data. These simple rules help us to home in to the most important criteria to pick among the vast repositories available. The result will be more efficient and effective analyses (Church, pp.8-9).
- Some locations are better than others for a given purpose.
- Spatial context can alter site efficiencies.
- Sites of an optimal multisite pattern must be selected simultaneously rather than independently, one at a time.
Before we settle into our data selections, we will expand our perspective further by exploring a second data source, the Esri Tapestry geolocation segments. While the Tapestry data is somewhat akin to the Nielsen PRIZM data in its purpose, the two sources provide unique points of view on similar underlying historical data. In this lesson, comparing and contrasting alternative geographic data will expand our analytical perspectives and prepare us for insightful analysis using GIS systems such as Esri's Business Analyst Online (BAO).
There's an important tenet of providing a unique customer experience. A company's effort should focus on solving a consumer's need with a product or service, drawing customers to your business, and creating a satisfying experience to build loyalty.
Learning Objectives
At the successful completion of Lesson 4, you should be able to:
- discuss the factors which contribute to site selection;
- discuss the scalar relationship between site/pad, zip code/census division, and region;
- identify variable inputs to spatial interaction models;
- identify a trade area based upon demographic profile;
- demonstrate the application of market research and site selection principles using a case study scenario; and
- draft an initial iteration of Term Project proposal.
What is due for Lesson 4?
Lesson 4 will take us one week to complete. There are a number of required activities in this lesson listed below. For assignment details, refer to the lesson page noted.
Note: Please refer to the Calendar in Canvas for specific time frames and due dates.
| 4.1 Competition, Trade Areas and Site Characteristics | ||
|---|---|---|
| Requirements | Details | Access / Directions |
| Read | Read the course content. | Use the Lessons menu or the links below to continue moving through the lesson material. |
| Buckner, Site Selection, Chapter 2, Chapter 3 excerpts (22 pp), Chapter 5 excerpts (4 pp) | Registered students can access the reading in Canvas on the Lesson 4 Readings page. | |
| Koontz, "Retail Location Theory" (pp. 174-177) Canvas, Lesson 4.1 Readings - Trade Areas and Sites | Registered students can access the reading in Canvas on the Lesson 4 Readings page. | |
| Skim | Buckner, Site Selection, excerpts from Chapter 8 | Registered students can access the reading in Canvas on the Lesson 4 Readings page. |
| Huff & McCallum, "Calibrating the Huff Model" (focusing on graphics on 7-27) | Registered students can access the reading in Canvas on the Lesson 4 Readings page. | |
| Read | Murphy, Geography, Why It Matters. Chapter 2 "Spaces" (pp. 31-59) | The Geography: Why it Matters reading is from the required textbook for this course. |
| Deliverable | No Deliverable for 4.1 | N/A |
| 4.2 The Competition, NAICS, (and SIC) | ||
|---|---|---|
| Requirements | Details | Access / Directions |
| Read | Read the course content. | Use the Lessons menu or the links below to continue moving through the lesson material. |
| Do | Site Visit to selected business. | Directions are provided in the course text. |
| Business classification search in NAICS. | Directions are provided in the course text. | |
| Deliverable | Post your Presentation to the forum, due Tuesday. | Submit in Canvas to the Lesson 4.2 - Your Local Business & NAICS forum. |
| 4.3 Exploring Your Own Market, Part 2 (Optional) | ||
|---|---|---|
| Requirements | Details | Access / Directions |
| Read | Read the course content. | Use the Lessons menu or the links below to continue moving through the lesson material. |
| Do (Optional) |
Exploring Your Own Market, Part 2 as practice | Canvas, Lesson 4.3, Exploring Your Own Market, Part 2 |
| Deliverable | No Deliverable for 4.3 | N/A |
| 4.4 Locating a Coffee Shop in Atlantic City | ||
|---|---|---|
| Requirements | Details | Access / Directions |
| Read | Read the course content. | Use the Lessons menu or the links below to continue moving through the lesson material. |
| Optional Reading | ICIC. 2014. The Missing Link: Clusters, Small Business Growth and Vibrant Urban Economies.July 2014 | Links to the readings are provided in the course text. |
| NAICS Association. 2013. How to Use NAICS & SIC Codes for Marketing. Whitepaper | Links to the readings are provided in the course text. | |
| NAICS Association. 2013. Cloning Your Best Customers for B2B Marketing Success. Whitepaper | Links to the readings are provided in the course text. | |
| Do | Complete Locating a Coffee Shop in Atlantic City activity. | Directions are provided in the course text. |
| Deliverable | Submit Locating a Coffee Shop in Atlantic City Presentation, due Tuesday. | Submit in Canvas to the Lesson 4.4 Activity: Locating a Coffee Shop in Atlantic City drop box. |
| Quiz 2: Competitive Factors in Business due Tuesday. |
Registered students can access the quiz in Canvas in the Lesson 4 module. | |
| 4.5 Term Project Submitting Project Proposal with Abstract | ||
|---|---|---|
| Requirements | Details | Access / Directions |
| Read | Read the course content. | Use the Lessons menu or the links below to continue moving through the lesson material. |
| Deliverable | Submit your Project Proposal with Abstract, due Tuesday. | Submit in Canvas to the Term Project: Project Proposal with Abstract drop box. |
4.1 Competition, Trade Areas, and Sites Characteristics
Competition
In striving to gain a market dominance or preference, businesses create advantages for their organization and consumers. The process drives competition and innovation to meet customer needs; often improving products or services beyond the initial designs of a company's plan. Companies analyze their market and improve strategies to gain advantages or disadvantage competitors. Interestingly enough, competition can be defined as seeking to gain or win something and contending for an achievement. Competition appears in multiple forms or environments:
a. A business Competitor, such as a corporation, firm, or commercial organization.
b. Competition between entitites, look at the pharmaceutical company direct-to-consumer (TV and Digital) advertising, or
c. Competitive environment, a market sector
Buyers, when purchasing goods or services, seek a simpler, more customized experience to select products and services that meet their particular needs. Many buyers may have exactly the same needs; but it's their choice to select where they shop, who they buy from, and which product(s) they select. A business designs products to meet needs and preferences, analyzes consumer behaviors to determine where to attract customers, and performs extensive business analysis to organize the retail experience.
Relating back to the principles of commerce, there are strategies to leveraging competitive factors in business in order to achieve and advantage:
- Business optimization and improving an organization to be the most attractive for customers to conduct their transactions
- Customer experience, to enjoy shopping or encounter the least pain to find the product one's seeking
- Financial improvements of decreased costs, increased reach to high potential customers, decreased ineffective customer leads, increased sales, or increased profit margins.
Competitive Location Data
Location analysis explores geospatial and business data to determine where to locate a business. Data is widely available and at times expensive. One must decide what is important about the geospatial and business data a company seeks; what level of detail, precision, and current information is needed. A business may use general marketplace information for strategic decisions or highly detailed to make a critical investment decision. Assumptions made in the early stages of business analysis are based on relevant information; and accurate geospatial information adds credibility to the stated assumptions.
Where - in what retail environment does a business sell products to its customers?
- At a physical site, e,g, brick-and-mortar, Big Box, or retail store, or
- Through e-Commerce, where products are shipped from the locations of business functions.
An online location can also be defined and optimized by selecting the best domain name for the business, launching online advertising campaigns, and employing search engine optimization (SEO) so consumers can find your business. SEO is a fundamental principle of online retail to attract as many potential buyers to a business website and e-Commerce applications.
To understand consumer behaviors and model their buying patterns, business location analysis also considers demographics, psychographics on consumer behavior, census, market information on channels and products, and geospatial data. Later lessons in the course introduce omni-channel marketing plans, use of technology and IoT to interact with customers, and integrated market research.
Companies develop tools and build databases for their Operations and Marketing professionals to view business functions in a similar format with the latest actionable data. Analytical tools include dashboards, ad-hoc analytics, extensive modeling and customer graphs. The Data Environment spans:
- Customers
- Marketing
- Channel
- All Sales and Service Interactions
Geospatial analysts have a role in predictive and prescriptive analysis for a business to identify the structure for their sales, product portfolio to meet customer needs and maximize profits, and decide between competing priorities facing the company in a competitive marketplace. Predictive analysis for location intelligence is based on modeling geospatial and business information to answer a business question. Other analysts in business departments, e.g. Marketing, Business Analytics, Operations, conduct business forecasting and strategic planning using similar or different data with more focus on quantitative results than geospatial relationships. One objective of this course is to expand the knowledge, modeling skills, and experience of geospatial data scientists to provide value across an organization's structure.
One could say, "businesses measure everything." Modern companies collect data on every transaction, each event in the manufacturing process, and consumer behaviors that may impact the products the company builds. Third-party data providers collect and analyze Big Data in enterprise and relational databases, preparing reports - or access to structured data - for businesses to purchase. This saves effort and, possibly, money for a business to gain the market and consumer data they specifically require to stay relevant.
Customer relationship management (CRM) is a business of itself with software, products, dashboards, interfaces for sales and marketing, and connections to marketing campaigns. CRM always has a location component; providing a linkage of business and geospatial data to produce location intelligence. A known customer who willingly or passively provides purchasing data assists a business in market studies. Consider the questions a business may ask to understand, quantify, or verify their market position compared to competitors. Third-party providers detail and summarize consumer behavior to relate:
- Which marketing message a customer viewed and the products they recently purchased,
- How many competitor's products the customer purchased and whether they bought from this business,
- Where the customer purchased different items, the volume and frequency of shopping, how many items/sale at various store locations,
- Through demographics, what group is a customer most similar to?
Every encounter with a potential customer costs a business money; whether that is through marketing, paying employees for extended hours, answering detailed customer questions, providing live customer-service, or reorganizing retail spaces to address consumer changing preferences. A current CRM provides the business detailed information about customer behaviors for market and location intelligence analysis. To understand the value of using their own customer's information, a business must only look at the wasted dollars spent on direct mail advertising campaigns that never attract a new customer or digital ads on Social Media platforms where users click "Skip Ad" and rarely access the company's product website.
A valid customer lead, pre-vetted contact information, or request for contact from a potential customer provides a company advantages over their competitors. The challenge is to recognize these leads, respond to customers, and provide the products they need or desire.
Trade Areas
For a community, a trade area is an economic zone with generalized or defined geographic boundaries. This is a region where commercial organizations conduct business, where stores are sited for customers to purchase goods, business entitities lease or own space to engage with clients and perform services, or buildings are erected to offer space to attract commerce. A trade area may be determined by the farthest distance a consumer is willing to travel to purchase goods they need; communities often designate trade areas in a convenient location for citizens to purchase goods or services (optimizing time, effort, and value).
Murphy (2018, p.36) describes a geographer's approach to spatial arrangements:
They seek to identify and explain the significance of spatial patterns. They explore what variations across space tell us about the forces shaping biophysical and human processes. They investigate the nature and meaning of interconnections across space and scale. And they look critically at the spatial ideas and frameworks humans use to understand, navigate, and seek to change the world around them.
Site Characteristics
Buckner relates how site characteristics describe the qualities of a location rather than quantitative measures. While there is amazing competition between retailers over the "best" anchor position in a shopping mall, human factors significantly impact the potential sales of a business location. Detailed market studies consider all factors to include visibility for consumers, parking, accessibility to shop for products; and most importantly, assess the context and relation of characteristics to the community (Buckner, pp.70-73).
We find value in examining variations from place to place. Murphy discusses the interconnections across space and scale for readers to understand that a site, a store, or an event exists in relation to other places or factors. Studying the attributes of one individual place reveals a response or adaptation from the characteristics of another, proximal space. Communities and economies depend on trade, customers, competition, and development. Question how a trade area expanded in an area of the city, why certain shopping areas are busier or more profitable than others, and where consumers may prefer to shop in the future. Thinking critically of geography, technology, mobility, and human behavior, Murphy writes:
Another revolution in mobility and connectivity is looming - driven not by a single transformative invention but by a suite of technological innovations and social-environmental concerns that are likely to have profound consequences in the years ahead: driverless cars, electric vehicles of various sorts, ride-sharing, super-high-speed trains, and an increasingly pervasive internet. Collectively, these will influence how billions of people experience and comprehend the world around them.
Read:
- Buckner, Site Selection, Chapter 2 (pp. 9-23)
- Buckner, Site Selection, Chapter 3 excerpts (pp. 24-26, 28, 37-39, and 46-48)
- Buckner, Site Selection, Chapter 5: Competitive and Site Characteristics Analysis (excerpts pp. 70-73)
- "Retail Location Theory" (focusing on 174-177)
- (Skim): Site Selection, excerpts from Chapter 8 (13 pp)
- (Skim): "Calibrating the Huff Model" (focusing on graphics on 7-27)
Registered students can access the reading in Canvas on the Lesson 4 Readings page.
Read:
- Murphy, Geography: Why It Matters, Chapter 2 "Spaces" (pp. 31-59)
The Geography: Why it Matters reading is from the required textbook for this course.
Note:
You may be thinking the Buckner book can, at times, seem a bit dated. In some ways, it is—Site Selection was written in the mid-1990s as a part of a series on retail planning by Chain Store Age magazine (a great resource for LI as it relates to retail). Bob Buckner is, however, to this day, one of the key figures in market research and site selection. He and his contemporaries were and are at the frontier of pushing what modern GIS and statistical analysis can do in terms of site selection.
4.2 "The Competition", NAICS, (and SIC)
One way to investigate "the competition" is to determine other businesses which fall into the same classification as our business of interest. Buckner mentions Standard Industry Classification (SIC) codes in the readings. The North American Industry Classification System (NAICS) replaced SIC for the 2002 Economic Census and going forward (and correlates to codes used in Mexico and Canada—part of the North American Free Trade Association, or NAFTA). In your exploration of business classification, investigate NAICS and related topics:
- Review the "Introduction" to the North American Industry Classification System (NAICS) [39] on the US Census Bureau website.
- Using the 2022 NAICS Search tool [40] on the same page, identify the NAICS code for the business you select in the Do: Site Visit to Your Selected Business activity below.
- The US Government discontinued use of the Standard Industry Classification (SIC) [41] groupings in 1997. While SIC codes have been replaced by NAICS, you'll still find instances where knowing a SIC code, or how to find it, is valuable.
- You may also reference the System for Award Maintenance (SAM) [42] for additional information on NAICS, DUNS, and legal name for commercial entities doing business with the US Federal Government.
- OPTIONAL: Returning to the 2022 NAICS Main page, locate the North American Product Classification System (NAPCS) [43]. Skim though NAPCS material until you can answer the following question—what is the value of NAPCS if we already have NAICS?
Do: Site Visit to Your Selected Business
Consider this activity our virtual class "field trip"—one which you'll do independently, however. You are selecting a site location, so choose something interesting; but with COVID-19 in mind, you are definitely not required to physically go to any retail establishment or store.
If you are performing a remote drive-by reconnaissance, make sure you have a way to take notes and photos with your smartphone or digital camera.
Note:
I recognize that much of this kind of research can, and is, now done online in our digital age.
- Choose a nearby location of one of the following retailers (preferably one that you actually shop at!): Best Buy, Target, Albertsons Companies supermarkets, Bed Bath & Beyond, ACE, Lowe’s (or some other national retailer with which the class will be familiar).
- Complete the sample "site evaluation form" in Figures 5-2 and 5-3 (Buckner, Site Selection, Chapter 5).
- Add to the form comments about accessibility, "synergy," and safety/security from the reading.
- Obtain images through a web search, take a picture of the site, or sketch a diagram/capture a map which illustrates a point you wish to make - likely about parking, signage, synergy/adjacency to other retailers.
Deliverable:
BRIEFLY summarize your results in a report or presentation.
- Always include a cover page or title slide (not included in a page count)
- 3 or 4 slides or pages of content is appropriate
- Include visualziations, images, or figures and cite properly. A useful citation reference is the Purdue OWL Citation Reference [44].
- What has changed with malls or shopping centers? How would you describe spatial relationships of business locations?
Step 1
Your image (your sketch, a map clip of your location, or a digital photo) will help us visualize your site survey analysis. Please paste your image on slide or page 1.
Step 2
After your site visit, include the following comments:
- name of store, and any distinctive store features ("SuperStore", two-level where most are one, special shop-in-shops such as Magnolia in Best Buy);
- approximate location within your metro area (including any anecdotal information) with a brief, useful description —possibly suburb/urban core, characteristics of the geographic area, proximity to other retailers, human geogrpahy notations, etc.;
- your NAICS classification of this store (type of business);
- list three competitors to your business and any observations resulting from your search;
- a summary of your evaluation of the site (don't cover every detail, but DO point out anything which stood out/surprised you).
Step 3
Please drop your PowerPoint in Canvas in the Lesson 4.2 - Your Local Business & NAICS drop box.
Due Tuesday night 11:59 pm (Eastern Time).
4.3 (Optional Activity) Exploring Your Own Market, Part 2
Psychographic/Behavioral Analysis and Incorporate Reports
Follow this optional exercise to hone your BAO skills, gain additional insights to a location intelligence platform, or use to expand your understanding of site selection.
Using BAO, return to your analysis/critique of your Claritas PRIZM results. You're going to add to the demographic work you did in section 3.3 of Lesson 3 by looking at Tapestry Segmentation, amongst other reports.
Your goal here is to further strengthen the argument you made last week concerning the accuracy or inaccuracy of your Claritas PRIZM results. Again, I recommend you focus on your PRIZM segment(s) to keep this analysis simple. Also, please make sure you start with ZIP code data, only turning to smaller level geographies, if you wish, to underscore your argument.
Requirements:
- Run at least two reports for your ZIP code level analysis.
- Run a "Tapestry Segmentation Area Profile" report on your ZIP code to rank the segments which make up your specific ZIP code. Use this report to identify top segments and make your comparisons to your Claritas PRIZM results.
- NOTE: to be fair to the oversimplified Claritas PRIZM "You Are Where You Live" tool, please focus on the top 5 Esri Tapestry segments first. Don't forget; your Claritas PRIZM results were NOT ranked, but delivered to you in alphabetical order.
- If you took issue with the ZIP code level results of the PRIZM tool, run the "Tapestry Segmentation Area Profile" on your tract and/or block group and see if your results (segments) more accurately match YOU.
- In comparing your Tapestry segments to PRIZM segments, don't forget to consider how Tapestry's "Urbanization" and LifeMode" segment groups compare to PRIZM's "Social" and "Lifestage" segment groups.
Suggestions:
- As you learned in Part II of your BAO orientation, "Market Profile" and "Executive Summary" are good places to start; they characterize your geography (and will quickly highlight the demography you investigated last week).
- You may have identified one purchasing/buying choice ("these people all drive SUV's") in your Claritas PRIZM segment which you questioned;t here may be a report in "Consumer Spending" or "Business" which further validates your position.
- As a comparison of your ZIP code's dominant Esri Tapestry segments with your ZIP code's dominant Claritas PRIZM;make sure you're comparing "top 5" to "top 5." Use these questions to help:
- How similar was/were the top segment(s) in the two systems? Consider the names of the segments and the demographic/psychographic attributes the systems claim for each.
- Was your ZIP code accurately portrayed in Tapestry?
- If you didn't feel that the top 5 Claritas/Tapestry segments matched you personally, was there a segment further down the list that did? What proportion of your ZIP code is "your" segment?
- If you looked at segments at the tract or block group level, were your results more accurate?
Because this is an optional activity, there is no deliverable for 4.3.
4.4 Locating a Coffee Shop in Atlantic City
Read the following carefully—you may wish to print this page out to use as a checklist as you complete items.
In this semi-scripted activity, you'll have a chance to practice some of the research skills you have developed so far and practice presenting your results clearly and concisely to your classmates. In addition, this activity should serve as good practice for the term project you will complete during Lessons 5-10 of the course.
Activity Scenario: Locating a Coffee Shop in Atlantic City
You are a geospatial analyst for a small consulting firm based on the East Coast--"Retail Research" with experience in location intelligence studies. Clients Jay and Kay contacted you about starting a coffee shop business in Atlantic City, NJ. They are targeting the seaside resort of Atlantic City and would like to open a franchise. The entrepreneurs have been loyal customers of the specialty coffee chain "Campfire Coffee," a cowboy-themed coffee shop which has successful franchises located primarily in the western cities of Denver, Phoenix, Albuquerque, El Paso, Austin, and San Antonio. They are friends with the Campfire Coffee V.P. of Franchise Marketing. All think the time is right to attempt a location on the East Coast and agree that the raucous gaming town of Atlantic City might be a good place for a location, especially considering the flashy or gaudy nature of Atlantic City. Your job is to perform the initial phases of market research and analysis for Jay and Kay.
To help direct your research, the entrepreneurs have already done some legwork. Having spoken to both the local chamber of commerce and the region's business development office, they are considering two possible areas of location in and around Atlantic City:
- a walk-in style coffee house in the central business/tourist district of Atlantic City
- a drive-through location in adjacent Pleasantville. (Local residents and long-term vacationers either live in or drive through Pleasantville regularly on their way to the core of Atlantic City.)
Campfire Coffee is not ready to choose a specific site, so you needn't consider site characteristics such as strip mall or stand alone, lease options, or the like. Rather, they want to make sure that the location meets their basic trade area criteria. While they are not ready to make a site-specific decision, the group is willing to consider any specific sites if an obvious candidate shows up in your research.
Guidelines
The following guidelines MUST be incorporated in your analysis.
- Campfire Coffee has had equal success with both walk-in and drive-through coffee shops, so either concept type is an option. Consider both possible areas of location.
- Campfire Coffee prefers locations where relevant market potential indices (MPI) are, for the most part, greater than the US average.
- Campfire Coffee is generally only interested in locations where there is a market demand (Esri BAO calls this "leakage").
First, you must decide before continuing if you’re recommending a location:
- close to direct competitors in a clustering approach [ICIC ], leveraging economy of scale and concentrations of customers, or
- at a distance away from competitors to gain a competitive advantage, drawing coffee drinkers to your site.
Then, are you recommending a walk-in location or a drive-through location?
For a possible walk-in location:
- will only consider along Atlantic Boulevard or to the south (towards the ocean/beachfront) in the boardwalk/casino district, roughly bounded by Albany Ave to the west and New Jersey Ave to the east.
- should be located at least .25 miles (0.4 km) away from any competitor (Starbucks, Dunkin Donuts, etc.).
- should be located at least .25 miles (0.4 km) away from any Atlantic City casino/hotel. (The chamber of commerce informed us that all Atlantic City casinos/hotels have coffee shops/espresso stands located inside, hence casinos/hotels are also competitors in this scenario.)
For a possible drive-through location:
- will consider anywhere in Pleasantville City (proper, within the municipal boundaries or immediately adjacent).
- must be located at least 1 mile (1.6 km) away from any direct competitor (Starbucks, Dunkin Donuts, etc).
- must be located on or very near (around the corner from) an arterial street with an average daily traffic volume (ADT) greater than 15,000.
Suggestions/Hints
- While YOU are the consultant working on this analysis for Jay & Kay, you're welcome to ask any of your colleagues (e.g., your classmates!) for thoughts/help/suggestions. There's not a Discussion page to post a comment. If you wish, you can email All Students and Instruction in this GEOG 850 Section.
- Don't forget about the very helpful, and easy to navigate "Help" for BAO, accessed in the upper right-hand corner of your BAO interface.
- In searching geographies, you may find it easier to draw a polygon when you have an imposed trade area (such as the "boardwalk/casino district" indicated above).
- You can practice by following the instructions below for creating a polygon (and managing your sites) for State College, PA (Fig. 4.1):
- Log into Esri's BAO site.
- Create a new "Project."
- Select the "Maps" tab.
- Choose the tab "Define Areas for Reports."
- "Find location" and search for State College, PA.
- Again choose the tab "Define Areas for Reports", then "Draw a Polygon" (if you have a basemap other than streets, it may not allow you to zoom in to an effective scale).
- Select the "Polygon" button and draw a polygon around the Penn State campus (see Figure 4.1 below). There is an instructional video available on the BAO webpage if you need assistance.
- Name the polygon as "Penn_State_Univ" when you finish closing the polygon.
- Open your Project and all of the files will be in that project.
- Note: There are a number of help documents and instructional videos throughout the BAO site. Be sure to take a few minutes and look them over as they are very helpful.
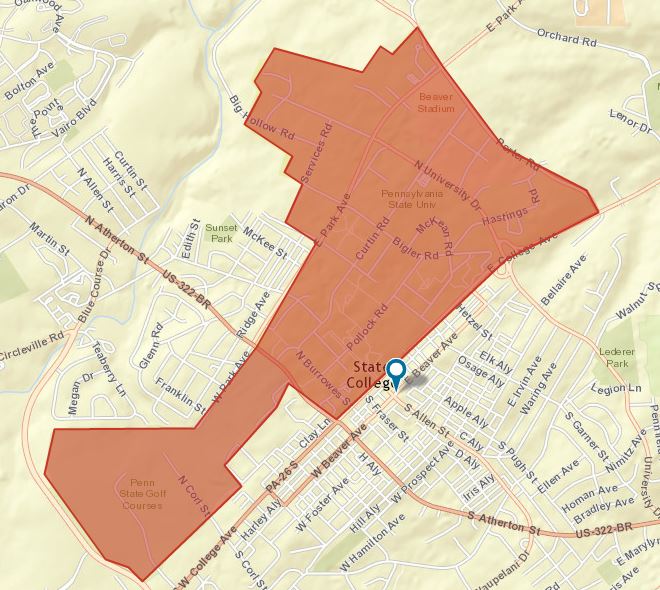
- "Retail Market Potential" and "Restaurant Market Potential" reports are great sources for market potential indices (MPI).
- The "Traffic Count Map" report is a great resource for determining average daily traffic (ADT) volume.
- Use "Custom Data Setup" after selecting the "Add Data" tab to locate your competitors. By zooming your map in to only your area of interest, your competitor search will be limited to the viewed extent. In the search bar, you have many options for example InfoGroup July 2016. NOTE: Under "Advanced Search Options" you can search by NAICS Code or keyword. Lastly, your search may produce some results (especially if you use keywords) that you may not wish to consider as competitors—make sure you uncheck those before adding a point layer to your research.
- You can practice by following the steps below for "Business Search":
- Let's examine the competitive business sites using Esri’s Business Analyst Online (BAO). In particular, we will look at coffee shops in and around Penn State University Main Campus.
- The Census Bureau uses the North American Industry Classification System (NAICS) to classify businesses for the purpose of collecting and analyzing data. Additional information can be found on the NAICS site [45].
- Log into Esri's BAO.
- Go to the " Penn_State_Univ" Project.
- Proceed to the Maps tab, create maps from data, Business and Facility Search, show more options.
- In the “Search Extent” field, choose “Current Map Extent” to get a better image of the area around campus.
- Now we need to search for a type of business. For this exercise, it will be coffee shops.
- To search for the NAICS number for coffee shops:
- Select the NAICS Code directory link within “Search for a business or a facility.” (Please note that the US Census site provides the NAICS codes for different years in case you have old codes that need updates.)
- Choose (72, Accommodation and Food Services).
- Coffee shops would fall under the “Snack and Nonalcoholic Beverage Bars” category so the NAICS number would be 722515.
- Select (722515, Snack and Nonalcoholic Beverage Bars) to show additional information and a breakdown of business types within that category are available by selecting the “722515” link.
- Continue with the search, for NAICS Code, enter 722515.
- Select the “Go” button (See Figures 5.2 and 5.3 below).
- From this point, you can further filter out your search results by unchecking categories from the search results, limiting by the number of employees, or by sales volume.
- Click next and give your search a name to save it for future reference.
- Suggestion: You may want to think about building rings around your competitor points to help you visualize possible sites.
- If you do locate a desirable site, building rings, drive-times, or donuts around a candidate site could provide further insight.
Caveats
- There isn't a single "correct answer." Your results will depend upon how you chose to evaluate the market (level of geography, variables, etc.).
- Any case study is bound to contain some obstacles unlikely to be encountered "in the real world"—in the real world, you could ask questions of the entrepreneurs, and hopefully you would have access to some kind of comparative store data. Don't let this deter you—make the best recommendation with the information at your disposal. And don't hesitate to be creative—you're welcome to use functions of BAO beyond the aforementioned.
Optional Reading:
- ICIC. 2014. The Missing Link: Clusters, Small Business Growth and Vibrant Urban Economies [46]. JP Morgan Chase & Co. July 2014.
- NAICS Association. 2013. How to Use NAICS & SIC Codes for Marketing [47]. Whitepaper.
- NAICS Association. 2013. Cloning Your Best Customers for B2B Marketing Success [48]. Whitepaper.
Deliverable: Locating a Coffee Shop in Atlantic City
Create a PowerPoint Presentation from your sequence of slides/images/maps/reports with your comments annotating the presentation.
The entrepreneurs are busy developing their business plan—you must complete your presentation in less than 10 minutes, preferably in less than 5 minutes. Approximately five slides would be ideal, though, again, your only limitation is that you should complete your findings presentation in 5 minutes or less. Please include the following in your PowerPoint Presentation and drop it in Canvas in the Lesson 4.4 Activity: Locating a Coffee Shop in Atlantic City drop box.
- A map of your proposed trade area (Atlantic City or Pleasantville) with any relevant polygon and point layers visible and symbolized (obviously, you'll be indicating the walk-in or drive-through concept based upon your selection?)
- Report(s) which evidence the results of your analysis and address Campfire Coffee guidelines. NOTE: You may wish to clip the report to highlight elements you wish to be clearly visible in your presentation.
- Your explanation/rationale for your suggestions as commentary to your images.
- In setting the tone/style of your presentation, imagine that you're sitting down with the entrepreneurs at your desk showing a first pass of your analysis informally.
Your grade will be based how well you make your case both in terms of evidence and presentation, albeit, again, with an informal tone.
Due Tuesday night 11:59 pm (Eastern Time). Check the calendar in Canvas for specific time frames and due dates.
Deliverable:
Quiz 2: Competitive Factors in Business
Before moving on to this weeks information about the term project, please remember to return to Lesson 4 module in Canvas to take the Quiz 2: Competition, Sensors, and IoT
Due Tuesday night 11:59 pm (Eastern Time). Check the calendar in Canvas for specific time frames and due dates.
4.5 Term Project – Finalizing and Submitting a Project Proposal
This week, you must organize your thinking about the term project by developing your topic/scope from last week into a short proposal.
Submit a brief project proposal (1 page) to the assignment box. This week, you should start to obtain the data you will need for your project. The proposal must identify at least two likely data sources for the project work, since this will be critical to success in the final project. Over the next few weeks, you will be refining your proposal.
Your proposal should include:
Background:
- What is your business question which will benefit from location intelligence?
- Some background on the topic, particularly why it is interesting
- What, specifically, do you hope to find out?
- Geographical scope, scale, and location(s)
Methodology:
- Data: list and discuss the data required to answer the question(s). Be sure to clearly explain the role each dataset will play.
- Be sure to list where you will obtain the required data. This may be public websites or perhaps data that you have access to through work or personal contacts.
- Obtain and explore the data: attributes, resolutions, scale.
- Is the data useful or are there limitations?
- Will you need to clean and organize the data in order to use it?
- Obtain and explore the data: attributes, resolutions, scale.
- Analysis: what you will do with the data, in general terms
- What sort of statistical analysis and spatial analysis do you intend to carry out? Skim through the lessons to identify the methods you will be using. If you don't know the technical names for the types of analysis you would like to do, then at least try to describe the types of things you would like to be able to say after finishing the analysis (e.g., one distribution is more clustered than another). This will give me and other students a firmer basis for making constructive suggestions about the options available to you. Also, look through the course topics for ideas.
Expected Results:
- What sort of maps or outputs you will create
References:
- References to papers you may have cited in the background or methods section. Include URLs to data sources here (if you didn't include the URLs in the Data section.
- The proposal does not have to be detailed at this stage. Your proposal should be no longer than about 1 page (max.). Make sure that your proposal covers all the above points, so that I (Lesson 3 & 4) and others (Lesson 5 – peer review) evaluating the proposal can make constructive suggestions about additions, changes, other sources of data, and so on.
- Additional writing and formatting guidelines are provided in the document (TermProjectGuidelines.pdf) in 'Term Project Overview ' in Canvas.
Refine your work and post a final proposal to the 'Term Project Discussion' board as plain text.
As you all finalizing your project proposals, consider the following aspects:
- Are the goals reasonable and achievable? It is a common mistake to aim too high and attempt to do too much. Suggest possible amendments to the proposals' aims that might make them more achievable in the time frame.
- Are the data adequate for the task proposed? Do you foresee problems in obtaining or organizing the data? Suggest how these problems could be avoided.
- Are the proposed analysis methods appropriate? Suggest alternative methods or enhancements to the proposed methods that would also help.
- Provide any additional input that you feel is appropriate. This could include suggestions for additional outputs (e.g., maps) not specifically mentioned by the author, or suggestions as to further data sources, relevant things to read, relevant other examples to look at, and so on.
- Begin drafting an Abstract for your project. There are various ways to effectively write an abstract that effectively captures a reader's attention to take the time to read your project, article, or message. We'll discuss several common abstract formats for geospatial analysis writing.
Deliverable:
Submit your project proposal with abstract in Canvas to the Term Project: Project Proposal drop box.
Due Tuesday night 11:59 pm (Eastern Time)
Now ... don't wait for final feedback from the instructor--begin your data gathering now!
Note:
All Term Project related work and deliverables should be submitted in the Term Project module in Canvas.
Lesson 5: Risk Assessment Factors
5.0 Introduction to Lesson 5
An organization’s ability to acquire, integrate, disseminate, and apply geospatial information is key to assessing risks and managing crises today. The need is apparent in industry sectors involving emergency services, protection, telecommunications, information services, energy, transportation, banking, financial services, water supply, and healthcare. Businesses that understand their physical and social surroundings can better assess the risks in the communities where they operate as well as the extent of their exposure. By doing so, organizations can create a safer and healthier workplace. At the same time, a business needs to identify, avoid, and plan to overcome a crisis so that it can restore some form of normalcy to its people and holdings that serve its customers.
This lesson is intended to support other Certificates, MGIS courses, and Risk Assessment activities. The study of risk assessment coincides with the instruction of ethics in decision making, sustainability, and project management. Risk analysis and risk assessment is integral to businesses for physical security of property, lives, and products; cybersecurity; business opportunities or the denial of intrusion; planning and operations.
For the financial sector, the course specifically includes an application of GIS and geospatial analysis to Anti-Money Laundering and Counter Threat Finance.
Effective anticipation of risks and planning to mitigate threats reduces potential losses of life, property, productivity, and a business' financial value. With a geographic perspective, risk assessments include GIS management, georeferenced information, maps, and scenario-based projections of where people may be located in potential hazardous situations.
Risk management fully includes risk identification, analysis, response planning, monitoring and finally, risk response and control. For this lesson, we review potential risks to a business, crisis response, and work on an anti-money laundering case study. Consider what regulations, rules, laws, and international norms guide the conduct of employees. What higher authorities - local to global - impact a business? Using every applicable resource, plan how to mitigate threats.
Risks and Threats.
The risk of a situation involving exposure or danger is a function of threats, vulnerabilities, and potential consequences to the entity. While open to subjectivity, risk may be roughly approximated as:
Risk = f (T x V x C),
Risk is a function of the product of Threat times Vulnerability times Consequence, where
T, Threat is the possiblity of trouble, danger, hazard, or ruin.
V, Vulnerability is the exposure of an organziation or measure of the possibility to be harmed.
C, Consequence is the effect or result of an action against the organization.
Teamwork for this 2-Week Lesson Block.
During Lessons 5 & 6, you will work as a team to analyze an AML/CTF Case Study. I will assign teams depending on the number of students enrolled this semester and if groupings by time zones assists in your availability to collaborate.
Learning Objectives
At the successful completion of Lesson 5, you should be able to:
- compare and contrast risk assessment and crisis management;
- identify the geospatial data and methodologies employed in risk assessment and crisis management;
- outline the three steps of money laundering;
- structure the workflow of a geospatial analysis to support anti-money laundering or counter threat finance investigations;
- determine the placement actions of money laundering from a financial transaction data sample;
- present findings of exploratory data analysis of a geospatial data set;
- propose suggestions to peers to improve their Term Projects
What is due for Lesson 5?
Lesson 5 will take us one week to complete. There are a number of required activities in this lesson listed below. For assignment details, refer to the lesson page noted.
Note: Please refer to the Calendar in Canvas for specific time frames and due dates.
| 5.1 Risk Assessment, Sustainability, and Crisis Management | ||
|---|---|---|
| Requirements | Details | Access / Directions |
| Read | Read the course content | Use the Lessons menu or the links below to continue moving through the lesson material. |
| Donovan, Disaster Risk and Site Selection | Registered students can access the reading in Canvas on the Lesson 5 Readings page. | |
| Murphy, Geography, Why It Matters, Ch.4 Nature and Society (pp.87-109) | The Geography: Why it Matters reading is from the required textbook for this course. | |
| Ryerson, Why Where Matters, Section 3.2.4 | Registered students can access the reading in Canvas on the Lesson 5 Readings page. | |
| Do | Business Risk Management activity | Directions are provided in the course text. |
| Deliverable | Discussion on Business Risk Management, due Tuesday | Post comment in Canvas to the Lesson 5.1 - Risk Assessment forum |
| 5.2 Anti-Money Laundering / Counter Threat Finance Investigations | ||
|---|---|---|
| Requirements | Details | Access / Directions |
| Read | Read the course content | Use the Lessons menu or the links below to continue moving through the lesson material. |
| Fruth, “Anti-money laundering controls failing to detect terrorists, cartels, and sanctioned states” | Registered students can access the reading in Canvas on the Lesson 5 Readings page. | |
| U.S. Treasury, National Money Laundering Risk Assessment. | Registered students can access the reading in Canvas on the Lesson 5 Readings page. | |
| U.S. Treasury. National Terrorist Financing Risk Assessment. | Registered students can access the reading in Canvas on the Lesson 5 Readings page. | |
| Deliverable | No Deliverable | N/A |
| 5.3 Location Intelligence to Support AML/CTF Investigations | ||
|---|---|---|
| Requirements | Details | Access / Directions |
| Read | Read the course content | Use the Lessons menu or the links below to continue moving through the lesson material. |
| Exploring Potential Uses of GIS and Predictive Analysis in AML/CTF Investigations | Registered students can access the reading in Canvas on the Lesson 5 Readings page. | |
| Deliverable | No Deliverable | N/A |
| 5.4 Case Study: Location Intelligence to Support AML/CTF Investigations | ||
|---|---|---|
| Requirements | Details | Access / Directions |
| Read | Read the course content | Use the Lessons menu or the links below to continue moving through the lesson material. |
| Do | Case Study, Part 1 | Directions are provided in the course text. |
| Deliverable | Part 1 - Placement & Layering, Case Study: Location Intelligence to Support AML/CTF Investigations, Part 1 due Tuesday | Submit your deliverable in Canvas to the Lesson 5.4 Activity: Case Study - Part1 drop box |
| 5.5 Term Project Providing Peer Feedback and Continue Working | ||
|---|---|---|
| Requirements | Details | Access / Directions |
| Read | Read the course content | Use the Lessons menu or the links below to continue moving through the lesson material. |
| Do | Continue Working on Your Term Project | Manage your time wisely |
| Deliverable | No deliverable required this week. | |
| Optional | Additional Readings, Penn State's GeoVista Center and others | Registered students can access the reading in Canvas on the Lesson 5 Readings page. |
5.1 Risk Assessment, Sustainability, and Crisis Management
Risk Assessment
Risk Assessment involves weighing the impact of threats, positive or negative, on objectives and finding the best ways to control the risk by accepting, avoiding, transferring, or mitigating the effects of those threats and communicating it in a succinct and quality manner.
Risk is typically assessed across the following geospatial parameters:
- Probability of something going wrong, e.g. hazard due to physical changes, environmental, man-made, man-induced, collateral or incidental events
- Exposure of people, assets, civil and business entities
- The negative consequnces; vulnerability of personal, societal, and economic conditions
The goal is to consider the potential damages, losses, and/or mitigation of risk. For example, the risk posed by severe storms can be analyzed by looking at weather hotspots (cyclone, tornado, hurricane, lightening, etc., frequency) and calculating the exposure through population density. High-resolution satellite data can be used to derive physical risk and exposure data in combination with GPS data collection.
Risk is inherent to business and needs to be analyzed in terms of potential threats from within the organization (employees, production, administration, etc.), potential threats from outside the organization (customers, vendors, partners, products, services, etc.) and from the supply chain(s) in which it exists (raw materials, original equipment manufacturers, etc.). For manufacturers, it is important to examine the risks in their total value-adding chain starting with raw materials, importer through transporter, supplier, marketer, processor, wholesaler, distributor, retailer, maintainer, to consumer. For service providers, an analogous value-adding chain exists.
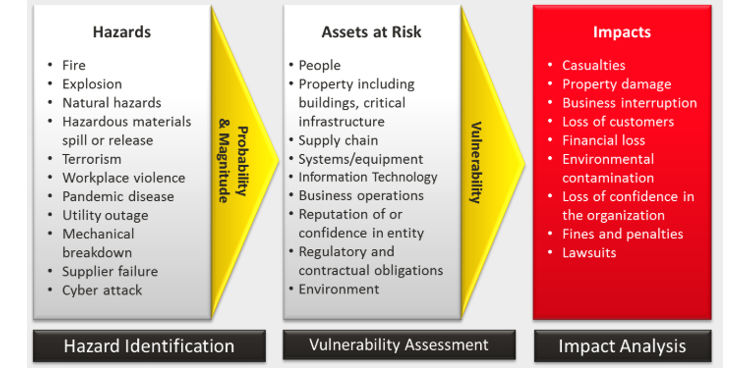
Sustainability
Through our work as geospatial data scientists, business professionals, or conscientious citizens, we share a responsibility to preserve the resources of our planet. Sustainability is commonly referred to as an ability for humans and the biosphere to continually coexist. More specifically, environmental sustainability combines the responsiblity to maintain environmental quality, preserve natural resources, and minimize the depletion of air, land, and water resources. Similar risks to human life, outlined in a Risk Management program, may threaten the vitality of the environment near business locations, along the supply chain, and as a result of improper disposal of hazardous materials.
The convergence of Economy, Society, and Environment has resulted in a range of model sustainablity programs to unsustainable and devastating depletion of resources, e.g. potable drinking water, ozone in the atmosphere, and arable soil for agriculture. The United Nations Educational, Scientific, and Cultural Organization (UNESCO) provides educational materials, Education for Sustainable Development (Figure 5.2) to "empower everyone to make informed decisions in favour of environmental integrity, economic viability and a just society for present and future generations." (https://en.unesco.org/themes/education/sdgs/material [51]) These development goals are key elements of their 2030 Agenda for Sustainable Development.
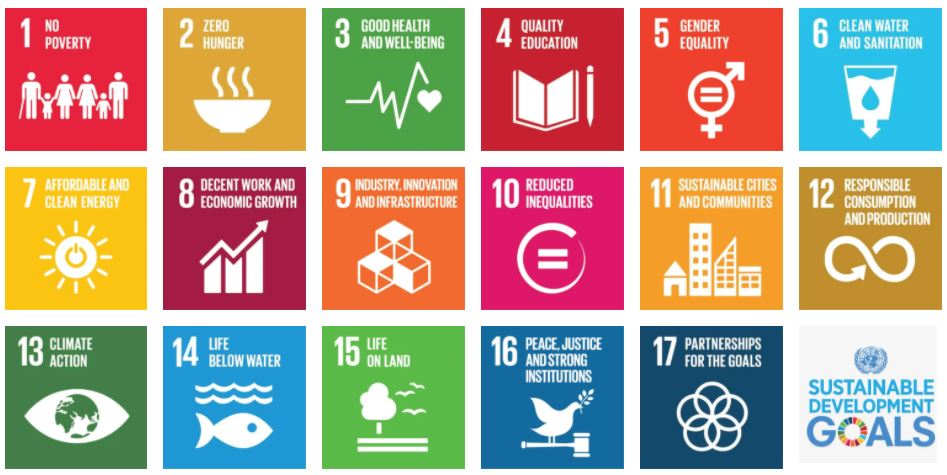
Crisis Management
Crisis Management is the process by which an organization deals with a major event that threatens to harm the organization, its stakeholders, or the general public. Three elements are common to most definitions of crisis: (a) a threat to the organization, (b) the element of surprise, and (c) a short decision time. Usually, Crisis management involves dealing with events as they occur or right after they occur.
The need to develop information science and technology to support crisis management has never been more apparent. Crisis management, for events such as hurricanes, forest fires, disease outbreaks, chemical spills, and terrorist attacks, relies upon geospatial information about the event itself, its causes, the people and infrastructure affected, resources available to respond, and more. Geospatial data and tools are an essential part of all aspects of crisis management—from planning for future crises, through response and recovery, to the mitigation of a possible crisis. In all aspects of crisis management, geospatial data and tools have the potential to contribute to the saving of lives, the limitation of damage, and the reduction in the costs to and impact on society.
For example, responders who know where impacts are greatest, where critical assets are stored, or where infrastructure is likely to be damaged are able to act more quickly, especially during the “golden hour” immediately after the event when there is the greatest possibility of saving lives. Geospatial data collected and distributed rapidly in the form of useful products allows response to proceed without the confusion that often occurs in the absence of critically important information. Indeed, it is impossible to imagine the chaos that would result if first responders were entirely unfamiliar with an area and had none of the geospatial information—maps, GPS coordinates, images, human conditions and cultures, all essential to effective management.
Read:
With the above definitions setting context, skim the following, spending time on tables and flowcharts—notice the interplay between the two above topics.
- Disaster Risk and Site Selection [52], Dennis Donovan, 2002
- Murphy, Geography, Why It Matters, Ch.4 "Nature and Society" (pp.87-109)
- Ryerson, et. al., Why Where Matters, Sections 3.2.4, “Mapping On-Demand/Traditional Mapping”
- A Risk Management Standard, [53] published by the Federation of European Risk Management Associations
- Note: Pay special attention to graphics on page 4 (which shows examples of internal and external risks) and page 5 (which suggests a process for addressing risk.) You may find these two graphics, among others, helpful in sections 7.3-7.5.
- GIS Technology for Disasters and Emergency Management [54], Esri, Russ Johnson, 2000
The Geography: Why it Matters reading is from the required textbook for this course.
Registered students can access the other readings in Canvas on the Lesson 5 Readings page.
Do: Business Risk Management
Returning to the article on "Disaster Risk and Site Selection," consider risk minimization: How is site selection (essentially, location) tied to this take on dealing with disaster risks?
Deliverable
Post a comment in Canvas to the Lesson 5.1 - Risk Assessment forum including:
- one clear example of a risk to a business that experienced a critical disaster loss or damage, and
- how the business risk was minimized and what actions were taken to manage the crisis.
- You're welcome to post an additional example (from a different organization or scenario), if one comes to mind, for us to discuss.
Due Tuesday 11:59 pm (Eastern Time)
Check the calendar in Canvas for specific time frames and due dates.
5.2 Anti-Money Laundering (AML) and Counter Threat Finance (CTF) Investigations
Money laundering, terrorism, and threat financing present dangerous risks to businesses and the financial community. A business that does not establish procedures to identify and prevent money laundering or threat finance is at risk for financial losses, compliance violations, operational disruption, and reputational damage.
Financial Institutions (FI) evaluate the risks to their organization from exposure to AML/CTF. Similar to may other sectors, transactions represent the exchange of resources between parties. In finance, rules, laws, and guidelines regulate the terms and process of banking transactions. When criminal actors intend to violate the banking systems and established protocols, FI's and the public are at risk.
Compliance programs assess the threat of criminal activity, vulnerability of a business, and the potential risk to an organization. Financial services are required and/or expected to comply with laws such as the Bank Secrecy Act (BSA), regulations, policies, and International norms. The risk of ignoring or accommodating money laundering in a bank, financial institution, or money service business (MSB) can be catastrophic to a business. At the least, penalties such as fines, fees, or forfeitures, may impact the company’s bottom line. The volume of money laundering is estimated at $300B (USD) in illicit trade.[6]
What actions should a financial organziation take in finding, freezing, and forfeiting criminally derived income and assets? The main objective, in support of law enforcement action, is to break the ties between financial institutions (FIs) and criminals or traffickers, follow the flow of money through investigations, and uncover clients who act as producers, distributers, and beneficiaries in the illicit trade. It is not in the scope of this course to determine illegal activity. The purpose of the exercise is to model the use of location intelligence in AML/CTF investigations.
Basic understandings of AML/CTF, fraudulent transactions, and risk assessment are important for geospatial scientists and analysts working in the financial sector. Many elements of Know Your Customer involve geospatial relationships in place and time. The use of geospatial analysis and location intelligence tradecraft support FI and law enforcement investigations to identify suspicious activity. For additional context, one must understand that not all outlier events relate ot illegal money laundering activity or possible fraud. During the case study exercise, be on the lookout for false leads to test your hypotheses and analysis.
Money LaunderingMoney laundering is an attempt or action to conceal the origins of money obtained from illicit activities. It may also be referred to a a concealment of assets acquired legally or illegally intended for personal consumption or beneficial heirs. (OED 2002)
The U.S. Bank Secrecy Act (BSA) requires Anti-Money Laundering programs, oversight, and action to protect the public, safeguard the economy and financial systems, and refer suspicions of money laundering to authorities. On the financial side, AML is risk-based to identify types of customers, customer locations, and services a financial entity provides. Law enforcement, government regulatory, and public safety agencies conduct AML to investigate suspicions, follow the money, and defeat the ability of an individual, business, or organization to illegally launder money.
The Association of Certified Anti-Money Laundering Specialists (ACAMS) simplifies money laundering as the process of making dirty money look clean. ACAMS provides training, continuing education, seminars, and forums for Certified Anti-Money Laundering Specialists (CAMS certification), law enforcement, financial professionals, and investigators. www.acams.org [55]
Terrorism and threat financing
Terrorism is the unlawful use of intimidation and violence for political or ideological gains, often directed against civilians. There's a direct correlation between the level of activity of a terrorist group and their capability to acquire and move funds. Thus, the primary objective in countering terrorism is to cut off adversary's access to money. Counter Threat Finance (CTF) refers to govenment and Department of Defense action taken to deny, disrupt, destroy, or defeat threat finance systems and networks that negatively affect US interests. Threat finance refers to the methods used by organized criminal organizations or adversary groups to move and use funds to support their illegal activities or profit from them.
Stakeholders of CTF include entire sectors of the public safety (e.g. government, law enforcement, military) and financial community (e.g. private sector banks, insurance companies, mortgage lenders, money service businesses, law firms, accounting firms, real estate, auction houses).
CTF strategies are planned to disrupt an organization's illicit financial activity and counter criminal and terrorist groups' ability to fund and commit criminal plots. Major criminal activities that source adversary threat financing include black market operatons, illegal taxation, counterfeiting of all sorts, credit card fraud and identity theft, embezzlement or diversion of government funds, kidnapping, theft and sale of fuel.
Threat finance is how "bad guys make, hide, move, and spend their money," broadly relating to:
- terrorism
- narcotics
- human trafficking
- transnational criminal groups
- cyber-crimes
ACAMS describes Terrorist Financing as using funds for an illegal purpose, but the money is not necessarily derived from illicit proceeds. Readers may see similar references to Counter Threat Finance (CTF) and Combating the Financing of Terrorism (CFT); the context is equivalent yet specific actions may differ.
Know Your Customer (KYC)
The imperative to this entire process of strengthening the community's financial security is for FIs to Know Your Customer, or KYC, and verify client identities.
For the purpose of this lesson, we will now refer to money laundering as the target of geospatial analysts' work in AML/CTF investigations. Money laundering is certainly not only a 21st century problem and goes beyond stacks of U.S. $20's, Euro's, and Russian rubles. We must understand how criminals get their funding, where the money comes from, and what tactics are used to avoid detection.
FI's which unintentionally or intentionally launder money introduce similar risks to the financial sector as the criminal actors committing money laundering or threat financing. EU laws and directives hold supervisors and individual employees liable to imprisonment or fines if the FI is found to be assisting a money launderer. The principles of KYC and strict compliance of KYC procedures are designed and emplaced to reduce risks to the FI and employees.
Stages of Money Laundering
There are three distinct stages of Money Laundering:
- Placement of dirty money into financial institutions,
- Layering of those funds throughout the financial community, and
- Integration of laundered money with seemingly legitimate purchases.
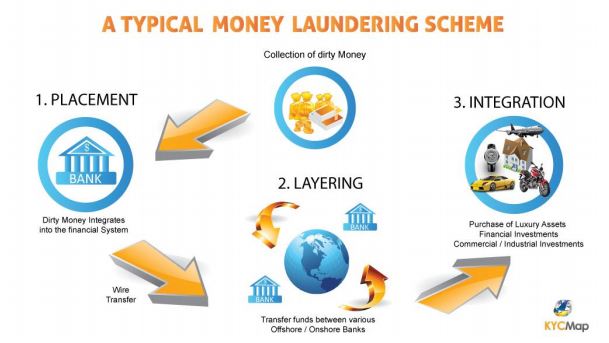
Figure 5.2 Typical Money Laundering Scheme, FINRA 2017
Investigators look for evidence of these three sequential events or activities in money laundering cases:
1. Placement is the physical movement of cash, currency or other funds to a place or other form which is less suspicious to law enforcement authorities and more convenient for criminals.
- Placement often takes the form of dividing illicit cash into small sums, making deposit transactions that fall below a Financial Institution (FI’s) regulatory reporting levels. Initial deposits of money into a FI is followed by layering the value of deposits into circulation through multiple FI’s, casinos, shops, bureau de change, other domestic or foreign businesses, and MSBs.
- The entire process is complicated by smuggling currency out of a country, the level of a bank's reporting complexity, currency exchanges, and foreign exchange markets.
- This represents the physical movement of currency and other funds to a place or other form which is less suspicious to law enforcement authorities and more convenient for criminals.
2. Layering involves further separation of the proceeds from their illegal source, using multiple financial transactions, networks linkage, and money flows.
- Electronic banking benefits the launderer, directly or subsequently transferring funds into a Bank secrecy haven (site) with lax reporting requirements. From there, it is common to see withdrawals in form of highly liquid monetary instruments, often money orders, traveler’s checks, and recently, cryptocurrency.
- Criminals distribute their money through wire transfers, purchase of insurance contracts or monetary instruments to obscure audit trails and hide proceeds; often using securities brokers and digital currency markets. High value transfers that may trigger suspicion are wire transfers, currency transactions, or spikes in sales of antiquities.
3. Integration is where illegal proceeds are converted into legitimate business earnings through normal financial or commercial operations; the movement of laundered money into the economy.
- Integration is the reinsertion of successfully laundered proceeds into a market by high value purchases, spending, investing, lending techniques, and legitimate Cross-border transactions. The funds often appear as normal business earnings.
- Layering and then integration changes the form of the proceeds from cash bundles to possessions of similar value; but less conspicuous. It’s not always cash that is reintegrated in the financial system and economy. High value purchases further disguise and launder dirty money proceeds. Classic asset purchases investigated are real estate property, artwork, coins and collectibles.
- Targets of money laundering may also include shell companies, business chains, insurance products, precious stones and jewelry, high value goods (e.g. performance or luxury cars), and antiquities.
Alerts to Suspicion of Money Laundering
Perpetrators of criminal acts strive to make the transactions as innocent-looking as possible. A suspicious activity report (SAR) or suspicious transaction report (STR) is filed by a financial institution to alert authorities of suspicious activity, known or suspected violations of BSA, and finance-related laws. Suspicious transaction detection is used to report banking transactions that may be connected with criminal activities.
When an AML/CTF case is referred for investigation or a geospatial analyst is involved, several types of events trigger alerts. Adverse media, such as a criminal investigation or international incident relating to a bank's customer, often initiates a review of that customer, accounts, and services the institution provides. For US transactions over the $10,000 threshold, a transacton monitoring system alert triggers a review of transfers to identify or rule out patterns of red flags for money laundering. FIs are required to evaluate risks of customers with multiple SARs and multi-layered account risks.
Investigation
What does an investigator look for? What differences appear from typical and atypical methods of money laundering? Where sources of funding are illegitimate, money laundering occurs to make the funds appear legitimate, to conceal its criminal origins.
The geographic issues raise questions:
- Where are the players?
- Where is what they want?
- Where can they get away with criminal activity?
Transactions - in finance and intelligence - represent relationships between entities. AML investigations start with finance customers, behaviors, reported or suspicious activity, and vast disjointed finacial data sets. These are the sources, recipients, conduits, unwitting facilitators, and indications for AML/CTF investigators.
- People
- Transaction data
- Financial institutions
- Correspondent banks
- Bridge-relationships
- Dates, times, transaction accounts and remittance records
Consider using the available financial transactions, credit card statements, bank records, tax documents, net worth analysis, andother open source or third-party geospatial information. From these spreadsheets, screens, and databases, the goal is to identify possible illicit activity, people involved, and to connect geospatial patterns of suspicious financial activity related to space and time.
Patterns of Money Laundering and Threat Financing
High value transactions take place at and through:
- Financial Institutions and banks
- Money service businesses, e.g. Western Union or MoneyGram
- Casinos
- Antiquity auctions
- Real estate markets
- Online digital currency exchanges, or cryptocurrency
- Mobile Money, M-transfers
- Online auction houses, e.g. EBay or Amazon
Read:
- Joshua Fruth. 2018. Anti-money laundering controls failing to detect terrorists, cartels, and sanctioned states [56]. Reuters. 14 Mar 2018. Online.
Skim:
- U.S. Treasury. 2018. National Money Laundering Risk Assessment [57].
- U.S. Treasury. 2018. National Terrorist Financing Risk Assessment [58].
Deliverable:
Ther are no Deliverables for 5.2.
5.3 Location Intelligence to Support AML/CTF Investigations
Role of Geospatial Analyst
The role of analysts to assess risks in AML/CTF investigations is based on the principle that a risk has two primary components of probability and impact. Determining the probability of money laundering or threat financing guides the method of descriptive, predictive, or prescriptive geospatial analysis. Investigating authorities determine the vulnerable parties, institutions, and communities at risk from suspicious illicit activity. Impacts of the risks vary in terms of cost, human safety, reputations, community order, and ethical business practices.
The geospatial analyst in AML/CTF investigations analyzes geospatial factors surrounding suspicious activity to identify risks, anomalies, and relationships through scientific process and discovery. Not all agencies or investigative teams include geospatial analysts; it depends on the agency, structure of investigative team, and an understanding of the advantage location intelligence provides an investigator over adversaries or suspicious groups.
The geospatial analyst links unusual financial transactions to data on people and businesses in geographic locations. Let us reiterate for this course that the geospatial analyst is not a legal authority, does not determine suspicion of activity, nor identify parties as conducting illicit or legal financial transactions. We are teaching methods of geospatial analysis in support of investigations to identify anomalies, patterns in geospatial and business information, and risks to proximal institutions or places.
Geospatial analysts work on location-based problems, questions, and search for patterns. Their role for Finance is to use geospatial analysis tradecraft to provide location intelligence to clear ambiguity of where transactions meet regulatory or slip under thresholds. Investigators respect rights to privacy and societal responsibilities. This is an ethical issue for analysts to "stay in their lane", know and follow guidelines of the financial organization, investigatory agency, and role.
Advantage of Location Intelligence
Location intelligence can be described as the practice of collecting, enriching, and analyzing business information, georeferenced data, and geospatial information to discover contextual insights for location-based challenges or opportunities. The process of location intelligence is conducted confidentially to gain a decision advantage for the organization or to disadvantage competitors.
Assessing the human dimension in AML/CTF is difficult and requires behavioral knowledge, training, and experience; not typically a forte of geographers (except advanced human geography). Including a geospatial analyst in an investigative team adds a highly specialized skillset in location intelligence to work collectively towards uncovering illegal activity. There are significant elements of these investigations which are not released outside of the AML/CTF community, with good reason. To reiterate, the purpose of introducing AML and CTF investigations in Lessons 5 & 6 is to share additional methods of geospatial analysis and career options for your personal development.
Uses of location intelligence in AML/CTF investigations are to:
- identify possible illicit activity and persons involved through geospatial modeling;
- connect geospatial patterns of suspicious financial activity related to place and time;
- assess growth, direction, volume, and potential for money laundering; and
- identify network connections related to location and electronic banking linkage.
Asking business questions to organize the analysis workflow.
What can the geospatial analysis and geospatial intelligence communities do to help Finance mitigate the threats they face? The geospatial analyst's role is defined by the requirements of the organization. Following an organized approach to the inquiry, the analyst starts with asking pertinet questions, gathering data, and cerating GIS models. The organization determines the specific goals of the analysis, such as to:
- Discover patterns of money laundering
- Assist FIs to "know their customers"
- Comply with national and international practices
Geospatial analytics improves the accuracy of risk assessments and reduces the time to identify suspicious activity. AML/CTF is yet one more use case of geospatial analytics to solve a complex problem. Location intelligence and geospatial intelligence adds a previously unappreciated decision advantage to anti-money laundering and counter threat finance investigations. Geospatial analytics integrates the business segments of customers, financial institutions, and transactions to detect banking anomalies. We're combining geospatial information, analytical modeling, remote sensing where it fits, artificial intelligence (AI) and machine learning in proven workflows.
Transactions
Transactions provide us the first introduction to entities and represent relationships between entiites. These are exchanges of resources, as physical transactions that occur primarily in physical space, the real world, and as logical transactions conducted in cyberspace. Geospatial analysts examine transactions to connect entities and locations. Critical metadata of spatial and temporal registration define events and transactions in space and time.
Spatial registration describes attributes of event data and temporal registration defines transaction data. All transactions have a precise beginning and end. However, one should be aware of FI rules that determine the timing and availability of funds in wire tranfers, deposits, lending arrangements, and withdrawals.
Analysis to produce location intelligence.
AML/CTF investigations leverage GIS, link analysis, and geospatial analysis to determine which FIs are most at risk to exposure of illicit finance. Intial research links unusual financial transactions to data on individuals in geographic locations.
Geospatial predictive and prescriptive models improve the accuracy of risk assessments and can reduce time to identify suspicious activity. A core skill in producing location intelligence is designing a workflow specific to the problem:
-
Define the situation and business question.
-
Identify the deliverables needed to support a decision.
-
Identify, collect, organize, and georeference data needed to examine the problem.
-
Follow an investigative and geospatial analytical process to:
-
Discover and uncover patterns and relationships
-
Rule out false leads (not actually suspicious behavior)
-
Identify threads for further research and analysis
-
-
Discuss a predictive or prescriptive workflow which supports the investigation objectives.
-
Map, chart, visualize, and summarize your observations, presentation of findings or recommendations
The expected result of this analysis workflow in AML/CTF investigations is to:
- create geospatial models to identify and visualize patterns, risk areas, and corrdors, and
- identify regions likely exposed to the flow of illicit funds, potential funding streams, and risks to nearby FIs.
Predictive & Prescriptive Analytics of Financial Fraud
Data analytics involve processes of inspecting data and to correlate the volumes of Big Data into useful information. In money laundering investigations, certain types of digital analysis may be used to isolate patterns of fraudulent activity. Analysis techniques include graph mining to detect suspicious transactions or spatial data mining to identify geographic patterns. For smaller data sets, commercial database and spreadsheet packages adequately support data analytics.
Predictive geospatial analysis estimates the likelihood of future events, of a similar event occuring in a different location under congruent circumstances. Predictive analytics applies forecasting to statistical models to understand, "What could happen?"
Prescriptive analytics combines outcome optimization and statistical simulations to develop courses of action. This form of geospatial analysis provides choices of actions or solutions for decision makers answering, "What should happen; what should we do?"
Geographic, Financial, and Security Data
When does an analyst have all the required, relevant, and georeferenced data at the start of analysis? So much effort is expended to collect and enrich data; internal data, open source, third-party, civil, and gained through observations. Raw financial data may additionally be obtained from individuals, FI databases, service providers, and MSB or Informal Value Transfer Services (IVTS).
It may be possible, with proper authorizations, to access financial data collected in commercial sector databases, e.g. retail outlets, supermarket chains, loyalty programs, telecommunication, insurance, financing, airlines, utility, car service, and deliverly companies.
Presentations to reach decisions, inform leaders, brief an investigation team
Communicating the location intelligence results of an AML/CTF investigation impact comprehension, resolving competing theories, and visualizing the geographic information. The analyst may present findings for actionable decision, to alert authorities, or referral for additional or other forms of analysis. There's no single, optimal format for presentation, this is a key competency to learn. Presentation techniques and tools depend on the organization, objectives, and decision maker preferences. Formats and geospatial information often:
- Map, visualize, chart findings to depict patterns, relationships, situational awareness
- Provide intelligence and feedback to stakeholders
- Perform descriptive, real time, predictive or prescriptive analysis (what happened, is happening, may happen, or should happen?)
- Present for action, decision making
Read:
Wakeman, Exploring Potential Uses of Geographic Information Systems and Predictive Analysis in AML/CTF Investigations [59].
Registered students can access the reading in Canvas on the Lesson 5 readings page.
Deliverables:
There are no deliverables for 5.3.
5.4 Case Study: Location Intelligence to Support AML/CTF Investigations, Part 1
You will work individually on the AML/CTF Case Study in Lessons 5 & 6. However, you may collaborate, discuss, ask & answer questions in the Discussion Forums for both lessons.
Case Study: Location Intelligence to Support AML/CTF Investigations,
Part 1 - Placement and Layering
1. This is a case study to expand your understanding of location intelligence, AML/CTF investigations, chosing and applying various geospatial analysis methods to detect anomalies and patterns, and making recommendations on the next steps of the AML/CTF investigation.
a. Follow the financial trail of a hypothetical, fictional college student over 18 months of his freshman year, summer, and sophomore year. The story starts that multiple suspicious activity reports (SARs) have been filed on this person of interest. The initial SAR was filed by a local bank, second SAR used his Dad's name and the report was dismissed, and the third was serious to include international wire transfers.
b. Blake Glover (fictional character) began freshman year as a resident college student, started making money with a summer job, and opened a credit card. Then, he deposited more money, transferred funds around, and the financial trail gets more complicated.
c. How does one use GIS in AML/CTF investigations? What does an investigator look for in AML/CTF? e.g. what patterns do they look for, why care about an individual's banking practices?
2. Multiple SARs have converged on a suspicion of money laundering and possible illicit activity with Blake Glover. The investigation team "reads you in" on the situation to produce location intelligence to support the AML/CTF investigation. SARs are highly confidential and we can't release the specifics of the initial SAR, submitted when a FI clerk expressed concern over repeat transactions at their State College branch.
a. Look at repeat deposits with an eye toward space and time; location and frequency of deposits.
b. A summary of the SAR circumstance on Blake Gover is available through Canvas, Lesson 5.4.
c. In response to the inquiry, banks produced transaction reports for you to start a geospatial analysis, e.g. credit card transactions, new bank transactions, information regarding multiple cash deposits.
d. Integral to BSA compliance is for a Financial Institution (FI) to Know Your Customer (KYC):
-
What do you know about the [your] customer of interest?
-
What financial services are/were provided to this customer?
-
What do you want to find out?
-
What do you request? Other reports can be pulled.
3. As the geospatial analyst assigned to develop location intelligence in support of this AML/CTF investigation, you now have access to transaction reports, credit card statements, and an awareness of casino transaction report (CTR) and SAR.
a. Review the structured and unstructured datases. Organize the data to identify normal, consistent transactions; anomalies; and financial patterns suggestive of money laundering.
b. Select and use analysis tool(s) to demonstrate your ability to analyze geospatial data, categorize and quantify financial data, and visualize patterns. In a descriptive analysis, produce insights into the past - Blake Glover's activities tied to the SARs and AML/CTF investigation.
c. Examine the financial and geospatial information to identify and categorize, if applicable, transactions and patterns of the first two elements of money laundering (placement and layering).
d. Provide location intelligence and feedback to stakeholders. What to do with results of analysis? Map, visualize, chart to depict patterns, relationships, situational awareness with an executive summary. Consider your busy investigative team; keep your slides informative, visual, and brief.
Case Study: Step 1 - Placement
- Review Placement, what do you note about the transactions?
- What patterns emerge from your analysis of the student's financial transactions, purchases, deposits, or geographic connections?
Case Study: Step 2 - Layering
- Review Layering, what do you learn from the transaction reports and activity?
- Do the student's behaviors or financial trail suggest a flow of illicit funds or corridor(s)?
Deliverable:
Complete the Money Laundering Placement and Layering activity; submit an Initial Presentation of your analysis (sequence of slides/images/maps/reports with your comments annotating the presentation) and an Initial Written Report (about 2 pages, Word document).
1) Create a Powerpoint Presentation of your Transaction Analysis. Approximately five slides will cover the concepts of Placement & Layering. Please include the following in your PowerPoint Presentation and post it in the Lesson 5.4 Activity Case Study: Location Intelligence for AML/CTF Investigations, Steps 1 and 2 drop box. Any cover page slides or reference slides do not count towards a suggested number of slides in a presentation.
- Maps or other visualizations of the investigation area of interest, locations where money was placed (initial step of laundering) area with any relevant polygon and point layers visible and symbolized.
- Financial & geospatial information which evidence the results of your analysis and address the elements of Placement and Layering. NOTE: You may wish to clip the report to highlight elements you wish to be clearly visible in your presentation.
- Brief explanation/rationale for your suggestions as commentary to your images.
2) As your Individual work, write a 2-page Report summarizing your findings of Placement and Layering.
- Support or refute that Glover's financial actiivity and behaviors suggest Money Laundering. What patterns of Placement and Layering do you identify?
- Include maps, figures, charts, or graphs to support your findings and argument. These may be from the transaction analysis or visualizations of the data which you create.
Your grade will be based how well you make your case both in terms of evidence and presentation.
Due Tuesday 11:59 pm (Eastern Time)
5.5 Term Project – Continue Working
You have a full week of learning and case study deliverables, so I did not assisgn Peer Feedback in this Lesson.
(For future feedback activities): To provide meaningful feedback, you should consider the following aspects:
- Are the goals reasonable and achievable? It is a common mistake to aim too high and attempt to do too much. Suggest possible amendments to the proposals' aims that might make them more achievable in the time frame.
- Are the data adequate for the task proposed? Do you foresee problems in obtaining or organizing the data? Suggest how these problems could be avoided.
- Are the proposed analysis methods appropriate? Suggest alternative methods or enhancements to the proposed methods that would also help.
- Provide any additional input that you feel is appropriate. This could include suggestions for additional outputs (e.g., maps) not specifically mentioned by the author, or suggestions as to further data sources, relevant things to read, relevant other examples to look at, and so on.
No Deliverable for this Lesson 5.5:
There are no deliverables for your own term project this week.
Lesson 6: Risk Assessment Case Study: Location Intelligence to Support AML/CTF Investigations
6.0 Introduction to Lesson 6
Geospatial analysts involved in AML/CTF investigations plan and conduct analysis to provide actionable location intelligence for decision makers trying to stop transactions that fund crime and terrorism. This lesson continues the AML/CTF case study with additional information and datasets.
Section 6.1 reviews methods of integrating geospatial analysis into AML/CTF, considerations of the laws and higher authorities guiding investigations, and ways to present findings for decision making.
At the successful completion of Lesson 6, you should be able to:
- Integrate geospatial analysis with investigative techniques;
- Discriminate the difference of common financial transactions and patterns of fraud;
- Design an efficient workflow to analyze a complex AML/CTF case;
- Evaluate the results of geospatial analysis and propose recommendation to proceed;
- Reflect on learning through first half of the course; and
- Draft a second iteration of Term Project proposal.
What is due for Lesson 6?
Lesson 6 will take us one week to complete. There are a number of required activities in this lesson listed below. For assignment details, refer to the lesson page noted.
Note: Please refer to the Calendar in Canvas for specific time frames and due dates.
| 6.1 Geospatial Analysis for AML/CTF Investigations | ||
|---|---|---|
| Requirements | Details | Access / Directions |
| Read | Read the course content | Use the Lessons menu or the links below to continue moving through the lesson material. |
| U.S. Securities and Exchange Commission. Anti-Money Laundering (AML) Source Tool for Broker-Dealers. | Registered students can access the reading in Canvas on the Lesson 6 Readings page. | |
| U.S. Treasury. U.S. Money Laundering Threat Assessment. | Registered students can access the reading in Canvas on the Lesson 6 Readings page. | |
| Bureau of Justice Assistance. The State and Local Anti-Terrorism Training (SLATT) Program. | Registered students can access the reading in Canvas on the Lesson 6 Readings page. | |
| Deliverable | No Deliverable for 6.1 | N/A |
| 6.2 Case Study: Location Intelligence for AML/CTF Investigations, Part 2 | ||
|---|---|---|
| Requirements | Details | Access / Directions |
| Read | Read the course content | Use the Lessons menu or the links below to continue moving through the lesson material. |
| Do | Complete the Case Study activities for Money Laundering Layering, Integration, Geospatial Analysis, Recommendations | Directions are provided in the course text. |
| Deliverable | Submit Case Study Steps 3-5 with Presentation, due Tuesday | Submit your case study in Canvas to the Lesson 6.2 Activity: Case Study - Location Intelligence for AML/CTF Investigations, Part 2 drop box |
| 6.3 Supply Chain Security Management | ||
|---|---|---|
| Requirements | Details | Access / Directions |
| Read | Read the course content | Use the Lessons menu or the links below to continue moving through the lesson material. |
| FEMA, Supply Chain Resilience Guide | Registered students can access the reading in Canvas on the Lesson 6 Readings page. | |
| Larson, Global Survey Reveals Supply Chain as Rising | Registered students can access the reading in Canvas on the Lesson 6 Readings page. | |
| Deliverable | Provide Comments, due Tuesday | Post comments in Canvas to the Lesson 6.3 - Supply Chain Security Management forum |
| 6.4 for Term Project Submit Revised Project Proposal with Data Sources | ||
|---|---|---|
| Requirements | Details | Access / Directions |
| Read | Read the course content | Use the Lessons menu or the links below to continue moving through the lesson material. |
| Deliverable | Submit revised Project Proposal with Data Sources, due Tuesday | Submit your proposal and data sources in Canvas to the Term Project: Revised Project Proposal with Data Sources drop box |
6.1 Geospatial Analysis for AML/CTF Investigations
AML and CTF requires action to mitigate the risks, actually to disrupt and prevent money laundering. This lesson on AML/CTF investigations examines the analysis of geospatial and financial information to produce location intelligence.
This is the intersection of geospatial data of all types, to include social data, remote sensing where applicable, data analytics, and data visualization. Geospatial data sources enrich the initial available information for analysis from structured and unstructured data, open source, third-party, internal, and collected data. Think of how funds are transferred in the 21st century, the vast information accessible to evaluate risk summaries on FI, sectors, and countries. The role of the geospatial analyst is not as investigator or determiner of illegal activities, but tasked to analyze geospatial factors surrounding suspicious activity.
Combining a geospatial analytics methodology and tradecraft to enhance AML/CTF investigations, following a method, process, and secret approach to produce location intelligence. Analysts perform geospatial analysis to assess threats and hazards, discover and model patterns, relationships and networks, and apply predictive and prescriptive analysis to map likely areas at similar risks. These are key elements to risk assessments; however, the criminal intent goes beyond certain nations with bad or weak policies that allow opportunities for money laundering.
Laws, Higher Authority, and Official Organizations
Authorities from the local to global level direct effort and establish boundaries on the geospatial analyst's involvement in AML/CTF investigations to comply with procedures, protect client and business rights, and produce location intelligence of suspicious cases.
U.S. Laws governing banking and the financial sector.
- Bank Secrecy Act of 1970 [60]
- Money Laundering Control Act (1986) [61]
- Uniting and Strengthening America by Providing Appropriate Tools Required to Intercept and Obstruct Terrorism Act of 2001 (USA PATRIOT Act) justice.gov/archive/ll/highlights.htm
- Intelligence Reform & Terrorism Prevention Act of 2004 govinfo.gov/content/pkg/PLAW-108publ458/pdf/PLAW-108publ1458.pdf
Higher Authorities publish expert guidance, conduct oversight, and provide support for AML/CTF investigations. A significant international organization for law enforcement and finance is the Financial Action Task Force (FATF) providing AML recommendations with a view to global risks to regulate financial sector, curb corruption, and assessments of specific country strengths and weaknesses.
- Financial Action Task Force (FATF) http://www.fatf-gafi.org [62]
- US Treasury, Financial Crimes Enforcement Network ustreas.gov/fincen
- US Department of Statestate.gov
- US Secret Service secretservice.gov/ntac
- INTERPOL; countering financial crimes, payment card fraud, money laundering, and currency counterfeiting
- United Nations Office on Drugs and Crime (UNODC), The Money-Laundering Cycle (2019)
- World Bank, World Governance Indicator (WGI)
Process of geospatial analysis to produce Location Intelligence
For this lesson and case study, you will examine a sequence of geospatial analysis methods and pertinent AML/CTF analytic questions. This involves complex geospatial analysis to detect patterns, corridors, and networks. Examine the process, purpose, and value of descriptive, real time, predictive, and prescriptive analysis techniques. Similar methods include fraud ring analysis, link analysis, or network analysis.
Investigators ask investigative, analytic, behavioral, and risk questions. We interpret the question to determine a method of geospatial analysis to expose:
- the flow of illicit funds,
- funding streams, and
- the potential risks to nearby FIs.
The workflow depends on the business question an analyst is addressing. Bank and FI objectives range in scope, possibly to identify money laundering, follow up on a client's SAR, prevent money laundering, and comply with laws, financial sector policies, or local adverse situations. Each situation requires an approved target and organized method.
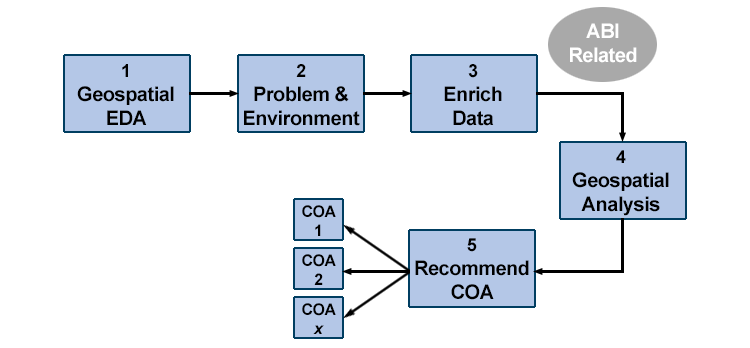
The foundation of geospatial analysis in AML/CTF is a workflow, as depicted in Figure 6.1, a process to:
- Identify suspicious activity or potential of illicit activity. This step often starts with exploratory data analysis (EDA) using descriptive and graphical statistical tools to explore and understand each dataset.
- Restate the problem as a question with outcomes that support an investigation and define the environment.
- Assemble and enrich all relevant geospatial information, data, and imagery if applicable. This is similar to activity-based intelligence (ABI) through which human behaviors, events, and transactions are analyzed to produce pattern of life assessments. Analysts who produce ABI focus on events as recognizable movements or changes conducted by an entitiy and spatial metadata components, relating them to time and space.
- Perform geospatial analysis to assess threats and hazards, model patterns, relationships, and networks. To optimize the location intelligence assessment, analysts may apply prescriptive analytics forming valid courses of action for decision makers.
- Present Recommendations, Courses of Action. Map, visualize, chart, and summarize for presentation or to develop analytic recommendations to alert authorities.
To that extent, this is not simply a Boolean analysis to layer all our banking and law enforcement data sets to locate hubs of money laundering. It's useful to use domain-specific theories to better understand the actual phenomena being investigated.
It also requires choosing the appropriate method or technique of geospatial analysis to describe the situation and answer key questions.
| Analysis technique | analytic question | value to aml/ctf investigation |
|---|---|---|
| Descriptive | What happened? | Proven investigative technique to build elements of a case. |
| Diagnostic | What's happening? | Gaining situational understanding of AML/CTF activity and locations. |
| Predictive | What could happen? | Likelihood of similar actions occurring in a different location. |
| Prescriptive | What should we do? | Recommending courses of action for decision. |
Prescriptive analytics adds a previously unappreciated decision advantage to AML and CTF investigations for the business, financial, and public safety sectors. Where appropriate and within the scope of duties, recommended courses of action provide location intelligence insights. Optimization and simulation algorithms advise on possible outcomes that calculate predictions, providing courses of action to decision makers.
In geospatial analytics, coding and AI may automate routine tasks and elevate alerts, reports, and situational awareness to well-trained analysts. Advanced machine learning is currently applied to identify high-risk procedural aberrations, false links, and patterns of fraud. Location intelligence provides insights of regions, customers, and FIs where multiple-SAR related transactions meet regulations or cumulative illicit activity falls below thresholds.
Case Study
Identify regions likely exposed to:
- The flow of illicit funds
- Potential funding streams
- Risks to nearby FI’s
Recognize the Global Financial Audit Trail, "Follow the Money" to understand the broader global financial networks and investment strategies. Bad money is intermingled with good money in a complex attempt by criminals to throw off investigators and complicate a financial audit trail.
By leveraging the wealth of data available to FIs and exploring additional physical features, such as important rail and road networks, location intelligence can be utilized to enhance the understanding of potential illicit funding corridors. There's a process for geospatial analysts to work, which you may consider for the case study.
- Integrate business segments to detect banking anomalies regarding customers, FIs, and transactions
- Discover patterns of money laundering
- Assist FI’s to connect additional geospatial information to “know their customers”
- National and International practices to enrich data for discovery
- Create models to identify and visualize patterns, risk areas, corridors
Presentations
Present findings for actionable decision.
Present location intelligence for referral; summary, charts, maps, pattern diagrams
Submit report to authorities
It's important to recognize the significance of visualizations for decision-making; seeing patterns emerge from data, identifying linked networks, and discovering instances of suspicious activity.
Advanced Analytics
Choosing the right tool falls into the analyst's ability for critical thinking. This encompasses math, statistics, computer science, and analytical reasoning. One will use a variety of geospatial analytical tools; but the software platform doesn't drive analysis. In your studies, you are learning methods of geospatial analysis, developing elements of tradecraft, and applying location intelligence workflows to a problem. Learning to use a particular software or tool is more training than education. Develop your critical thinking through your courses and personal continuing education.
The AML/CTF case study is a learning exercise to reinforce the main points of location intelligence and material in Lessons 5 & 6. In this section, we're presenting advanced geospatial analytics material, which may require additional software tools to accomplish (outside this course and not for the assignments). This may be a refresher from other experiences or your introduction to advanced visualizing methodologies:
1. Outliers or anomalies
Spatial outliers and anomalies are spatial objects whose non-spatial attributes differ from their spatial neighbors. This technique is quite effective with suspicious behavior and outlier transaction detection. May be represented by a graph analysis of events by latitude and longitude to identify outliers; and then dive deeper into feature attributes to detect anomalies and refer for other investigative tools or methods.
2. Colocation patterns
Colocation patterns can be detected through event-centric models to build neighbor groupings of data points. Alteryx (Alteryx) is an example of a data management software in which the analyst creates a workflow to statistically analyze and filter structured and unstructured financial data. A robust analytic software tool supports exploring a wide range of datasets to uncover patterns. The advantage in point data analysis is to apply statistical significance tests to remove chance patterns. Data management and data analytics tools, e.g. R, GeoDa, SQL, predictive analytics or graph analytics, can perform colocation pattern detection where geolocated events are often sited in a geographic neighborhood.
3. Hotspot detection
Geospatial hot spot regions are significantly more active than surrounding areas in density, frequency, and appearance. This method is common with ABI and fraud ring analysis. Signature Analyst (Maxar) has been successfully applied to depict the likelihood of terrorist threats and event corridors in foreign conflicted areas.
4. Teleconnection detection in space & time
Teleconnection technique is used to discover pairs of correlated spatial time series at large distances, with either positive or negative correlation. There are situations and conditions where imagery adds value in AML/CTF investigations to detect, measure, and visualize patterns in space and time. Imagery is remotely sensed from space, airplanes, unmanned aerial systems, and surveillance video/photos. Tools like ENVI (L3/Harris Geospatial) provide reliable automation of complex and repetitive digital functions.
5. Predictions
Predictive analysis works best with a Bayesian approach, calculating probabilities on georeferenced information from numerous datasets. Spatial prediction relies on selection of an appropriate model for classification and regression, relying on accurate training samples. Signature Analyst (Maxar) effectively works through dependent and independent variable relationships to identify likely locations where similar AML/CTF events may occur.
The financial community recognizes the advantages of combining location intelligence workflows with advanced computing applications. Current literature provides insight on companies researching and programming AI to automate routine foundational tasks, e.g. elevate alerts, reports, situational awareness to analysts. Advanced machine learning has advantages to cue patterns, financial anomalies, and - since we're dealing with the human domain - to rule out false leads.
Errors, Cautions, False Leads
Geospatial scientists understand the potential errors which traditional data mining creates on geospatial data. You may have found that traditional density-based clustering methods will generally output chance patterns if applied to geospatial hotspot detection. Methods that test for statistical significance can potentially reduce such chance patterns.
Unlike classic data mining for businesses, these geospatial techniques must handle spatial point distributions and the associated challenges of auto-correlation.
False positives or false leads present challenges in AML/CTF investigations. Data or events may appear suspicious when they are actually the result of standard transactional activity. This may be caused by randomness in data, errors of bias in prediction assumptions, AI training data, or investigation. People are not always predictable. The purchase of a $9,000 necklace isn't always to hide a transaction below the $10,000 bank reporting threshold. There's significant corporate marketing that goes into selling jewelry, and one buyer may be inspired to spend less than $10,000 on a fancy necklace.
Conclusion
What actions should a financial organization take in finding, freezing, and forfeiting criminally derived income and assets?
All of this analysis effort is to support the people involved:
- Customers
- Analysts
- Bank tellers trained to spot odd behavior, and
- Senior decision makers
Analysts detect patterns, quantify the events, risks, and potential consequences. Investigators and decision makers follow these leads to stop criminal and terrorist access to money.
Developing new prescriptive methods, deploying machine learning, AI, and critical thinking will advance the discipline of investigating and stopping financial criminal activity.
Proven geospatial analytic methods of location intelligence transform the efficiency of investigations, location-based business problem-solving, and global commerce which is moving at high speed, undergoing great change.
Skim:
- U.S. Securities and Exchange Commission. 2018. Anti-Money Laundering (AML) Source Tool for Broker-Dealers [63]. 4 Oct 2018. Online.
- U.S. Treasury. 2005. U.S. Money Laundering Threat Assessment [64].
- Bureau of Justice Assistance. 2019. The State and Local Anti-Terrorism Training (SLATT) Program [65]. U.S. Department of Justice.
6.2 Case Study: Location Intelligence to Support AML/CTF Investigations, Part 2
Case Study: Location Intelligence to Support AML/CTF Investigations,
Part 2 - Integration, Geospatial Analysis, and Presentation
Your work in Lesson 5 uncovered patterns of money laundering placement and layering. Let's continue the case study in Lesson 6 to expand the location intelligence supporting the fictional college student AML/CTF investigation to identify any integration activities.
Investigators created a link to additional media reports, financial, and geospatial information for your analysis. Use the Canvas, Lesson 6.2 link to download pertinent financial reports.
Case Study: Step 3 - Integration
a. Your assignment in Lesson 6 is to identify integration activities of money laundering, if applicable, in the case of Blake Glover. What do you find?
b. It is often difficult to separate legitimate purchases from false leads; examine the location, methods, and timing of possible layering activities with an open mind in these situations.
Case Study: Step 4 – Geospatial Analysis
a. Using the available data and information you researched, perform a formal geospatial analysis to produce location intelligence. The results of your analysis will be used by investigators to supplement other forms of legal analysis.
b. Perform a predictive analysis to understand the future consequences or prescriptive analysis to advise on possible outcomes.
c. Develop a recommendation or courses of action (COAs) for the investigative decision makers.
Case Study: Step 5 – Maps, visualization, charts, executive summary
a. Present your findings in a powerpoint or other format presentation.
b. To demonstrate your critical thinking skills and understanding of location intelligence, present your top recommendation on the next step for investigators to prevent money launding in the FI/or identify money laundering earlier. From your job role as a geospatial analyst, what do you recommend or what COAs do you develop?
Do:
Complete Steps 3, 4 and 5 of the Case Study
Guidelines:
Continue your work from Lesson 5, read the supplemental information and reports found in Canvas Lesson 6.2 download, and perform geospatial analysis to complete your location intelligence assessment for the AML/CTF case study.Deliverable:
Complete the Money Laundering, Steps 3-5 activity and create a Presentation (sequence of slides/images/maps/reports with your comments annotating the presentation) & Summary Report (about 400-500 words).
Approximately five to seven slides will cover the concepts of Integration, Analysis, and Recommendations. Submit your Presentation of Location Intelligence, Recommendation, and supporting maps, diagrams, charts, and summary in Canvas to the Lesson 6.2 Activity Case Study: Location Intelligence for AML/CTF Investigations, Part 2 drop box.
- Maps or other visualizations of the investigation area of interest, locations where money was placed (initial step of laundering) area with any relevant polygon and point layers visible and symbolized.
- Financial & geospatial information which evidence the results of your analysis and address the elements of Integration. NOTE: You may wish to clip the report to highlight elements you wish to be clearly visible in your presentation.
- Your explanation/rationale for your suggestions as commentary to your images.
Your grade will be based how well you make your case both in terms of evidence and presentation.
Due Tuesday night 11:59 pm (Eastern Time)
6.3 Supply Chain Security Management
Read:
- FEMA, Department of Homeland Security, Supply Chain Resilience Guide [66]. April 2019.
- Dan Larson. Global Survey Reveals Supply Chain as a Rising and Critical New Threat Vector [67]. Crowdpoint Strike. Blog. 23 Jul 2018.
Threats to global commerce range from destructive weather events to criminal theft to cyber attacks on the supply chain infrastructure. The responsibilities to secure a business’ supply chain are a daunting task and require education, awareness, teamwork, strategic planning, inspections, and continual surveillance. This falls under the headings, roles, and departments of Supply Chain Security and Supply Chain Management (SCM).
Supply Chain Security is a major concern for commercial and government leaders alike. Building resilience in the supply chain is an effective planning element to responding to disasters, intrusions, and catastrophic events. A Supply Chain is that network which identifies, tracks, reports, monitors, and fulfills demand for products. Products may be perishable foods, technical manufactured tools, pharmaceuticals, digital software, or granite counters; transported by air, land, rail, sea, e-delivery, cloud storage, and in-person.
The fundamental issues to learn in this short lesson are the risks, threats, and vulnerabilities of an organization’s supply chain. Security topics or needs include:
- People, personnel security (background checks, behavioral, termination control)
- Physical security and access controls
- IT systems, IT and operations accounts, supply chain data
- Shipping and receiving workflow documentation
- Business/firm/broker relationships (know your partners)
- Security process & security awareness throughout the organization and supply-chain
Fundamentals of Supply Chain Security
- Describe the drivers
- Explain the methods used to understand the operating environment and threats
- Understand and apply the fundamentals of Location Intelligence to Supply Chain Security
Multisource Intelligence for Supply Chain Security
- Employ the concepts of intelligence management & collection
- Illustrate intelligence collation & analysis
- Apply the elements of intelligence dissemination
Operational Methods for Supply Chain Security
- Describe and develop operational models & intelligence estimates
- Complete and critique a case study
Deliverable:
Post a comment and two responses in Canvas to the Lesson 6.3 - Supply Chain Security Management forum.
Considering the information you learned from both reading assignments, share your viewpoints on Supply Chain Security. Either answer one of these questions, or share a new, relevant concern:
- What industries are most vulnerable to risks, theft, or attack and should focus more effort on Supply Chain Security?
- Where do geospatial analysts fit into Supply Chain Resilience, what is the greatest impact they can achieve?
Due Tuesday 11:59 pm (Eastern Time)
6.4 Term Project – Revising and Submitting Your Project with Data Sources
Based on the feedback that you received from other students and from me, revise your original project proposal and submit a final version this week. Note that you may lose points if your proposal suggests that you haven't been developing your thinking about your project.
In your revised proposal, you should respond to as many of the comments made by your reviewers as possible. However, it is OK to stick to your guns! You don't have to adjust every aspect of the proposal to accommodate reviewer concerns, but you should consider every point seriously, not just ignore them.
Your final proposal should be between 600 and 800 words in length (about 1.5 ~ 2 pages double spaced max.). The maximum number of words you can use is 800. You will lose points if your word count exceeds 800. Make sure to include the same items as before:
- Topic, business question, and scope
- Aims
- Dataset(s)
- Data sources
- Intended analysis and outputs—This is a little different from before. It should list some specific outputs (ideally several specific items) that can be used to judge how well you have done in attaining your stated aims. Note that failing to produce one of the stated outputs will not result in an automatic loss of points, but you will be expected to comment on why you were unable to achieve everything you set out to do (even if that means simply admitting that some other aspect took longer than anticipated, so you didn't get to it).
Additional writing and formatting guidelines are provided in the document (TermProjectGuidelines.pdf) in 'Term Project Overview ' in Canvas.
Deliverable:
Post your revised (final) project proposal in Canvas to the Term Project: Revised Project with Data Sources drop box in the Lesson 6 module.
To complete this assignment, you will need to incorporate any peer/instructor feedback into your final draft of your question/case. Remember that you considered project elements in Section 4.5 [68] of Lesson 4—make sure your final draft takes into account all of those elements.
Due Tuesday 11:59 pm (Eastern Time)
Lesson 7: Sector Applications of Location Intelligence, Part 1
7.0 Introduction to Lesson 7
Planning and managing the movement of people and goods is a demanding business operation. Whether applied to public transit, private automotive travel, or logistics of supply chains, geospatial analysis optimizes routing, conserves resources (time, fuel, package handling), improves cost effectiveness, or identifies new opportunities to expand business and regional growth.
In this lesson, we will learn how large transportation operators such as UPS use GIS and mobile networking to drive efficiencies into their massive fleets of local delivery trucks. Then we will simulate similar operations with a local business that is ready to expand but must make critical transportation decisions that will affect its growth and profitability. Fortunately, as we will discover, there are GIS tools that can model alternative transportation schemes, and with methodical analysis provide the insights business managers need to make optimal decisions.
Global commerce introduced efficiencies into large-scale logistics and led to standardized protocols of electronics, transportation signage, shipping container dimensions, metal fabrication strengths, and classifications of business. To grasp the potential applications of location intelligence with new technologies and standards, it is important for us to examine business sectors and topics such as:
- Financial Services
- Retail
- Real Estate
- Insurance
- Location-Aware Mobile Messaging
- Customer Experiences
- Healthcare
Learning Objectives
At the successful completion of Lesson 7, you should be able to:
- identify sectors of an economy and recognize secondary relationships of industries that make products and provide services;
- describe network routing and scheduling, distinguishing between point-to-point and multi-point methods;
- describe mobile, location-based applications including field service management and mobile asset management;
- describe the mobile technologies (GPS, AVL) used to support transportation applications;
- identify industries and their associated logistics applications including trucking/delivery, airline, train, and utilities.
What is due for Lesson 7?
Lesson 7 will take us one week to complete. There are a number of required activities in this lesson listed below. For assignment details, refer to the lesson page noted.
Note: Please refer to the Calendar in Canvas for specific time frames and due dates.
| 7.1 Sectors of an Economy | ||
|---|---|---|
| Requirements | Details | Access / Directions |
| Read |
Read the course content. |
Use the Lessons menu or the links below to continue moving through the lesson material. |
| Murphy, Geography: Why It Matters, Chapter 5 Why We All Need Geography (pp.110-125) | The Geography: Why it Matters reading is from the required textbook for this course. | |
| Deliverable | No Deliverable for 7.1 | N/A |
| 7.2 Introduction to Transportation Sector: Routing, Scheduling and Telematics | ||
|---|---|---|
| Requirements | Details | Access / Directions |
| Do/Read | Read the course content. | Use the Lessons menu or the links below to continue moving through the lesson material. |
| Watch video/Read articles on routing, scheduling, telematics. | Video and readings are provided in the course content. | |
| Deliverable | Reply to at least one question, due Tuesday. | Post in Canvas to the Lesson 7.2 - Transportation Sector forum. |
| 7.3 Case Study in Routing/Scheduling | ||
|---|---|---|
| Requirements | Details | Access / Directions |
| Read | Read the course content. | Use the Lessons menu or the links below to continue moving through the lesson material. |
| Do | Case Study in Routing/Scheduling, “Delivering the Goods” and “Growing Pains”. | Directions are provided in the course text. |
| Deliverable | Comment/screen shots, due Tuesday. | Post comment in Canvas to the Lesson 7.3 - Case Study: Transportation & Routing forum. |
| 7.4 Additional Sectors | ||
|---|---|---|
| Requirements | Details | Access / Directions |
| Read | Read the course content. | Use the Lessons menu or the links below to continue moving through the lesson material. |
| Skim | Links to content for 4 additional sectors of an economy. | Links are provided in the course text. |
| Deliverable | Quiz 3: Sector Applications in Location Intelligence due Tuesday. |
Registered students can access the quiz in Canvas in the Lesson 7 module. |
| 7.5 Continue Working on Your Term Project | ||
|---|---|---|
| Requirements | Details | Access / Directions |
| Read | Read the course content. | Use the Lessons menu or the links below to continue moving through the lesson material. |
| Do | Continue gathering data, making maps/reports, and preparing for your presentation. | Manage your time wisely. |
| Deliverable | No Deliverable for 7.5 | N/A |
7.1 Sectors of an Economy
The geo-advantages which Ryerson and Aronoff describe in Why ‘Where’ Matters vary across sectors of an economy. Industries are the production of goods or services that contribute to a nation’s gross domestic product (GDP). Standard classification systems ensure clarity in describing industries and communicating the purpose, products, and sector of a business. There are differences in US and global classifications; but most share similar major sectors. NAICS was discussed in Lesson 4, matching the industry sectors published by the Bureau of Labor Statistics, U.S. Department of Labor [69].
The most general description of industry is into primary, secondary, and tertiary:
- Primary sectors, as transforming natural resources into primary products, e.g., agriculture, fishing, forestry, and mining.
- Secondary sectors, as finished products used by end consumers and businesses that have factories, use machinery, and consume energy; e.g., aerospace, automobile, apparel, chemical, textile, consumer electronics, energy, metals, industrial equipment, or shipbuilding.
- Tertiary, or the Services sectors, delivering intangible goods and services, e.g., banking, insurance, transportation, retail, education, tourism, news, hospitality, or consulting.
Financial Markets use the Global Industry Classification Standard (GICS) [70], developed by MSCI & Standard and Poor’s:
- Energy
- Materials
- Industrials
- Consumer Discretionary
- Consumer Staples
- Health Care
- Financials
- Information Technology
- Telecommunication Services
- Utilities
- Real Estate
The Bureau of Labor Statistics organizes industry sectors into broad classes (Table 6.1):
- Goods Producing sectors, e.g., natural resources and mining, construction, manufacturing
- Service Providing sectors, e.g., trade, transportation, utilities, information, Financial activities, professional and business services, education and health services, leisure and hospitality, legal, healthcare, and entertainment
- Agriculture, forestry, fishing, and hunting
| Industry Sector | Employment | Change | Percent distribution | Compound annual rate of change | ||||||
|---|---|---|---|---|---|---|---|---|---|---|
| 2006 | 2016 | 2026 | 2006-16 | 2016-26 | 2006 | 2016 | 2026 | 2006-16 | 2016-26 | |
| Total(1) | 144,047.0 | 150,539.9 | 160,328.8 | 6,492.9 | 9,788.9 | 100.0 | 100.0 | 100.0 | 0.4 | 0.6 |
| Nonagriculture wage and salary(2) | 132,462.2 | 139,811.5 | 149,131.6 | 7,349.3 | 9,320.1 | 92.0 | 92.9 | 93.0 | 0.5 | 0.6 |
| Goods-producing, excluding agriculture | 21,815.3 | 19,170.5 | 19,227.0 | -2,644.8 | 56.5 | 15.1 | 12.7 | 12.0 | -1.3 | 0.0 |
|
523.2 | 843.8 | 924.0 | 320.6 | 80.2 | 0.4 | 0.6 | 0.6 | 4.9 | 0.9 |
|
6,976.2 | 6,138.4 | 6,928.8 | -837.8 | 790.4 | 4.8 | 4.1 | 4.3 | -1.3 | 1.2 |
|
14,315.9 | 12,188.3 | 11,374.2 | -2,127.6 | -814.1 | 9.9 | 8.1 | 7.1 | -1.6 | -0.7 |
| Services-providing | 110,646.9 | 120,641.0 | 129,904.6 | 9,994.1 | 9,263.6 | 76.8 | 80.1 | 81.0 | 0.9 | 0.7 |
|
563.8 | 553.0 | 505.1 | -10.8 | -47.9 | 0.4 | 0.4 | 0.3 | -0.2 | -0.9 |
|
5,663.0 | 5,826.0 | 6,151.4 | 163.0 | 325.4 | 3.9 | 3.9 | 3.8 | 0.3 | 0.5 |
|
15,058.2 | 15,364.5 | 16,129.1 | 306.3 | 764.6 | 10.5 | 10.2 | 10.1 | 0.2 | 0.5 |
|
4,248.6 | 4,640.3 | 4,776.9 | 391.7 | 136.6 | 2.9 | 3.1 | 3.0 | 0.9 | 0.3 |
|
3,118.3 | 2,739.7 | 2,712.6 | -378.6 | -27.1 | 2.2 | 1.8 | 1.7 | -1.3 | -0.1 |
|
8,105.1 | 7,979.5 | 8,486.7 | -125.6 | 507.2 | 5.6 | 5.3 | 5.3 | -0.2 | 0.6 |
|
16,394.9 | 19,096.2 | 20,985.5 | 2,701.3 | 1,889.3 | 11.4 | 12.7 | 13.1 | 1.5 | 0.9 |
|
2,762.5 | 3,417.4 | 3,756.1 | 654.9 | 338.7 | 1.9 | 2.3 | 2.3 | 2.2 | 0.9 |
|
14,429.8 | 18,057.4 | 21,852.2 | 3,627.6 | 3,794.8 | 10.0 | 12.0 | 13.6 | 2.3 | 1.9 |
|
12,493.1 | 14,710.0 | 15,651.2 | 2,216.9 | 941.2 | 8.7 | 9.8 | 9.8 | 1.6 | 0.6 |
|
6,188.3 | 6,394.0 | 6,662.0 | 205.7 | 268.0 | 4.3 | 4.2 | 4.2 | 0.3 | 0.4 |
|
2,730.0 | 2,729.0 | 2,345.6 | -1.0 | -383.4 | 1.9 | 1.8 | 1.5 | 0.0 | -1.5 |
|
18,891.3 | 19,134.0 | 19,890.1 | 242.7 | 756.1 | 13.1 | 12.7 | 12.4 | 0.1 | 0.4 |
| Agriculture, forestry, fishing, and hunting(3) | 2,111.3 | 2,138.3 | 2,027.7 | 26.9 | -110.5 | 1.5 | 1.4 | 1.3 | 0.1 | -0.5 |
|
1,149.0 | 1,384.0 | 1,307.3 | 235.0 | -76.7 | 0.8 | 0.9 | 0.8 | 1.9 | -0.6 |
|
962.3 | 754.3 | 720.4 | -208.1 | -33.8 | 0.7 | 0.5 | 0.4 | -2.4 | -0.5 |
| Nonagricultural self-employed workers | 9,473.6 | 8,590.2 | 9,169.5 | -883.4 | 579.3 | 6.6 | 5.7 | 5.7 | -1.0 | 0.7 |
Footnotes:
|
||||||||||
| Source: Bureau of Labor Statistics, 2018. Employment by major industry sector. [71] | ||||||||||
Similar classification schemes assist in standardizing the descriptions of global commerce.
- The Tokyo Stock Exchange (TSE/TYO), or Nikkei, references Japan Standard Industrial Classification [72] for business activity census.
- The European Commission classifies economies by the International Standard Industrial Classification (ISIC) [73], common to United Nations standards.
7.2 Introduction to Routing, Scheduling and Telematics
Watch this video about the Geospatial Revolution (5:13):
JACK LEVIS: Geospatial technology allows us to turn data into knowledge. When you have 60,000 drivers, if I can just reduce one mile per driver per day, that's more than 20 million miles a year. That's tires that aren't being wasted, that's 2 million gallons of fuel, that's 20,000 metric tons of carbon not going into the air, if I can just save one mile. We spend about $1 billion a year on technology to make that happen. TIMOTHY AHN: In an average day, I will do 115-125 stops. I'll travel probably anywhere from 120 to 140 miles depending on the route of that day. Some packages have to be delivered by 8:30, some by 10:30, some by noon. Pickups in the afternoon and then some special things for customers. JACK LEVIS: So our mathematicians or our operations researchers, by using the data from the geospatial technologies, use analytics and create algorithms to take this huge amount of alternatives and turn that into the route that's the best for today. SPEAKER 1: Have a good day, people. JACK LEVIS: So when a package comes in the building, we print out a label that tells us what package car it goes into, where in the car it goes, what order the driver is going to deliver it. And then we move the electronic data into the driver's handheld computer so they have that at the same time. SPEAKER 2: So it looks like the flow is pretty good. We may want to change the time on that pickup. Make that a 1:30. TIMOTHY AHN: This little device gives me a preplanned ideal way to deliver things and what my day is going to be. I look at the delivery order listing so I can envision how I'm going to do things, whether I want to make changes or whether I agree with it. WARREN CHAREST: Wrong place. TIMOTHY AHN: It's quite the tool to have. JACK LEVIS: It has a GPS chip inside of it, a communication device. So every time a driver makes a delivery we transmit up and say here's where the driver was at that moment. In the center, where the operations are occurring, they have a map and they can see every driver in their delivery territory and where they are in near-real time. So if a customer calls and says, I need an on-demand pickup, we can look and say what driver is the better driver to give it to. So she takes it, she drags it over to the route she wants to dispatch it to. Automatically goes into that driver's handheld computer and the driver says, yep, I can do it, or there's something I know you don't, sorry, I can't, sends it back. JOE SAVAGE: Telematics yesterday, phenomenal results. We had one seat belt event yesterday. Telematics helps me communicate with my workforce. --of 14 bags per driver. I have real physical data that I can give back to them that we can use for improvement in the operation. JACK LEVIS: We put sensors on a vehicle to tell us if a vehicle's backing, if the driver's seat belt's on, if they shut the door behind them. JOE SAVAGE: The biggest thing of it is the safety perspective. How about this one? I can look at the speed that they're traveling throughout the day. I can look at it whether they stop at a stop sign. Let me ask you about this one, since I got you. And I can see how far they backed their vehicle up. There was a reason why you backed out. TIMOTHY AHN: That is a 55-mile zone, and I'd just rather just stay out of the way. JOE SAVAGE: So you backed in the line to avoid the curb. JACK LEVIS: Sometimes the driver says, nope, I consciously did that. JOE SAVAGE: OK, that makes perfect sense. JACK LEVIS: And that conversation can make our people and customers more safe. When you see little red circles, that's where something's wrong with the map. It takes a human along with the software, and sometimes we have to call the best experts and that's our drivers. WARREN CHAREST: We use this tablet to plot roads that either don't go through or we wouldn't send a package car down there, there's better ways to deliver from point A to point B. We're looking for also new developments. Many times with GPS data, new developments come in, and the map just hasn't caught up with it. WARREN CHAREST: Point Sewell Road. TIMOTHY AHN: OK. JACK LEVIS: So if he brings up some readings of where drivers have driven, there's a road missing, he'll draw in the road. Everything will snap, the red dots will go away, and we've updated that portion of the map. The world changed around us, so we took all that information that's in people's heads and we put it in computer systems. And we put it all on a map. We've moved from being a trucking company that has technology to a technology company that just happens to have trucks.
Skim:
- Ryerson, et. al., Why Where Matters, skim Chapter 3 [75] excerpt “GPS/GLONASS [76]”
- A Primer: Five Ways GPS Vehicle Tracking Can Reduce Fuel Costs [77], by David Patterson, Directions Magazine, 2011.
- Field Service Management--Where Logistics Meets Location Technology [78], by Joe Francica, Directions Magazine, 2005.
- Roadnet Technologies Inc. Introduces Geotuning, New Logistics Tool Designed to Provide Greater Geo-location Accuracy for Fleets and Mobile Workers [79], Directions Magazine, 2011.
- Dan Blacharski. 2019. The real key to retail growth in last mile delivery [80]. CustomerThink. 5 Mar 2019. Blog. [10]
Consider the following questions:
In the very last statement (in the Geospatial Revolutions video), the UPS manager describes the company as one that is “an information company that just happens to own trucks” rather than a trucking company that uses information.
- Why do you think the UPS manager described the company in those terms?
- Has technology and information become more important than physical assets?
- Regarding the "Field Service Management..." and "Roadnet Technologies Inc." articles, briefly what process has improved dramatically between the articles written in 2005, 2011, and today?
- What other industries utilize logistics?
Deliverable:
Post a comment in Canvas to the Lesson 7.2 - Transportation Sector forum.
- Choose one of the above questions and post your response.
- Reply to one of your peers' posted comments.
Due Tuesday 11:59 pm (Eastern Time).
Check the Calendar in Canvas for specific time frames and due dates.
Glossary of Transportation and Logistics Terms
If you are not familiar with logistics, supply chain, or transportation terminology, a quick internet search of federal or state Department of Transportation sites provides definitions and context.
Just-in-Time supply chains rely on a system where components or assembled products must be delivered to a destination at the exact time needed. The container or vehicle transporting the goods is the movable warehouse.
Route is the manner or track that a shipment moves; including the carriers handling it and the points where carriers transfer responsibility for delivering the goods.
Routing or route planning is an optimized delivery plan to coordinate multiple destinations, products, and customers. The process calculates the most cost-effective geographic routes for delivering goods to multiple stops (nodes) by minimizing the distance and/or time elapsed. Routing maps are provided to drivers in electronic, audible, and dynamic nagivation systems with options of integrated GPS, fuel efficiency measurements, and traffic analysis.
Supply chains are the logistical management system which integrates a sequence of activities; starting with delivery of raw materials to the manufacturer along a system of nodes and chains to delivery of the finished product to a customer.
Telematics are networked electronic sensors and component computers which are integrated in an information technology system to transmit real-time data. Telematics connect vehicles on the move, road safety systems, logistics networs for asset management, electical engineering, and company computer enterprise systems. Modern technologies create the networked environment using global satellite navigation systems (GPS, GNSS, GLONASS), cellular and wireless data transmission, IoT, and intelligent vehicle technologies.
7.3 Case Study in Routing/Scheduling
Case Study, Part 1: Delivering the "Goods"
You have been hired as a consultant to help "Sweet Nothin's Tasty Muffins" to understand their delivery needs and suggest a solution for their business. Please review the Scenario below and identify the following:
- How will geospatial thinking and technologies help the business?
- Is their problem just a routing problem, or is there more to the story?
- What "free" or "very low-cost" online applications will help Sweet Nothin's address their needs?
- RouteXL [81] (RouteXL 20 - Free)
- PC*MILER [82] by Trimble MAPS
- MyRouteOnline [83]
- Route4Me [84]
- Mapbox [85]
Your challenge is to identify the best and lowest cost solution for Sweet Nothin's Tasty Muffins. There is a rumor that they may be acquired by a very large bakery and will need a full time consultant to help manage their growth. In some sense, this is a full-time job opportunity.
Scenario:
The bakery, "Sweet Nothin's Tasty Muffins," (located at 100 West College Ave, State College, PA, 16801) has built a good reputation over the last two years for high quality baked goods. The business has grown from delivery of muffins out of your home kitchen to the great downtown State College bakery location.
Recently, Sweet Nothin's been contacted by Starbucks' district manager for the Centre region and a couple of additional local coffee houses in nearby towns to provide all of their muffins, scones, and coffee cakes. This opportunity could provide a chance for real growth—Sweet Nothin's knows their baking staff can handle the increased demand, but they need to ascertain whether you can handle the delivery logistics associated with this sudden growth.
Currently, they deliver all of the goods to the handful of shops they do business with. They know they are going to have to hire drivers and secure delivery vehicles but they are not sure if they need 1, 2, or 3 drivers to handle the increased business. Their good friend, a local florist, tells them he uses a routing application to help with planning his deliveries—they want to try a software package to see if it will help with their dilemma. Starbucks and the other potential customers would like to make the switch to Sweet Nothin's baked goods soon, so they had better get started planning!
At least two of their bakers, Barb and Johan, are interested in picking up some additional hours, and, lucky Sweet Nothin's, they both have minivans with roomy cargo areas! Until Sweet Nothin's is reaping the rewards of the continuous increased business, they decide Barb and Johan are the perfect solution to their near-term plans.
Guidelines:
In addition to your own assessment of the situation and conversations with the coffee shop managers, the following are guidelines for solving their delivery dilemma:
- Barb and Johan will each drive their own minivans. Sweet Nothin's want to provide them roughly the same extra income, so they plan to have 2 drivers with approximately the same availability.
- Sweet Nothin's current baking schedule allows for the vans to be packed and ready to start delivering at 4 am. You would like to pay Barb and Johan roughly two extra hours wage, so Sweet Nothin's initial plan calls for deliveries to be completed by 6am.
- Starbucks has insisted that its deliveries arrive no later than 5:30 am to be in the counter cases when their stores open.
- It takes approximately 10 minutes for each delivery (to park, take the trays in and hand over the invoices). Sweet Nothin's will use a 10 minute service time to start their planning.
- Each driver can handle 10 orders in his/her minivan. (At this point, Sweet Nothin's is only planning 10 total "orders"—this should be more than enough, as combined, Barb and Johan can handle a total of 20 "orders".)
Key Consulting Steps in Selecting a Solution:
Step 1. "Drivers" You will need to create a driver record for Barb and one for Johan.
Make sure you include:
- Starting location (the routes will be roundtrip to/from Sweet Nothin's Tasty Muffins downtown bakery).
- Start and Finish times.
- Load Capacity.
Step 2. "Add Orders" listing all of the addresses of Sweet Nothin's potential customers.
Note: You may find problems with geocoding, based upon the data you got from your customers. (HINT: The airport is in the 16823 ZIP code. And while the Starbucks on N. Atherton has a mailing address in State College, it is technically located in Park Forest Village, PA.) You need to be able to correct addresses and geocoding when update your orders.
Also, you will need to provide the ability to adjust the orders to meet any special customer requirements.
Step 3. "Plan Optimal Routes" Once you've set all of the driver and order criteria to meet the guidelines, you can plan your routes! You may find it necessary to adjust certain elements to develop a desirable routing plan—remember, Sweet Nothin's is counting on you to spend their dollars wisely to efficiently plan their routing. (Hence, you may find it necessary to adjust your or your customers' expectations.)
Step 4. Once you have a route plan with which you're comfortable, save this route plan so you can return to it later.
Now, with this route plan established, move on to part 2:
Case Study, Part 2: Growing Pains
Congratulations—Sweet Nothin's Tasty Muffins continues to grow and experience success! But with all growth comes growing pains—consider variations in this section (Part 2) on your current routing solution for Sweet Nothin's.
Perhaps Sweet Nothin's should call their business Sweet Nothin's Tasty Muffins and Such? Starbucks has asked them to supply ALL of its local baked goods. It's time to revisit your routing solution—you're going to need to allocate their drivers differently to accommodate the growth at Starbucks.
Are you able to do the following with one solution and not another?
Step 1. Open your saved routing plan.
Step 2. Increase the "Load Units" for the three Starbucks locations from "1" to "3" to accommodate space in the vehicle for the additional delivery goods.
Step 3. Better increase the "Service Time" too—it won't take three times as much to unload, but perhaps you need 15-20 minutes at each location?
Step 4. Barb really prefers to drive in and near State College (where all three Starbucks are located)—assign Barb to the Starbucks locations.
Step 5. How do these changes affect your routing solution? What other accommodations will you need to make?
Deliverable:
Post a comment in Canvas to the Lesson 7.3 - Case Study: Transportation & Routing forum including:
- A screen shot of the Part 1 route map and any brief comments you wish to make about the process (ease of use, missing features, additional considerations).
- NOTE: Please make sure your screen shot is "zoomed" to something visible--a screen shot of your entire monitor may not be as valuable as a screen shot of a very interesting route or Gantt chart.
- NOTE: Please keep your comments brief here and limit your screen shots
- Discuss your success in adapting to this new Part 2 routing plan, using the questions in Step 5 to guide your discussion.
- Include a screen shot of the Part 2 route map, driver Gantt chart or order schedule, as necessary, to support your discussion.
Due Tuesday 11:59 pm (Eastern Time)
Check the Calendar in Canvas for specific time frames and due dates.
7.4 Additional Sectors
Skim the following material about Location Intelligence applications. While reading, think about the applications and the possibilities for other sectors.
Insurance
Breading, Mark. 2018. The Most Important (and Overlooked) Tech. Location Intelligence Archives – Insurance Thought Leadership [86]. Blog (web). 24 Jul 2018.
Insurers should consider an enterprise location strategy which improves the use of GIS to store georeferenced demographic and connected sensors data, new spatial technologies for indoor and 3D mapping, and open platforms to gain improvements through collaboration. The data scientist role is emerging in insurance with significant access to open source and third-party data on weather events and forecasts, geographic location attributes, and consumer behavior.
Healthcare
Murray, Peter. 2018. Meet the growing demand for senior care facilities with a modern site planning approach [87]. CARTO. Blog. 13 Jun 2018.
Healthcare site planning now considers population behavioral patterns and human geography. The author indicates a trend where more seniors are moving to cities and metro areas to retire close to adult children. Location intelligence provides decision makers criteria, optimal sites, and recommendations to locate new healthcare and assisted living centers to meet future senior needs.
Banking
Voorhees, John. 2018. Secrets to Successful Branch Distribution [88]. Peak Performance consulting Group. 23 Aug 2018. Webinar.
Banks consider both location and site to grow and/or consolidate their branch banking operations. Locations and trade areas optimize where people shop, live, and commute; sites attract customers and align with local businesses. The financial intuition which creates the most convenient network will gain a greater share of customers and deposits.
Sustainability
Denchak, Melissa (2018). Flint Water Crisis: Everything You Need to Know. Natural Resources Defense Council (NRDC). 8 Nov 2018. https://www.nrdc.org/stories/flint-water-crisis-everything-you-need-know [89]
U.S. Geological Survey (USGS). (2020). New Report Presents a Framework for Assessing the Sustainability of Monitored Natural Attenuation. USGS: Environmental Health – Toxic Substances Hydrology Program. Online https://www.usgs.gov/publications/usgs-toxic-substances-hydrology-program-2010 [90]
Wiitala, S.W., Vanlier, K.E., & Krieger, R.A. (1963). Water Resources of the Flint Area Michigan. Department of the Interior, USGS: Geological Survey Water-Supply Paper 1499-E. The preservation of natural resources is not just a 21st-Century concern.
The U.S. Geological Survey (USGS) monitors water quality in surface waters and groundwater aquifers to study the availability, use, and quality of water for residential, business, industry, agriculture, energy production, and recreation access. Water is critical to balancing sustainable development and societal-environmental interdependence. Businesses and communities share a responsibility for the appropriate use of natural resources—to include water—without damaging the environment, conducting illegal activities, or drawing an unfair share of resources from society and nature. The Flint River crisis in Flint, Michigan highlights a recent example of harmful lead contamination in the public water sources impacting the health of citizens relying on their community.
Murphy reinforces tracing the connections of human-environment dynamics and understanding that what happens in one place affects or is affected by activities elsewhere (2018: pp.102-103). Geospatial analysis is central to modeling and confronting environmental sustainabilty challenges.
"Consider the local organic foods movement that has taken root in the United States and Europe over the past couple of decades. The movement was driven by a desire to promote sustainable local farms, undermine the power of corporate agriculture, and reduce the environmental impacts of the long-distance transport of consumables."
Utilities
Emison, Bill. 2018. myWorld: A radical approach to location intelligence for non-GIS users in utilities [91]. SPAR3D. 1 Nov 2018.
The Utility sector includes facilities management, power generation and distribution, utility companies, and municipalities controlling infrastructure operations. The entire concept of Smart Cities highlights the connection of utilities, sensors, location intelligence, mobile communications, enterprise and cloud computing, and the ability for field workers to access accurate geospatial data.
No Deliverable required for this activity
There are no deliverables for 7.4 Additional Sectors, however, you must complete Quiz 3 as part of this weeks assignments. (See Deliverable below.)
Deliverable:
Quiz 3: Sector Applications in Location Intelligence
Before moving on to this weeks information about the term project, please remember to return to Lesson 7 module in Canvas to take the Quiz 3: Sectors and Location Intelligence Companies/Platforms
Due Tuesday night 11:59 pm (Eastern Time). Check the calendar in Canvas for specific time frames and due dates.
7.5 Term Project – Continue Working on Your Final Project Report
Similar to Week 5, there is no specific deliverable required this week for your term project, but you really should be aiming to make some progress on your project this week!
Don't forget to allocate time this week to work on data gathering/research for your term project.
For the remainder of the term, if you have questions about your term project from which your classmates would benefit, please use the Term Project Discussion Forum - Questions, Answers & Advice. We will provide a link to the forum in the rest of the modules in Canvas. We will keep a running thread of project related questions, answers, and advice there through the rest of the course.
Deliverable:
There are no deliverables for your term project this week.
Lesson 8: Sector Applications of Location Intelligence, Part 2
8.0 Introduction to Lesson 8
Location intelligence provides customer and situational insights when linked to indoor location analytics and connected sensors (IoT)—two exciting components of Omni-channel marketing. In the modern global economy, a company has both a physical and virtual market presence. Some business types rely on optimizing site locations and providing their product or service directly to meet customer needs. Other businesses deliver their products or services through eCommerce, thus requiring a different output of location intelligence.
Lessons 8 and 9 introduce applications of location intelligence technology to:
- analyze and leverage location data gathered in venue;
- make customer experience enjoyable and personalized;
- optimize the use of building and manufacturing spaces;
- create smart infrastructure that may sense activity in a location, interactively report the occurrence, and direct responses that mitigate a situation for safety, efficiency, or recommending corrections.
Consider how business decisions are made. Your understanding of a decision making process impacts this lesson’s activity, your GEOG 850 Term Project, and possibly interactions with your employer. What are presentation methods you can employ to support decision makers? What are they looking for to weigh recommendations and take action?
- Information/data
- Geospatial analysis
- Visualization and presentation
- Synthesizing observations and patterns for courses of action and decision making
Learning Objectives
At the successful completion of Lesson 8, you should be able to:
- classify location intelligence tools with functions of sectors of an economy;
- recognize secondary relationships of industries that make products and provide services;
- compare location intelligence companies and platforms using criteria you develop;
- evaluate current location intelligence tools to recommend one for a current business;
- describe the integrated network of IoT technologies (connected sensors) to support location intelligence in retail business; and
- create a Term Project presentation with audio to update the class on your project.
What is due for Lesson 8?
Lesson 8 will take us one week to complete. There are a number of required activities in this lesson listed below. For assignment details, refer to the lesson page noted.
Note: Please refer to the Calendar in Canvas for specific time frames and due dates.| 8.1 Indoor Location Analytics | ||
|---|---|---|
| Requirements | Details | Access / Directions |
| Read | Read the lesson content. | Use the Lessons menu or the links below to continue moving through the lesson material. |
| Deliverable | No Deliverable for 8.1 | N/A |
| 8.2 Internet of Things (IoT) and Connected Sensors | ||
|---|---|---|
| Requirements | Details | Access / Directions |
| Read | Read the lesson content. | Use the Lessons menu or the links below to continue moving through the lesson material. |
| Deliverable | Post a personal comment on decision making roles you have had relating to Location Intelligence, due Tuesday. | Post your comment in Canvas to the Lesson 8.2 - Geospatial Analyst Role in Decision Making forum. |
| 8.3 Selecting Location Intelligence for Your Business | ||
|---|---|---|
| Requirements | Details | Access / Directions |
| Read | Read the lesson content. | Use the Lessons menu or the links below to continue moving through the lesson material. |
| Selected white papers, company materials, and market studies on Location Intelligence Products | Registered students can access the reading in Canvas on the Lesson 8 Readings page. | |
| Do | Activity - Selecting Location Intelligence Providers and Platforms for Your Business. | Directions are provided in the course text. |
| Deliverable | Submit your presentation with recommended Location Intelligence platform, due Tuesday. | Submit your presentation in Canvas to the Lesson 8.3 - Selecting Location Intelligence System drop box. |
| 8.4 Term Project - Progress Update Presentation | ||
|---|---|---|
| Requirements | Details | Access / Directions |
| Read | Read the lesson content. | Use the Lessons menu or the links below to continue moving through the lesson material. |
| Deliverable | Post your Term Project – Progress Update Presentation, due Tuesday. | Submit your presentation in Canvas to the Term Project: Project Update Presentation with Audio drop box. |
| 8.5 (Optional) Additional Readings – Penn State Geo Vista Center | ||
|---|---|---|
| Requirements | Details | Access / Directions |
| Read | (Optional) read the lesson content about Penn State's Geo Vista Center. | Use the Lessons menu or the links below to continue moving through the lesson material. |
| Deliverable | No Deliverable for 8.5 | N/A |
8.1 Indoor Location Analytics
Indoor Analytics locates mobile devices inside and outside buildings. Retailers, for example, establish geofencing boundaries to detect customer smartphones and map their movement into a store, along aisles, measuring time spent near products of interest. Location intelligence derived from indoor geospatial analytics, consumer demographics, and proprietary business information assists a company to optimize the use of resources; e.g., marketing, sphere of influence, product shelving and layouts.
Digital mapping, visualized in 2D and 3D, enables indoor positioning, navigation, and direction mapping. Location intelligence from indoor analytics benefits a business to better understand how customers relate to zones in a store, visualizing time and motion patterns on dynamic maps. Marketing managers compare patterns of customer behavior inside and outside to marketing campaigns and optimizing store layouts. They use proximity campaign analytics with connected sensors to analyze relationships with customer movement, technology, and demographics. While this process benefits the success of a company, it also offers shoppers a personalized customer experience (objectively to meet their needs).
Large food vendors can enhance profitability by leveraging location intelligence and their marketing touchpoints (digital and physical) in large venues, e.g., shopping centers, exhibition centers, airports) with the use of (Figure 8.1):
- customer tracking with Bluetooth beacons, Wi-Fi
- location planning with insight into customer base
- adapting marketing message to analyze customer demographics and behavior
- dispatching promotional materials
- manner, timing, message
- digital geofences to trigger messaging
- timing of customer stay
Retail Applications of Location Intelligence
Grocery and Big Box stores leverage location intelligence, connected sensors, and the Internet of Things (IoT) to engage customers inside their stores. Shoppers hear the ubiquitous razor advertisement as soon as they turn into a pharmacy lane, scanned by a variety of sensors that detect the shopper's presence and proximal interaction with a display.
Omni-Channel Marketing
Why does a company wish to keep in contact with customers who have purchased from them?
An omni-channel marketing strategy uses multiple marketing channels to create a single user experience. The purchaser is the focus - yes, a target - with the understanding that a business is responsible to attract customers, the customer is not likely to spend additional effort to determine the value of a certain company's product. Omni-channel builds on the strengths and medium of each communication channel to deliver consistent, compelling brand messaging to consumers. The compounding advantage of omni-channel applies to retail businesses with physical and digital presence. Metrics that marketing departments rely on include message engagement, customer retention, conversion, budget spend, and customer purchase rates. Goals of branding and marketing campaigns are strategic and depend on the products, markets, competetion, consumers, and costs:
- increasing brand awareness
- encouraging engagement from customers
- generating sales and
- expanding the uses of products
Customers seek advantages such as "good deals" through discounts, coupons, product samples, rebates, loyalty rewards, recognition as a valued customer, and free shipping. With everyone connected to the internet through computers, wearables, smartphones, social media platforms, short message service (SMS) texting, virtual assistant AI technology (think Alexa or Siri), and vehicle wifi, there are numerous ways to reach consumers with brand messaging and enticements to purchase products.
In Omnisend's recent review of 2019 Onmichannel branding, they report that "...over the last year, marketers using three or more channels in any one campaign earned a 287% higher purchase rate than those using a single-channel campaign." Data shows that consumers approached with a single channel purchsed products 3.21% of the time vs. those reached via three or more channels purchasing products 12.43%. https://www.omnisend.com/blog/omnichannel-statistics/ [92] So much depends on the way buyers choose to shop. From our earlier lessons in demographics and human behavior, there are distinct differences in how generations select, try-on, decide to buy, and purchase products.
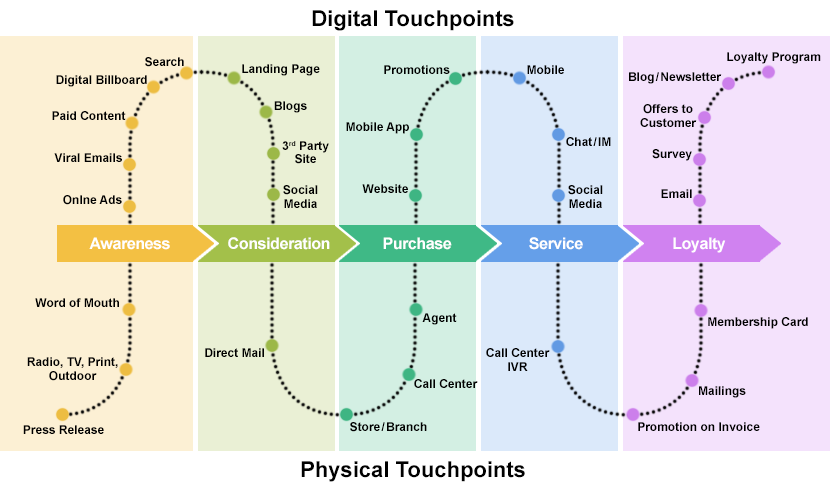
Deliverable:
No deliverable for 8.1
8.2 Internet of Things (IoT) and Connected Sensors
The IoT is a complex 21st century phenomena characterized by a network physical objects in the physical world connected to digital infrastructure in the virtual world. Retail business connects sensors, IoT, and omni-channel marketing to gain advantages and optimize their marketing, sales, and operations costs. The process also drives competition and innovation to meet customer needs. Watch the video for other indoor uses of IoT and location intelligence.
Video 8.2 Internet of Things (IoT) and Location Intelligence: Customer Engagement (length 1:32). Esri, 12 Jun 2018
IoT architects rely on four fundamental components of embedded sensing, continuous connectivity to the internet, integrated smart computing, and virtual interfaces to engage devices without requiring physical contact. AI software tools enable business to identify consumer trends and behavior, collect a large database of niche markets; in essence, as a business information process.
Customers’ use of smartphones near and within stores allows businesses to access dynamic site data such as location, location preferences, duration of stay, and frequency of visits. The ability to embed location data and spatial analytics delivers value for business decision making, actions, experiences. Dynamic data enables organization to predict customer behavior and their buying patterns. This is then incorporated into location-based marketing to aid conversion and improve customer experiences.
Deliverable:
Post a comment in Canvas to the Lesson 8.2 - Geospatial Analyst Role in Decision Making forum.
- Briefly relate your previous or current role in decision making at an organization relating in some way to location intelligence.
- Have you been the decision maker, part of the process, submitted geospatial analysis results for location intelligence-like decisions? What was the circumstance?
Don't forget to comment on your peers posts.
Due Tuesday 11:59 pm (Eastern Time).
Check the Calendar in Canvas for specific time frames and due dates.
8.3 Selecting Location Intelligence for Your Business
At this point in the course, you are ready to organize and establish criteria for selecting the optimal location intelligence system for your organization. I want you to choose an organization you represent (in real life or choose a business), read the following Lesson 8.3 references, and create a matrix of features and benefits of current Location Intelligence products.
8.3 Activity:
You are a geospatial analyst recommending to your boss a process and visualization for selecting the best location intelligence product/platform/service for your organization’s needs. Some considerations are:
- What features are critical/important/useful in a location intelligence system?
- What priority do you set on the criteria? Organize in a visually effective format that supports professional decision-making.
- What are the top 5 – 10 location intelligence platforms you recommend to your boss? Create a matrix-like visualization comparing the products and what they offer for your organization.
- Do not consider cost as a decision criteria for this assignment. (While cost may be the most important factor for many business leaders, your comparative analysis is highly valuable for selecting a location intelligence system.)
Read the course references on available Location Intelligence companies and platforms, conduct any additional research you feel is necessary.
- Your goal is to research existing location intelligence companies/platforms as well as the range of possible design choices.
- Select a strategy for selecting or creating a location intelligence solution.
- Identify a litmus test of location intelligence platforms to transform location data into business outcomes.
- Spatial analysis is a location intelligence tool. What are the other location intelligence tools and techniques?
Discuss decision making:
- Design a decision matrix from research + white papers. What factors should be considered?
- Recommend one solution to your boss and justify with features and benefits of that location intelligence product.
What Software Tool Should Be Employed?
Open-source software is free and has many features; but may not scale as well, or be as maintainable, as the commercial tools over time.
Commercial software is often expensive, designed primarily for specific purposes, or offering extensions for projects at additional costs; but has known quality, is more maintainable, and is more readily accepted by IT managers than open-source tools. Using open source tools, when possible, frees up project budget to develop models that will deliver the desired value.
What business questions would assist in your approach?
Read:
The following references include objective white papers, promotional company product descriptions, market studies, and blog articles. Scan the material to complete the activity for 8.3:- McCormick, James & Miller, Emily. 2018. The Forrester Wave: Location Intelligence Platforms, Q4 2018. Tools and Technology: The Digital intelligence Playbook [93]. Forrester.com. Cambridge, MA: Forrester Research Inc. 5 Dec 2018.
- Dresner. 2016. Location Intelligence Market Study: Wisdom of crowds series [94]. Dresner Advisory Services: 2016 Ed. Report.
- Esri. 2015. The Science of Where – Applying Location as a Service (LaaS) for Omni-channel [95]. Redlands, CA: Esri. Marketing. Dec 2015.
- Global Justice Information Sharing Initiative Intelligence Working Group. Analyst Toolbox: A Toolbox for the Intelligence Analyst [96]. Washington, D.C.: U.S. Department of Justice. 2007.
- Micek, Brittany. 2017. A Really Good Guide on Location Intelligence Implementation [97]. CARTO Blog.: Location Intelligence. 11 May 2017. Online.
- G2 Crowd. 2019. Best Location Intelligence Software [98]. G2 Crowd Grid for Location Intelligence. Online.
- Grandview Research. 2018. Location Intelligence Market Size, Share & Trends Analysis Report [99]. Grandview Research. Report ID: GVR-2-68038-401-7. . 2018-2025.
- Ubisense. 2015. Location Intelligence Solutions [100]. Ubisense Group PLC. Annual Report, 2015.
Deliverable
Post a comment in Canvas to the Lesson 8.3 Discussion Forum including:
- From your research, write a recommendation to select a location intelligence system for your organization. Include:
- criteria of your business needs that is significant to considering a location intelligence system;
- visual comparison of the features & benefits of current location intelligence company products or systems;
- recommendation of the best system that meets your organization’s location intelligence needs; note several reasons that support your choice.
- Attach your Word document to the Lesson 8.3 Discussion Forum with a short comment on your recommendation.
Due Tuesday 11:59 pm (Eastern Time)
Check the Calendar in Canvas for specific time frames and due dates.
8.4 Term Project - Progress Update Presentation
Having worked through two iterations of your question/case for your term project and several weeks gathering data, analyzing your problem, and preparing maps and reports, it's now time to present the current state of your project to the class for feedback.
This will be a presentation with audio—a video. You may create your video in Powerpoint (insert audio), Google Slides (insert audio), Kaltura (through Canvas), or VoiceThread. The deliverable will be either an attached file or a link to your .mp4, URL, or other formatted video file.
Guidelines:
- Create a 5-7 minute PowerPoint presentation on your term project.
- Include no more than 5 slides/images/maps/reports.
- State clearly and concisely your question or case, including situating the geography of the locale in your analysis.
- Include examples of the kinds of data you are investigating and an overview of your method. (NOTE: You won't have time in this presentation to include every data type or every step--provide your peers and me a good overview. The intention of the presentation is that you will get peer and instructor feedback on your work thus far.)
- You will be evaluated on the following criteria:
- clarity and feasibility of your case/question;
- clear, concise presentation of ideas/data;
- graphics/maps/report excerpts that support your case/question AND are visually clear;
- substantive feedback/comments for your peers.
Deliverable:
Email a link to me and attach a link in the Canvas to the Term Project Drop Box - Progress Update drop box in the Lesson 8 module.
Due Tuesday 11:59 pm (Eastern Time)
Check the Calendar in Canvas for specific time frames and due dates.
8.5 (Optional) Additional Readings – Penn State GeoVISTA Center
Penn State’s GeoVISTA Center
Penn State’s GeoVISTA Center has its GeoCollaborative Crisis Management Research Project underway that addresses two fundamental problems that impede effective coordinated work with geospatial information in crisis management activities. First, current geospatial information technologies are hard to use and designed for use by individuals; they do not support group work effectively. Second, there is limited scientific understanding of how groups (or groups of groups) work in crisis management using geospatial information and technologies that can range from large screen displays in a command center to PDAs for field personnel.
Students interested in exploring more about this project can read about this Penn State Research Project [101].
The GeoVISTA Center is involved in studying Geovisual Analytics. This field is an emerging interdisciplinary field that integrates perspectives from Visual Analytics (grounded in Information and Scientific Visualization) and Geographic Information Science (growing particularly on work in geovisualization, geospatial semantics and knowledge management, geocomputation, and spatial analysis). Geovisual Analytics tools help identify relevant geospatial information, data, and knowledge by supporting analytical process that meld innate human abilities of vision and cognition with computer-based visual interfaces that provide flexible connections to relevant data and supporting knowledge, and that are specifically designed to provide support for analytical reasoning.
Students who are interested in exploring more about this Penn State Center can read about it at the GeoVISTA Center [102] website.
Lesson 9: Emerging Trends and Technologies
9.0 Introduction to Lesson 9
The ability to generate business intelligence from geolocation information is accelerating at an astonishing pace. This phenomenon is stimulated by the rapid advancement of several complementary technologies which in combination creates more market analytical potential than can be absorbed by businesses. In addition, other contemporary electronic media such as social media giants Facebook, Instagram, Snapchat, WhatsApp, and Twitter enrich their market value by supplementing their main offerings with geo-enabled features for both entertainment and advertisement. Who isn't surprised and then pleased to receive a discount notice from the cupcake shop that we just walked past?
In this lesson, we will explore together a range of technologies that are accelerating the usefulness, span of awareness, and market expansion of geo-location supported businesses. Each advance opens new opportunities for novel consumer retail and industrial business models, which at the same time radically disrupt standard businesses. Our aim is to gain an appreciation for these many new technologies and develop our critical thinking skills so we can identify and evaluate the next set of radical changes that are sure to continue to amaze us in the future.
At the conclusion of Geography, Why It Matters, Murphy describes the connection and importance of geography, knowledge, and an awareness of our environment (2018:p.132).
Geography has important contributions to make to all of these ends. It offers people critical insights into the organziation and character of the world around them, and it allows individuals to understand technologies that are affecting their lives. Geography yields insights that can help students of the discipline understand the changes unfolding around them and learn how to use tools for assessing and adapting to those changes. Moreover, it opens people's eyes and minds to the richness and wonder of the surrounding world; it heightens awareness of - and by extension concern for - distinctive places and environments; and it fosters curiosity that is rewarding in its own right. Geography is, in short, a key to making sense of our increasingly connected, crowded, environmentally fragile, and rapidly changing world.
Learning Objectives
At the successful completion of Lesson 9, you should be able to:
- define and describe emerging trends/technologies relevant to location intelligence in business settings;
- research and critically select web-based sources;
- integrate the foundation of a location intelligence technology with current and future applications;
- create an effective presentation of your research on a selected location intelligence trend;
- critique two peers’ Term Project Update Presentations and propose suggestions or improvements for their final reports.
What is due for Lesson 9?
Lesson 9 will take us one week to complete. There are a number of required activities in this lesson listed below. For assignment details, refer to the lesson page noted.
Note: Please refer to the Calendar in Canvas for specific time frames and due dates.
| 9.1 Introduction to Emerging Trends | ||
|---|---|---|
| Requirements | Details | Access / Directions |
| Read | Read the course content. | Use the Lessons menu or the links below to continue moving through the lesson material. |
| Hinchcliffe, “The ‘Big Five’ IT trends of the next half decade” | Registered students can access the reading in Canvas on the Lesson 9 Readings page. | |
| Newman, “Top 10 Digital Transformation Trends for 2019” Course text 9.1, Introduction to Emerging Trends | Registered students can access the reading in Canvas on the Lesson 9 Readings page. | |
| Skim | Murphy, Geography, Why It Matters, Ch.5 Why We All Need Geography, excerpt (pp.125-132) | The Geography: Why it Matters reading is from the required textbook for this course. |
| Articles on emerging trends/technologies. | Links to the articles are provided in the course text. | |
| Optional Readings | Bomberowitz, 5 Key Marketing Takeaways from Location-Based Marketing For Dummies. BostIn | Registered students can access the reading in Canvas on the Lesson 9 Readings page. |
| Morgan, A Practitioner’s View: 20 Top Brands Address Their Challenges With the Customer Experience Vendor Landscape | Registered students can access the reading in Canvas on the Lesson 9 Readings page. | |
| Morgan, The 20 Best Examples of Using Artificial Intelligence for Retail Experiences | Registered students can access the reading in Canvas on the Lesson 9 Readings page. | |
| Deliverable | Define Location Intelligence in your own words, due Tuesday. | Post your definition in Canvas in the Lesson 9.1 - Refined Location Intelligence Definition forum. |
| 9.2 Emerging Trends and Technologies | ||
|---|---|---|
| Requirements | Details | Access / Directions |
| Read | Read the course content. | Use the Lessons menu or the links below to continue moving through the lesson material. |
| Do | Select ONE from available topics and research. | Directions are provided in the course text. |
| Research addl. source(s) for your topic. | Look for resources on the Internet, in industry articles, and in scientific papers. | |
| Deliverable | Post your Executive Summary on an Emerging Trends topic, due Tuesday. | Post your summary in Canvas on the Lesson 9.2 - Emerging Trends Executive Summary forum. |
| 9.3 Term Project Providing Peer Feedback and Continue Working | ||
|---|---|---|
| Requirements | Details | Access / Directions |
| Read | Read the course content. | Use the Lessons menu or the links below to continue moving through the lesson material. |
| Deliverables | Provide feedback to 2 peers on their Term Project – Progress Update Presentation, due Tuesday. |
Provide your feedback in Canvas in the Lesson 8 Term Project: Project Update Presentation with Audio forum.
|
| No Deliverable on your Term Project, continue working to submit at end of Lesson 10. | Manage your time wisely. | |
But first, don't forget to return to your classmates' Term Project Presentations and offer feedback. Use the Term Project Discussion Forum - Peer Feedback on Progress Update located in the Term Project module in Canvas to submit your feedback. You'll find completed Term Project Presentations embedded on the next page of the course text.
Then continue with Lesson 9 . . .
9.1: Introduction to Emerging Trends
With increasing amounts of geospatial, imagery, and business information, a new paradigm is needed to develop location intelligence assessments. Geospatial analysts need the knowledge and capabilities that allow them to spend less time preparing foundational databases and more time analyzing and understanding the activities, relationships, and patterns discovered from primary sources.
Investments in mobile technology, artificial intelligence (AI), machine learning (ML), connected sensors of the Internet of Things (IoT), and indoor analytics create intelligent systems to improve situational awareness, solve complex problems, and identify interconnected location factors for business decision making.
Read:
The first article gives an overview of what the author saw as the major 21st Century shifts in information technology in 2011. This provides a good overview of technology trends in the industry.
- The "Big Five" IT trends of the next half decade: Mobile, social, cloud, consumerization, and big data [103], by Dion Hinchcliffe, ZDnet.com, October 2, 2011.
The second article provides a current perspective of applying technology, geography, and Location Intelligence for 2019.
- Daniel Newman. 2018. Top 10 Digital Transformation Trends for 2019 [104]. Forbes. 11 Sep 2018.
Skim:
- Murphy, Geography, Why It Matters, Ch.5 Why We All Need Geography, excerpt (pp.125-132)
The Geography: Why it Matters reading is from the required textbook for this course.
Optional Reading:
The author does a great job breaking down what marketers need to know about location-based services and key marketing takeaways.
- Justin Bomberowitz, September 7, 2011. 5 Key Marketing Takeaways from Location-Based Marketing For Dummies [105]. BostInno.com.
- Blake Morgan. 2019. A Practitioner’s View: 20 Top Brands Address Their Challenges With the Customer Experience Vendor Landscape [106].
- Blake Morgan. 2019. The 20 Best Examples of Using Artificial Intelligence for Retail Experiences [107]. Forbes. 4 Mar 2019. Online.
As you read the above articles, and prepare to investigate your own topic further, consider the following questions:
- How would you explain this technology to your classmates and/or others in business?
- What key terms/terminology are important to know and understand?
- What is the timeframe that you see this technology becoming widespread and impacting the market? (e.g., is this going to take 5, 10, 15, . . . years to have a significant impact, or are there stages along the way? Will it impact the business internally, its suppliers, or its customer.)
- What new business location intelligence opportunities might this technology provide?
Deliverable:
How has your understanding of location intelligence changed over the past 8 weeks? In Lesson 1, we examined a definition of Location Intelligence in Canvas. Consider how you have critically examined the principles, geospatial analysis, and applications—now, succinctly re-define location intelligence.
Post a comment in Canvas to the Lesson 9.1 - Refined Location Intelligence Definition forum, including:
- Re-define Location Intelligence in your own words;
- Your rationale;
- Citations of pertinent references you used.
(Don't forget to read, and then comment on another student's definition of Location Intelligence.)
Due Tuesday night 11:59 pm (Eastern Time).
Check the Calendar in Canvas for specific time frames and due dates.
9.2: Emerging Trends/Technologies
This week, you're going to be a content "expert" on one of the key trends or technologies listed in this section. You will begin with pre-selected readings, after which you'll research your selected topic with a critical eye for selecting additional readings to share with your classmates.
The activity will culminate in you providing a brief Executive Summary of your topic in Canvas to the Lesson 9.2 - Emerging Trends Executive Summary forum. Everyone in the class will be able to read your Executive Summary.
Step 1
Review the list of technologies listed below on this page.
Step 2
Log in to the Canvas Lesson 9.2 - Emerging Trends Executive Summary forum (Ungraded) and indicate your topic of interest. It is okay if up to 3 people are interested in the same topic; however, it is an individual effort, so everyone will have to submit their own Executive Summary.
Research:
Step 3
Read the pre-selected articles (if you have not done so already) to provide a context for your chosen (assigned) topic. (By all means, don't consider these articles as boundaries for your topic discussion--the articles below should start you thinking, however.)
Step 4
Find additional sources which you think would help your classmates understand the topic. (NOTE: Two or three high quality sources are the goal--you will be pointing your classmates to these additional sources as reference points for the material.)
Present:
Step 5
Prepare a brief presentation of your topic (PowerPoint, Word, or PDF). As always, be as brief and concise as possible, answering the questions from section 9.1 (listed again below):
- How would you explain this trend/technology to your classmates and/or others in business?
- What key terms/terminology are important to know and understand?
- What is the time frame that you see this trend/technology becoming widespread and impacting the market? (e.g., is this going to take 5, 10, 15, . . . years to have a significant impact, or are there stages along the way? Will it impact the business internally, its suppliers, or customers?)
- What new business opportunities might this trend/technology provide?
Your grade will be based upon your success in balancing a thorough answer with a concise yet appealing presentation of the material you deem essential.
Deliverable:
Post your executive summary in Canvas to the Lesson 9.2 - Emerging Trends Executive Summary forum.
A text post of a few short paragraphs is sufficient, provided your post addresses the above questions. Note, this is not a research paper (or even a short paper)--this is an executive summary--brief, key points should convey high-level understanding of the material and generate interest in your colleagues to further investigate topics on their own.
Due Tuesday 11:59 pm (Eastern Time).
Check the Calendar in Canvas for specific time frames and due dates.
Suggested Topics:
Cloud computing
- Eric Knorr.2018. What is Cloud Computing? Everything you need to know. [108] InfoWorld. Online. 2 Oct 2018.
- Cloud computing: this decade’s great disrupter of markets beyond IT [109], by Joe McKendrick, September 28, 2011, SmartPlanet
Social Networks
- Margot de Cunha. The Complete Guide to Instagram Analytics [110]. WordStream. 19 Feb 2019. Blog.
- Troy Lambert. 2016. Social Media is Crucial for Market Research and Your Social Strategy [111]. GISUSER.
- Kalev Leetaru. The Era of Precision Mapping of Social Media is Coming to an End [112]. Forbes. Online.
Mobile computing, mobile devices, geofencing
- Kantor, Marianna. 2018. Burgers for a Penny, and the Power of Location Intelligence [113]. Digital Transformation. Esri. 10 Dec 2018.
- Richard Harris. 2019. Apps from maps using location intelligence is a whole new world [114]. App Developer Magazine: iOS. 26 Mar 2019.
Big Data, Blockchain
- Divya Singh. 2019. A Beginner’s Guide to Big Data and Blockchain [115]. Data Science Central. 14 Mar 2019. Blog.
- Stores Contributor. 2019. Trust and Courage [116]. National Retail Federation Magazine. 18 Feb 2019. Online.
- Following Digital Breadcrumbs to ‘Big Data’ Gold [117], by Yuki Noguchi, November 29, 2011, National Public Radio
Augmented Reality, Virtual Reality
- Carmen Apostu. 2018. How Location-Based Augmented Reality is Creating App Experiences. Koombea: Resources Hub. 19 Nov 2018. [15] [118]
- The Trivialization of Augmented Reality [16], by Joe Francica, April 14, 2010, Directions Magazine
5G
- Van Rees, Eric. 2019. How 5G is used for creating and consuming live traffic maps. SPAR3D. 8 May 2019. [119]
- Federal Communications Commission. 2018. The FCC’s 5G FAST Plan [120]. FCC Initiatives.
Customer Tracking, Bluetooth Beacon, Wi-Fi Analytics, Indoor Mapping
- Murray, Peter. 2017. Three Ways Retailers Increase Revenue with Location Intelligence [121]. CARTO Blog. 13 Feb 2017.
- Per Stenius and Seoweon Yoo. 2016. Indoor Tracking and Maps: The hype died, but the show is not over [122]. Reddal. 6 Mar 2016. Blog.
- Pemberton, Chris. 2018. Pinpoint the Right Location-Based Marketing Approach [123]. Gartner. Blog. 2 Aug 2018. Blog.
Internet of Things (IoT), Connected Sensors
- Michael E. Porter and James E. Happleman. 2015. How smart, connected Products are Transforming Companies [124]. Harvard Business Review. Oct 2015.
- Matt Alderton. 2017. Smart Stuff. The Internet of Things offers convenience, efficiency, and intelligence value, but also brings new risks to networks and data security [125]. Trajectory Magazine, USGIF. 9 Feb 2017.
9.3: Term Project – Providing Peer Feedback and Continue Working on Your Final Project Report
Deliverable:
Using the same 2 classmates, provide useful feedback on your colleagues’ Project Update Presentation. Post your comments in Canvas to the Term Project: Project Update Presentation with Audio forum in the Lesson 8 module. Please use the following as a guide when providing feedback.
- Consider making comments that will help your classmates improve upon what is already likely good research thus far.
- Did your classmate forget a key data attribute?
- Is there another geography/boundary that should be considered?
- What additional perspective can you offer?
Due Tuesday 11:59 pm (Eastern Time).
Check the Calendar in Canvas for specific time frames and due dates.
There is no specific deliverable for your term project required this week, but you really should be aiming to make some progress on your project this week!
Spend approximately 50% of time this week on your term project, (and the other 50% on your emerging trend/technology activity).
- At this point in the project, you should have completed a first pass at data gathering and report/map generation.
- You will receive feedback from both the instructor and your peers on the progress of your term project (if you haven't already done so). Make sure you return to your presentation from Week 8 to view this critique (and perhaps incorporate suggestions.) You are likely making a second pass at data/reports/maps as a result of the feedback from Week 8.
Thinking ahead about the written report—Lesson 10 . . .
Guidelines for completing your term project paper:
You have quite a bit of flexibility in terms of the final product—your format and tone should match your individual case. The report can read like a white paper, an academic paper, or a consultant's report. However, as you're all likely concerned with some basic guidelines, please consider the following broad requirements (which can be amended with reason):
- Make sure you include these key elements:
- Cover page with title, course, your name, date.
- Executive summary or abstract (this should be succinct—one or two paragraphs).
- Background on the case/question (enough detail so it makes sense to the reader).
- Data/methods/steps.
- Your findings/conclusion/proposed solution (short and to the point).
- Perhaps a look forward to next steps or items you couldn't complete.
- 5-7 pages of text, non-inclusive of maps/charts/reports—In rare circumstances, your paper might be shorter. Please, as always, make sure you convey your information as clearly and concisely as possible, which is part of your grade. Also make sure you Write AND Proofread.
- Paper Title - make sure your title is descriptive of your research including reference to the general data being used, geographic location, and time interval.
- Delivered as Word document (.doc or .docx) or PDF.
- Maps must be legible, titled, and have a key.
- Reports may be included as appendices and referenced as such in your text, or you may export/capture portions of reports for inclusion. (Appendices do not count towards your suggested page count.)
- Make sure you consider how an image will fit into your document when you screen capture or export an image.
- Use simple APA citation guidelines (unless you are more comfortable with MLS or something else). While I will not grade citation formats, I do expect any outside sources (and data!) to be cited, at the very least in a short bibliography.
Above all else...
Remember, your term project is your chance to convey an understanding of the material AND your ability to concisely and effectively present your case and findings—assuming you successfully achieve these two broad goals, your term project report will be successful!
Upcoming Deliverable (During Lesson 10):
A Word .doc/.docx or PDF .pdf submitted in Canvas to the Term Project: Final Project Report drop box.
Due Wednesday (last day of classes) 11:59 pm (Eastern Time).
Check the Calendar in Canvas for specific time frames and due dates.
Lesson 10: Term Project
10.0 Introduction to Lesson 10
Remember, your term project is your chance to convey an understanding of the material AND your ability to concisely and effectively present your case and findings--assuming you successfully achieve these two broad goals, your term project report will be successful!
Learning Objectives
- Assess a current news topic relating to location intelligence, paraphrase the author’s content, and offer a personal perspective.
- Evaluate a peer’s emerging trend posting and offer constructive commentary.
- Assemble your final Term Project report with graphics, advanced writing skills, and creativity to demonstrate your knowledge of location intelligence.
- Evaluate the course to influence improvements for instruction, content, and future classes.
Lesson 10 is set aside primarily for you to:
- view and comment on your peers' Emerging Trends/Technologies presentations;
- complete your term project paper.
What is due for Lesson 10?
Lesson 10 will take us one week to complete. There are a number of required activities in this lesson listed below. For assignment details, refer to the lesson page noted.
Note: Please refer to the Calendar in Canvas for specific time frames and due dates.
| 10.1 Emerging Trends Peer Comments (Refer to 9.2 Presentations) | ||
|---|---|---|
| Requirements | Details | Access / Directions |
| Read | Read the course content. | Use the Lessons menu or the links below to continue moving through the lesson material. |
| Deliverable | Peer response to 2 peers on emerging trends and technologies research, due Tuesday. | Provide your feedback in Canvas on the Lesson 9.2 - Emerging Trends Executive Summary forum.
|
| 10.2 Current Location Intelligence News | ||
|---|---|---|
| Requirements | Details | Access / Directions |
| Read | Read the course content. | Use the Lessons menu or the links below to continue moving through the lesson material. |
| Deliverable | Post on a current news topic relating to a Location Intelligence project, due Tuesday. | Post your comment in Canvas on the Lesson 10.2 - Current Location Intelligence Project in the News forum. |
| 10.3 Term Project Submitting Final Project Report | ||
|---|---|---|
| Requirements | Details | Access / Directions |
| Read | Read the course content. | Use the Lessons menu or the links below to continue moving through the lesson material. |
| Deliverable | Submit your Final Project Report. Due Wednesday, last day of class, 11:59 pm (Eastern Time). (No extensions!) | Submit your term paper in Canvas to the Term Project: Final Project Report drop box. |
| 10.4 Please Complete the SEEQ. | ||
|---|---|---|
| Requirements | Details | Access / Directions |
| Read | Read the course content. | Use the Lessons menu or the links below to continue moving through the lesson material. |
| Deliverable | The SEEQ (Student Educational Experience Questionnaire) survey is Due Wednesday, last day of class, 11:59 pm (Eastern Time). | A link to the SEEQ is provided in Canvas. |
10.1: Emerging Trends Peer Comments
Respond to your peers' presentations in the Lesson 9.2 - Emerging Trends Executive Summary forum. I will evaluate your peer reviews and post your grades to the Lesson 10.1 - Feedback to Peers on Emerging Trends
Make sure your comments:
- respond to AT LEAST Two of your peers' topics;
- are substantive, BUT CONCISE/CLEAR;
- respond to what your colleagues deliver; and
- feel free to add very brief important insights, but limit yourself to what's essential--no need to repeat comments others have made; rather, try to add to the conversation.
A good practice for offering feedback or comments is to pick one specific item you wish to address, make a quick note on paper about what you want to say, and then post your comment--keep it brief, and we'll all have time to read each other's remarks.
Deliverable:
A substantive response to TWO of your peers' presentations. Reminder, the presentations are in Canvas Lesson 9.2 - Emerging Trends Executive Summary.
Due Tuesday (before end of classes) 11:59 pm (Eastern Time)
Check the Calendar in Canvas for specific time frames and due dates.
Note:
You will not submit anything to the Lesson 10.1 - Feedback to Peers on Emerging Trends assignment, I will review the peer reviews you provide in the Lesson 9.2 - Emerging Trends Executive Summary and post these grades to the Lesson 10.1 - Feedback to Peers on Emerging Trends assignment page in Canvas.
10.2 Current News Topic – Location Intelligence
Since you should be focusing much of your attention on finishing your term project, I’ve made this week’s assignment fairly easy.
Topic Assignment
I’d like each of you to search in current digital or printed news for a location intelligence project you think represents what you have learned during the course. Post what you find along with source information (a link is fine) in Canvas in the Lesson 10.2 - Current Location Intelligence Project in the News forum.
Deliverable
For your example, provide a concise explanation of the content (2-3 sentences, tops). Please post a graphic from what you find, if one is available (and appropriate).
Due Tuesday 11:59 pm (Eastern Time).
10.3: Term Project – Submitting Your Final Project Report
Guidelines for completing your term project paper (repeated from Lesson 9):
You have quite a bit of flexibility in terms of the final product--your format and tone should match your individual case. The report can read like a white paper, an academic paper, or a consultant's report. However, as you're all likely concerned with some basic guidelines, please consider the following broad requirements (which can be amended with reason):
- Make sure you include these key elements:
- Cover page with title, course, your name, date.
- Executive summary or abstract (this should be succinct--one or two paragraphs).
- Background on the case/question (enough detail so it makes sense to the reader).
- Data/methods/steps.
- Your findings/conclusion/proposed solution (short and to the point).
- Perhaps a look forward to next steps or items you couldn't complete.
- 5-7 pages of text, non-inclusive of maps/charts/reports--In rare circumstances, your paper might be shorter. Please, as always, make sure you convey your information as clearly and concisely as possible, which is part of your grade. Also make sure you Write AND Proofread.
- Paper Title - make sure your title is descriptive of your research including reference to the general data being used, geographic location, and time interval.
- Delivered as Word document (.doc or .docx) or PDF.
- Maps must be legible, titled, and have a key.
- Reports may be included as appendices and referenced as such in your text, or you may export/capture portions of reports for inclusion. (Appendices do not count towards your suggested page count.)
- Make sure you consider how an image will fit into your document when you screen capture or export an image.
- Use simple APA citation guidelines (unless you are more comfortable with MLS or something else). While I will not grade citation formats, I do expect any outside sources (and data!) to be cited, at the very least in a short bibliography.
Above all else...
Deliverable:
A Word document (.doc/.docx) or PDF (.pdf) submitted in Canvas to the Term Project: Final Project Report drop box which is in the Lesson 10: Term Project module.
Due Wednesday night 11:59 pm (Eastern Time) (last day of classes).
10.4 SRTE
Please take some time to complete the SEEQ, Penn State's Student Educational Experience Questionnaire survey.
Feedback from students about their courses plays an important role in ensuring high-quality teaching and learning at Penn State. I hope that you will be able to find about 15 minutes to complete the SEEQ, our class evaluation survey. We rely upon your anonymous feedback to guide our continuing efforts to make this class worth the time and money you invest. Whether your feelings about the class are positive, negative, or mixed, please take a few minutes to let us know.
Note: The survey will close at 11:59 pm on the last day of class.