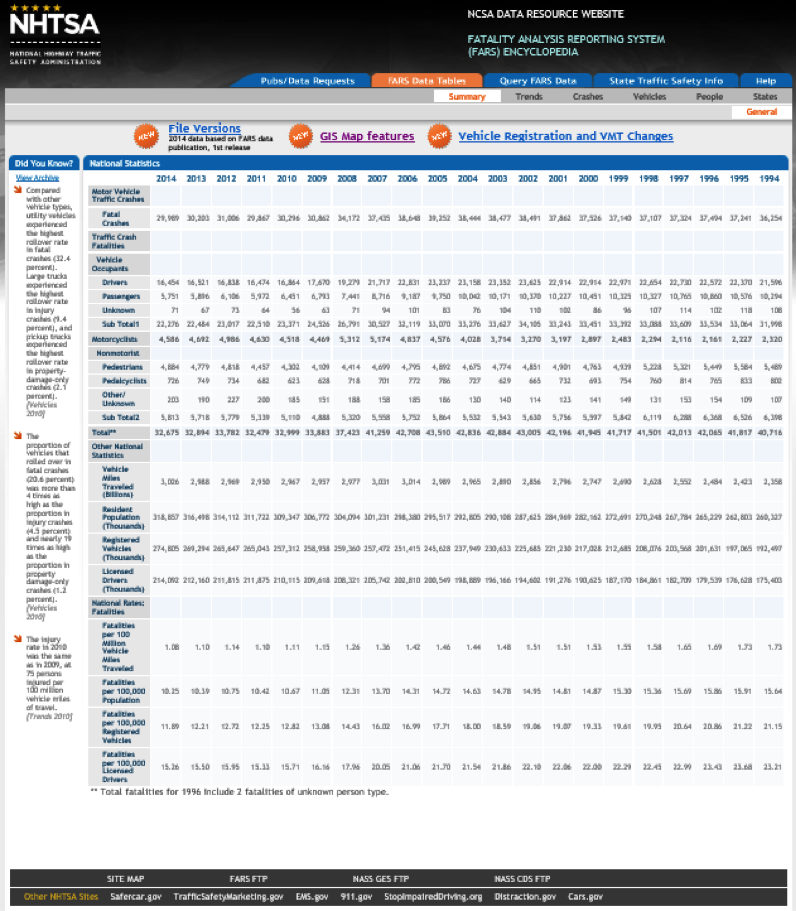
FARS is a system used to collect, store and analyze fatalities on U.S. roadways. The system is administered by the National Center for Statistics and Analysis (NCSA) which is part of the National Highway Traffic Safety Administration (NHTSA). The system includes data from all 50 states, the District of Columbia, and Puerto Rico. The primary purpose of the system is to monitor the effectiveness of vehicle safety standards and highway safety programs which are implemented at the state level. Only crashes which result in at least one fatality and occur on a roadway which is open to the public are included in FARS.
Pennsylvania Crash Information Tool (PCIT)
Some states make crash data available to the public and other interested parties via a web portal. As an example, Pennsylvania makes crash information available via the Pennsylvania Crash Information Tool (PCIT).
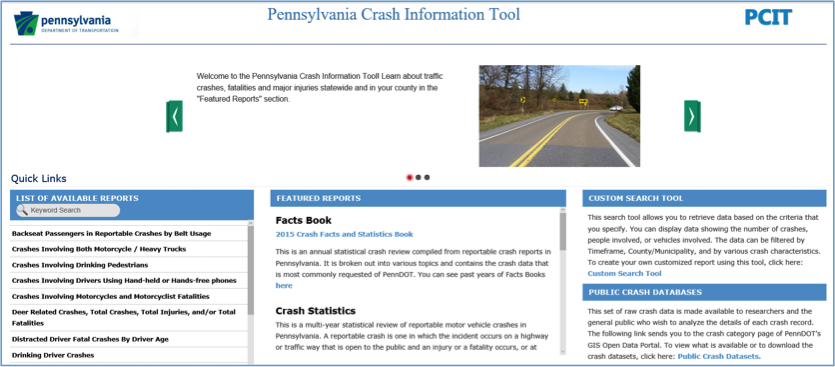
Many of the reports on this site are similar to those in FARS. PennDOT is in the process of adding mapping capabilities to the next version of PCIT scheduled for release in the spring of 2017. Similar to FARS, PennDOT also makes raw crash data available. The PCIT site simply guides users to the PennDOT’s GIS Data Portal for this data.
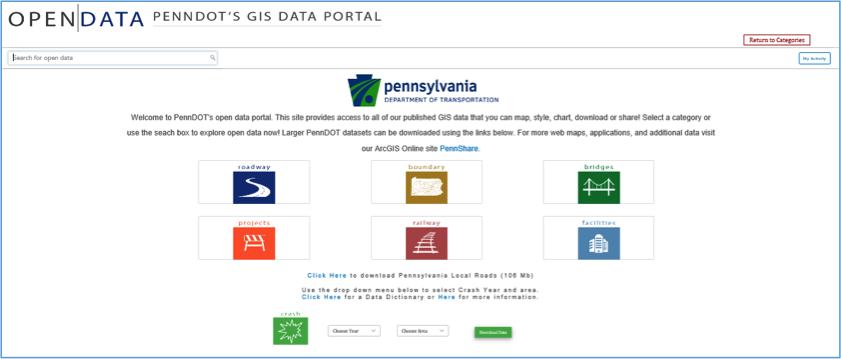
Pennsylvania crash data is available from 1997 to 2016. Differences between the FARS crash data and PennDOT’s crash data include:
- crash data from PennDOT include all reportable crashes and not just fatal crashes;
- crash data from PennDOT include many more attributes or “flags” which can be used to filter the crashes;
- PennDOT’s GIS Data Portal provides very limited querying options (year and county only) and, consequently, the burden is on the user to filter the data to meet their needs.
GIS Uses and Benefits in Highway Safety
As we learned in Lesson 6, spatial technologies are used to locate crashes and perform crash analysis to locate crash hotspots, otherwise known as crash clusters. Spatial technologies also play a critical role in expanding network screening to include roadway characteristics and traffic data in addition to historic crash data as called for in the HSM. Spatial analyses not only help in identifying priority sections of the roadway for safety improvements, but they can also be used to determine the countermeasures which are most likely to be effective and to assess their impact once they have been in place for a period of time. Finally, and perhaps most importantly, GIS plays a huge role in vehicle to vehicle communications and autonomous car technologies. These initiatives promise to have revolutionary impacts on highway safety and make the goal of 0 fatalities seem not so far-fetched.
Optional Reading
In August 2013, FHWA published a document titled Assessment of the Geographic Information Systems’ (GIS) Needs and Obstacles in Traffic Safety. In the document, FHWA identified some of the challenges states face in collecting and integrating crash data in addition to some of the opportunities GIS offers to address these issues.