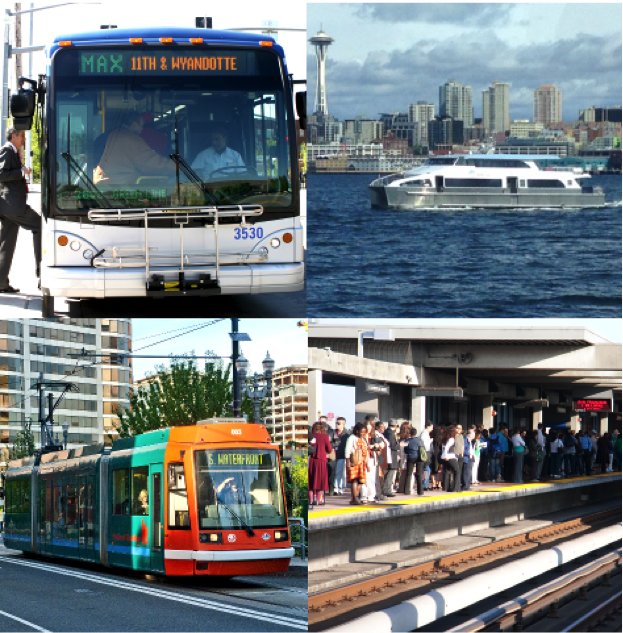
Fixed route transit services can be defined as services which operate on predefined routes according to a set schedule. The services can be divided into a number of more specific modes including:
- Local Bus
- Commuter Bus
- Express Bus
- Bus Rapid Transit
- Light Rail
- Subway
- Ferry Boat
Routes and Patterns
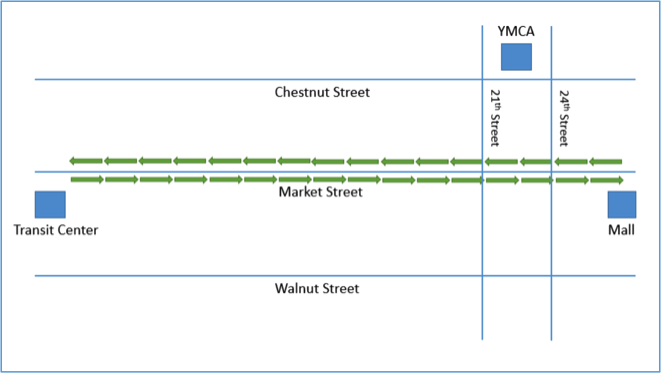
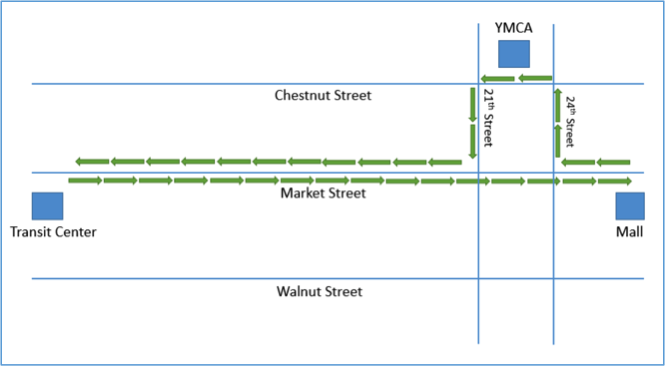
Fixed route buses operate on designated routes according to a published schedule. One can think of routes as generalized paths buses follow. For example, Route 1 may be structured to provide service along Market Street. It may begin at a transit center where riders can transfer from one route to another or even to a different mode such as light rail or subway and travel along Market Street until it reaches some terminal point at which time it returns along Market Street to the transit center. The specific path each route traverses can depend on the time of the day, the day of the week, and even the time of year (e.g., summer service). Each distinct path associated with a route is called a pattern. As an example, Figure 9.2 and Figure 9.3 show two patterns for the same route. The route generally follows Pattern 1, but at times during the day when the YMCA is busiest, it follows a somewhat different pattern.
Trips, Headway, Interlining, and Vehicle Blocks
When one uses the term trip in regards to DRT, it generally refers to the transport of a rider from their point of origin to their desired destination. In fixed route, the term trip has a different meaning. Over the course of a day, service along a route will generally be offered a number of times. For example, service along Market Street, in the above example, may occur at a frequency of twice an hour from 9 am to 4:30 pm, with a bus leaving the transit center every 30 minutes. In the world of fixed route, a trip corresponds to a bus completely traversing the route one time. The period of time between each trip is called the headway. In this example then, there are 16 trips and the headway is 30 minutes. If it takes more than 30 minutes to complete a single trip, then it will take multiple buses to provide service along Market Street. Sometimes a bus will operate a single route the entire day, and sometimes a bus will service multiple routes. When a bus completes a trip on one route and then begins a trip on a second route, it is referred to as interlining. A bus's schedule for an entire day is called a block. For example, Bus 2a may operate on Route 1 from 9 am to 12:30 pm, at which time it is used on Route 2 from 1 pm to 5 pm. The block for Bus 2a would be the sequential set of trips it completes over the course of the day on Routes 1 and 2.
Stops, Time Points, and On-Time Performance
A stop is a designated location along a route where riders can get on or get off the bus. The bus is obligated to stop at certain stops known as time points. These are stops that appear on the bus schedule. Generally, a transit agency will have a policy that a bus should not depart a time point before the scheduled time. How well a transit provider adheres to its published schedule is referred to as its on-time performance. It is important for transit providers to adhere to their schedules since riders depend on transit to get to their destinations on time. There are also stops along a route which are not time points. The bus will only stop at these stops if a rider is waiting at the stop or if a rider wishes to alight the vehicle at the stop. In addition to defined stops, some providers accommodate flag stops. A flag stop is an arbitrary location along the route where a rider wishes to board or alight the bus. The rider needs to flag the bus down in order to board or alert the driver they wish to alight the bus at that location.
Runs and Run Cutting
Sometimes, a single driver will operate on the same bus and route all day long. At others times, the driver may operate on a number of buses and/or routes over the course of the day. The collection of trips a driver performs over the course of their shift is known as a run. Just as a block represents a bus's schedule for the day, a run represents the driver's schedule for the day. Matching drivers with the pieces of work a transit provider needs to staff is known as run cutting. Run cutting can be a complex process at least in part because drivers and other staff often belong to a union, and the labor agreements which have been negotiated can have many different rules which need to be followed.
Fixed Route Technologies
Fixed route providers use a large number of technologies to manage operations and provide good customer service. The most significant of these technologies are described briefly below:
Fare Collection
There are a variety of fare collection technologies which fixed route providers use to collect and securely store fares. Some fare boxes are able to assist the driver in verifying that cash-paying riders provided the correct fare. Registering fare boxes are able to count coins and bills, but they cannot differentiate between different denominations of bills. For example, a registering farebox can’t tell the difference between a one dollar bill and a twenty dollar bill. Validating fare boxes can do everything a registering fare box can do and, in addition, can differentiate between different denominations of bills. Registering and validating fareboxes also generally allow the drivers to keep track of the types of passengers who are boarding (e.g., seniors, persons with disabilities, children, etc.). For providers who have relatively low ridership, it is difficult to justify the cost of registering or validating fare boxes. For these types of providers, a vault style fare box is often the most logical choice. A vault style fare box does not count cash payments. Instead, the upper compartment is generally transparent which allows the driver to confirm the correct fare was provided before it is dropped into the lower compartment. Many providers are moving toward providing more flexible payment options. Touch cards are a convenient type of fare media which are growing in popularity. Riders can generally add additional value to these cards using a ticketing machine or via the web.
Computer Aided Dispatch / Automatic Vehicle Location (CAD/AVL)
Many transit organizations who operate a fixed route bus service use CAD/AVL. CAD/AVL systems consist of onboard hardware to track the buses, and software which helps the dispatchers to manage service as it is occurring and resolve issues as they arise. CAD/AVL allows the dispatcher to see where all the agency's vehicles are on a map and to quickly determine which are on schedule and which are ahead of schedule or behind schedule.
Automatic Passenger Counters (APC)
APCs are simple devices which are mounted by each door and count the number of passengers boarding and alighting the bus. While there are different types of APCs on the market, the most common employ a series of infrared beams. Each time the beams are broken, the system counts it as either a boarding or alighting. During busy times, the devices can miss a passenger here and there. The devices can also have a hard time with children, especially if they are carried onto the bus. The data collected via APCs can be used to determine the current onboard passenger count, a piece of information that is sometimes made available to the riding public along with other real-time bus information. Transit agencies sometimes also use APC data to fulfill part of their reporting NTD requirements to the FTA but, in order to do so, they need to demonstrate that their APCs meet certain accuracy requirements. You'll learn about NTD reporting later in this lesson.
Automated Announcement Systems (AAS)
In order to comply with ADA requirements, fixed route vehicles are generally equipped with an AAS which provides both audible announcements and visual announcements about upcoming stops and points of interest. These systems are generally triggered based on the vehicle's position as it approaches a designated location. Most systems utilize geofences to determine when an onboard announcement should be made.
Vehicle Surveillance
Most fixed route vehicles are equipped with camera systems which record activities on the bus as well as outside the bus. It is common for a bus to have 6 separate audio and video streams with some of the larger articulated buses being equipped with 8 separate streams. The video from these buses is stored in onboard DVRs and can be streamed by dispatch if needed. The DVR capacities are generally sufficient to store a few weeks of video before overwriting. The systems are configured to automatically flag sections of video in the event the system senses any unusual forces due to a collision or abrupt deceleration or turn. The driver can also press a button to manually flag a section of the video. When the system flags a section of the video, it preserves a window of time which brackets the triggering event for later review. Flagged sections of video are often wirelessly downloaded when the bus returns to the depot. Vehicle surveillance systems are extremely useful for identifying undesirable driver behaviors and incidents onboard the bus, as well as helping to determine the cause of any bus-related accidents. Local police are also sometimes interested in this video if they believe it may be of use in solving or prosecuting a case.
Real Time Passenger Information
Real time passenger information systems have become extremely popular in recent years. These systems make real-time bus information available to riders via web applications, smartphone applications, and dynamic message boards which are sometimes located as transit centers or other high traffic stops. In Lessons 8 and 9, we looked at an example of one which CATA uses called MyStop.
Rider Alerts
Transit providers often offer rider alert systems to notify users about disruptions in services or to provide other types of notifications. Riders can typically sign up for alerts related to specific routes and/or system-wide alerts.
Scheduling Software
Developing and adjusting routes, patterns, stops, trips, and blocks can be challenging especially for larger transit providers. Scheduling software is designed to assist agencies in this regard. Scheduling software also often incorporates some functions to assist with run cutting as well.
Vehicle Health Monitoring
Many buses come equipped with vehicle diagnostics that can transmit various vehicle health information back to the transit agency. This technology helps to ensure problems are taken care of before they lead to vehicle breakdown. Some vehicle health systems integrate with maintenance management systems and can automatically schedule vehicles for preventative maintenance.
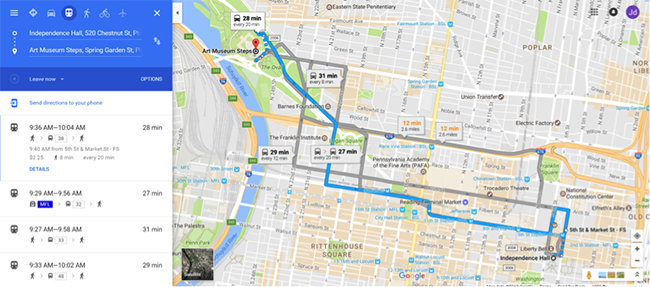
Trip Planning/Google Transit
Many fixed route providers offer trip planning services to their riders. These services are generally web-based and allow the rider to indicate their origin, destination, and desired date and time of departure or date and time of arrival. The trip planning service then presents options which define a combination of walking and fixed route options that best meet their needs. The options may involve one or more transfers between fixed route vehicles. The most popular fixed route trip planning service is Google Transit. The idea for what has become Google Transit was first spawned by TriMet, a transit agency which services Portland, Oregon. TriMet approached MapQuest, Yahoo, and Google to see if they would be interested in incorporating transit data into their map products, but only Google replied. The Google Transit Trip Planner launched on December 7, 2005. Google transit incorporates stops, routes, schedule, and fare information for a provider’s bus, subway, rail, and/or light rail service. The service is automatically available as a free service via Google Maps in any area where one or more local transit providers publish their data to Google.
For most of the first year, TriMet was the only operator available on Google Maps. In September 2006, five more cities got on board: Eugene, OR; Honolulu, HI; Pittsburgh, PA; Seattle, WA; and Tampa, FL. Today, Google Transit spans many hundreds of cities.
In order for transit providers to submit their fixed route information to Google in a consistent way, a data specification was required. The specification which was developed for this purpose is discussed in the next section. As mentioned above, Google Transit is a free service to transit agencies and to the public who can perform trip planning in Google Maps. However, if you wish to tie into the capabilities programmatically to incorporate the power of Google Transit (or more generally Google Maps) into your own software application, there are often associated fees you need to consider. A popular and robust alternative open source trip planning system is Open Trip Planner.
General Transit Feed Specification (GTFS)
The specification which was developed to allow transit agencies to publish their fixed route data to Google Transit is known as GTFS. Originally it stood for the Google Transit Feed Specification, but in 2010, Google changed the name to the General Transit Feed Specification given its growing status as the default specification for transit data. GTFS is an open data standard which represents fixed-route schedule, route, and bus stop data in a series of 13 comma-delimited text files compressed into a ZIP file. Each of the 13 text files contains a series of fields or attributes about a component of the fixed route service. Some of the files and fields are optional (see Table 1).
| Required | Optional |
|---|---|
| Agency.txt | Calendar_dates.txt |
| Stops.txt | Fare_attributes.txt |
| Routes.txt | Fare_rules.txt |
| Trips.txt | Shapes.txt |
| Stop_times.txt | Frequencies.txt |
| Calendar.txt | Transfers.txt |
| Feed_info.txt |
Click for description of each table along with the meaning of each field.
The primary use of GTFS data is to publish fixed route schedule data to Google Transit so that riders can perform trip planning. However, there are many other potential uses for GTFS data. For example, transit planning software systems such as TBEST commonly allow users to upload route, stop, and schedule data in GTFS format. In the past few years, Google has created a new specification based on GTFS which incorporates real-time information in addition to the static schedule data. The new specification is known as GTFS Real Time and is starting to gain some traction among transit agencies, but is not yet widely used.
In Assignment 9-2 you’ll have a chance to work with GTFS data from a transit agency in Tampa, Florida. Specifically, you’ll use the route geometry contained in the shapes.txt component of the GTFS data to establish the zone for ADA complementary paratransit.
The following assignment is optional. You do not need to complete this assignment to fulfill the requirements of the course. TBEST is a powerful tool for transit planning and is available for free. If you have an interest in the tool, this assignment will help you to get some hands-on experience using it.
Optional Assignment
In this assignment, you’ll get a chance to get some hands-on experience with TBEST as you explore some of its many features. Prior to doing this assignment, you will need to download and install TBEST Version 4.4 for ArcGIS 10.5. As part of Assignment 8.6, you reviewed some tutorial videos which are available to help users learn how to use the features TBEST offers. In preparation for this assignment, watch the tutorial videos on scenarios, network tools, TBEST reporting, and the attribute search tool. TBEST also has a comprehensive users' guide available from both the website and the help menu within TBEST. Complete the following activities.
- Open TBEST.
- Download Socio-Economic data, GTFS Data, and a transit system logo.
- Under the File menu, select “Downloads”, select “Download Socio-Economic Support Data...”, and finally select “Florida 2014 Population 2014 Employment 2015 Parcel”, and click “Download”.
- Download the latest GTFS file for HART.
- Download the transit system logo for HART.
- Create a new transit system.
- For this assignment, you’ll model Hillsborough Area Regional Transit (HART) which services Tampa in Hillsborough County.
- In the TBEST explorer window, right click “Transit Systems” and select “New System”.
- You will be prompted to select the source socioeconomic data. The only option you have is the data you downloaded in step 2. Select it and click “Ok”.
- On the “New Transit System” dialog, enter HART as the transit system name.
- Select Hillsborough County as the extent.
- Leave the remaining settings alone and click “Ok”.
- It will likely take 60-90 minutes to compile the socioeconomic data and parcel data for Hillsborough County, Florida.
- Create a new TBEST Scenario.
- In the TBEST explorer window, expand the HART transit system you created in step 5.
- Right click “Scenarios,” and select “Create a New Scenario…”
- Name the new scenario “2017 Base Conditions”.
- Select “TBEST Land Use Model 2016” as the scenario model (it is the only option).
- Enter “2017” as the Forecast Year.
- Select an average annual wage for Hillsborough County and enter it as the mean annual wage for the scenario.
- Enter “2” as the annual growth rate.
- Click “Ok” to create the new scenario.
- Create HART’s Fixed Route Network.
- You’ll create HART’s fixed route network by importing their latest GTFS data file. As an alternative, you could manually create the network in TBEST, but that would be time-consuming.
- In the TBEST explorer window, right click on the “2017 Base Conditions” scenario and select “Import Routes from GTFS”.
- On the TBEST GTFS Network Import dialog, select the GTFS.zip file downloaded in step 2b as the source GTFS zip file.
- Select the top three checkboxes (i.e., Weekday, Saturday, and Sunday) to select all service periods.
- Click “Load Routes” to load all routes.
- Check “Select All” in the lower left corner of the dialog to select all routes.
- Click the “Import” button to begin importing the network.
- You will be prompted for confirmations 2 times. Click “Ok” to both.
- Once the network has been successfully imported (it should take about 10 minutes), you can exit the GTFS Network Import screen.
- Exploring HART’s Fixed Route Network.
- Right mouse click on the newly created “2017 Base Conditions” scenario and select “Open Scenario”.
- Grab a screenshot of the resulting map showing HART’s routes. (5 points)
- In the routes window, expand Route 1 – Florida Avenue.
- Expand the Northbound Patterns.
- Double click Pattern 40317.
- TBEST automatically highlights the pattern and associated stops on the map.
- In addition, the segments and stops are automatically populated in their respective windows.
- Grab a screenshot of the entire TBEST window with Pattern 40317 selected. (2 points)
- TBEST has powerful search capabilities which allow you to find and select a group of stops, segments, or routes based on attribute filters. The search tool is available on the main TBEST toolbar (binoculars) or via the Scenario menu.
- Open the search tool and search for stops associated with express routes.
- To do so, select “Stops” as the Category, “Route Type” as the attribute, “Equal To” as the Operator (i.e., “Is”), and “Express” as the Value.
- Click “Add to Search Criteria” to add the filter.
- Click “Apply” perform the search.
- Grab a screenshot of the map showing the express route stops selected. (3 points)
- Group selecting routes, segments, and stops in this manner is useful for mass adjusting attributes for alternative scenario modeling. For example, you could use the stop calculator to adjust the headway of all currently selected stops to 20% less than each stop’s current headway setting.
- Set Socio-Economic Growth Rates and Base Fares.
- Under the Scenario menu, select the “Set Socio-Economic Growth” submenu, and finally “Enter Growth Rates”, to bring up the “Socio-Economic Data Growth Rates” dialog.
- Enter 2% in total population. By default, this rate will be used for the other factors as well.
- Click “Set Growth Rates” to apply the rates and close the dialog.
- To establish the base fares, open the System Fare Levels Dialog ($ Icon on the main TBEST toolbar, or select “System Level Fares” from the “Scenario” menu).
- Base fares are set according to the route type. All of HART routes are of one of three types: Circular, Radial, and Express.
- In the dialog enter $6 for the express routes and $4 for the circulator and radial routes.
- Click “Ok” to apply the fares and close the dialog.
- Running the Model.
- You are now ready to run the model. To do so, right-click the “2017 Base Conditions” scenario in the TBEST explorer window and select “Execute Model Run”.
- On the “Scenario Model Run” dialog, you will use the default settings and click “Run”.
- You will be asked to confirm the run and whether you want to save changes to the scenario. Click “Yes” to both.
- It will take about 20 minutes to run the model.
- Examining Model Results.
- On the “Scenario” menu, select “Model Reports” and then “Scenario Summary Tool”.
- Select the HART transit system and the “2017 Base Conditions” scenario.
- Leave the default “Summary Span and Time Period” settings as is, and click “Show Report”.
- Explore the results presented here.
- Examine the performance measures “Boardings Per Service Hour” and “Boardings Per Stop Visit”.
- Which route has the highest “Boardings Per Service Hour”? (2 points)
- Generate a chart showing these 2 performance measures for the HART express routes and a handful of the non-express routes (Hint: You can use the TBEST search tool to identify express routes).
- Examine how the relationship between these 2 performance measures in general differs between express routes and other routes (e.g., “Boardings Per Service Hour” are high and “Boardings Per Stop Visit” are low).
- Grab a screenshot of the chart. Identify the routes which are express routes. Describe any difference in relationship you observe. How might you account for your observations? (3 points)
- Title VI Analysis
- To run a Title VI Analysis, you need to have all scenarios closed. You can close any open scenarios by clicking “Close Scenario” on the main TBEST toolbar.
- Right mouse click on Title VI Analysis in the TBEST explorer window and select “New Title VI Analysis”.
- Name the new analysis “Route 1 Title VI Analysis”.
- Select “HART” as the transit system.
- Select “2017 Base Conditions” as the scenario.
- Leave the buffer distance as 0.25 miles and click “Next”.
- Leave the service area setting as Hillsborough County and click “Next”.
- On the Poverty Levels screen, adjust the poverty incomes to reflect the 2017 values from the Department of Health and Human Services and, once done, click “Next”.
- On the “Route Selection” screen select Route 1 and click “Next”. (Note: we are running just 1 route for this exercise, so the analysis will complete faster.)
- Upload the transit system logo for HART and click “Next”.
- Click “Next” on the “Jurisdictional and Rex Route Input” screen.
- The Major Roads screen already has the correct shapefile selected. For states other than Florida, you would need to download the correct TIGER road data. Click “Next”.
- Click “Finish” on the “Title VI Setup Screen”.
- Click “Yes” on the confirmation screen.
- After a few minutes, the Title VI Analysis will finish, and the “Title VI Analysis Console” appears. On the left side of the console, there is a variety of maps, and on the right side, there are a series of reports. Maps open in ArcMap.
- Spend a few minutes exploring the variety of output. Grab a screenshot of 1 map and 1 report you find interesting and briefly describe each. (5 points)