4.7 Adding Overlays to a View
The maps we’ve created so far have been pretty boring, so let's spice it up a tiny bit by plotting a point. We’ll see later in the course how to display features stored in one of Esri’s vector data formats. What I’m talking about doing right now is how you’d display a small number of geometries (points, lines or polygons) whose coordinates you’ve hard coded into the app, or perhaps acquired through user input.
- Create a copy of your hello_map folder (and its files) called lesson 4.
- Set the HTML doc’s title to Plotting a point.
Adding geometries the way I’m describing here involves creating one or more objects of the Graphic class. - Look up the Graphic class in the SDK using the Search box. (The result you want is the class found in the esri/Graphic module.)
As the overview explains, important properties of the Graphic class are geometry, symbol, and attributes. Attributes are important in situations where you want the user to be able to click on the graphic and see information about it in a popup window. We’re going to keep this simple, so we’ll focus on just the geometry and symbol, starting with the geometry.
Looking at the geometry property's description, you should note that in order to set it, you need to use a Geometry object. - Click on the Geometry link to go to that class's documentation page.
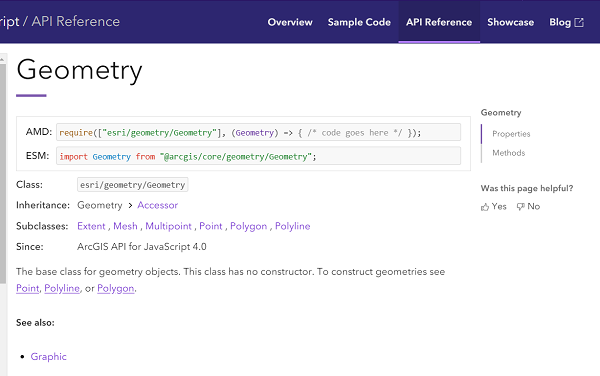 Figure 4.3 The Geometry class description in the API Reference
Its description tells you that it’s a "base class" and that it has no constructor. What this means is that you can’t create a plain Geometry object. You’d have to create a Point, Polyline or Polygon object instead. The Geometry class exists in the abstract as a way to define the properties and methods that the Point, Polyline and Polygon classes share in common (such as the extent property). (You might find it helpful to think of cars as an analogy. If you’re shopping for a new set of wheels, you don’t just buy a generic car; you buy some model of Ford, Toyota, Volkswagen, etc.)
In object-oriented programming terminology, the Geometry class can be described as the parent class or super-class of the Point, Polyline and Polygon classes (which are themselves child classes or sub-classes). These class relationships are conveyed at the very top of the class pages in the SDK. (Look for the Inheritance and Subclasses headings.) It turns out that you’ll find all of the properties and methods the Point, Polyline and Polygon classes inherit from Geometry on their pages. Not all SDKs are written this way (i.e., the SDK could have been organized such that you’d have to view the property and method lists on both the Point and Geometry pages to know all Point capabilities). - Getting back to our task, we know we want to add a point to the map, so follow the link to the Point class.
The Point class has several properties, but the ones we want here are latitude and longitude. - To the bottom of your JS code, add the following:
const pt = new Point({
  latitude: 40.792,
  longitude: -77.871
});
We’ve created a Point geometry for our Graphic, but have we forgotten something? Yes, if we want to work with the Point class, we need to include a reference to its module in our require() declaration. - Move to the top of your JS code and add "esri/geometry/Point" to the module list, then add Point to the callback function argument list (making sure you match its location in the list with the module’s location in the module list).
- With the Point geometry created, let’s move on to the symbol. In the SDK, make your way back to the Graphic class’s property list.
The symbol property must be set using a Symbol object. Following the Symbol link, you should note that, like the Geometry class, Symbol is an abstract parent class for several child classes. We’re trying to symbolize a Point here, so the subclass we need is MarkerSymbol. (We’d need LineSymbol for a Polyline and FillSymbol for a Polygon.) - Follow the MarkerSymbol link in the list of subclasses.
Reading over the MarkerSymbol class description, you should note that it is itself another abstract parent class, having subclasses PictureMarkerSymbol and SimpleMarkerSymbol. If you wanted to depict the point using some kind of graphic stored on disk, then you’d use the PictureMarkerSymbol class. We’ll keep our app simple by using the SimpleMarkerSymbol class, which will allow us to choose from a set of predefined shapes and apply a desired color and size.
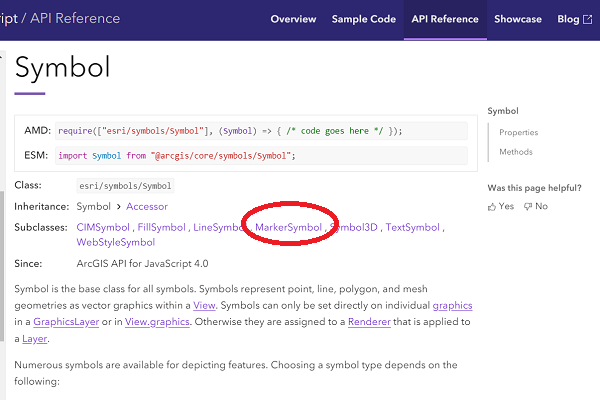 Figure 4.4 Accessing the MarkerSymbol class in the API Reference
 - Follow the SimpleMarkerSymbol link in the list of subclasses. Read over the class description and note the color, size and style properties.
- Create a new SimpleMarker as follows:
const sym = new SimpleMarkerSymbol({ color: "blue", style: "square", size: 12 }); - Update your require() declaration so that this newly added SimpleMarkerSymbol code will execute properly. Hint: the information you need is at the top of the class page in the SDK.
- With the geometry and symbol created, we’re ready to create a new Graphic object:
const ptGraphic = new Graphic({ geometry:pt, symbol:sym }); - We saw earlier in the lesson that the Map class has a method called add() for adding a layer. One way we could accomplish our goal here would be to add this Graphic to a new GraphicsLayer, then add the GraphicsLayer to our Map. However, a slightly easier alternative is to take advantage of the fact that the MapView has a graphics collection associated with it. We can simply add our Graphic to that collection as follows:
view.graphics.add(ptGraphic);
- Be sure to modify your require() declaration so that the browser will be able to find the Graphic class you just referenced.
- Test your app and confirm that a blue square is added to the map.
With that, you've reached the end of this lesson's content. Move on to the next page to access the assignment associated with this lesson.