Lesson 2: The Global Ledger of Heat Energy
Motivate...

Do you remember when you opened your first checking account? That was certainly a watershed moment of personal finance! My parents tried to impress upon me the importance of writing every transaction down in the check ledger and always knowing my account balance. Maintaining an account ledger allows you to track exactly what money is coming into your account and what money is going out. The difference between the in-coming and out-going funds determines whether your account grows or shrinks in value.
While more and more people are using technology to keep tabs on their account balances, it's still critical to be aware of how much money is entering and leaving your account (lest you overdraft your account and incur unfortunate banking fees). In the study of the atmosphere, the Earth's currency is energy (much of that in the form of heat energy), and we have to understand the flow of energy into, around, and out of the earth-atmosphere system. This is true at all scales, from why cloudy nights tend to be warmer than clear nights (all else being equal), to being able to properly think about the Greenhouse Effect and Global Warming. As with your checking account, you must keep track of all transactions within the system to know whether there is a net gain or net loss in energy. In this lesson, we are going to learn about the various means by which energy moves and learn such terms as conduction, convection, and radiation. We will also see several examples where tracking the movement of energy can explain situations commonly observed in the atmosphere.
So, dust off your green CPA's visor and your adding machine, and let's dive into the Earth's energy ledger.
Shedding Light on the Electromagnetic Spectrum
Prioritize...
At the completion of this section, you should be able to define radiation, wavelength, and micron. You should also be able to discuss the organization of radiation in the electromagnetic spectrum by wavelength (you should know which types of radiation have longer wavelengths and which have shorter wavelengths, for example).
Read...
First up in our study of Earth's energy ledger is radiation. While the mention of "radiation" may conjure up thoughts about nuclear reactors or nuclear bombs, it turns out that the scientific use of the term "radiation" is considerably more broad. Radiation is defined as the emission and transfer of energy through a medium via particles or waves. In fact, the vast majority of radiation that you encounter on a daily basis has nothing to do with nuclear radiation at all. From an everyday light-bulb, to the microwave that heats your frozen lunch, to the radio that you listen to on your morning commute, you're surrounded by devices that make use of radiation. Even light from the sun is a form of radiation, so radiation is occurring all around you!
At some point in a science class, you probably studied the electromagnetic spectrum of radiation, but how is this electromagnetic spectrum created? To begin with, you probably know that the building blocks of all matter are atoms and molecules. Within these atoms and molecules are smaller particles which have positive and negative charges -- protons and electrons, respectively. These charged particles tend to oscillate or vibrate (especially electrons). Without getting into the details, physics tells us that any charged particle like an electron has an electrical field surrounding it (electrical charges and electrical fields go hand-in-hand). Furthermore, moving charges also possess magnetic fields. Thus, when an electron oscillates, its surrounding electric and magnetic fields change. Like moving your hand rapidly back and forth in a pool of water, oscillating electrons send out ripples of energy (that is, "waves") that have both electrical and magnetic properties (hence, electro-magnetic radiation).

So, how is it that different kinds of electromagnetic waves exist to create an entire spectrum? First, let's talk about the different kinds of EM radiation in terms of wavelength. The wavelength of any wave is simply the distance between two consecutive similar points on the wave (for example, from wave crest to wave crest). Now think about our pond analogy above. If you move your hand slowly in the water, you will create a few waves with long wavelengths. However, if you move your hand rapidly in the water, you create lots of waves with very short wavelengths. The same is true for an oscillating electron. If the oscillation is very quick (we say the oscillation has a high frequency), then the EM radiation produced will have a short wavelength. If the oscillation is slower (having a lower frequency) then the electromagnetic waves will have long wavelengths.
Now, the frequency at which electrons oscillate is essentially set by the temperature of the matter in which the electron resides (remember, we defined an object's temperature as the average kinetic energy of its atoms or molecules). The higher the temperature, the higher the frequency of oscillation. So, when temperature increases, the wavelength of the electromagnetic radiation emitted by the electron decreases. Conversely, as temperature decreases, the frequency of oscillation slows, and the wavelength of the emitted electromagnetic radiation increases. For a visual, check out this short video demonstrating the relationship between oscillation frequency and wavelength [5] (0:57; video transcript [6]).
Before we move on, let me add one quick caveat: the brief description I gave above doesn't fully describe all emissions of radiation. For simplicity, we focused on the generation of EM radiation by a single oscillating charged molecule. In reality, matter exists as a system of charged particles. This means that the resulting electromagnetic radiation field is much more complex than I have outlined here. Furthermore, very high-frequency EM emissions require a different mechanism to generate the high energy waves in addition to moving particles, but that's beyond the scope of what we need for this course.
With that caveat out of the way, check out the entire spectrum of electromagnetic radiation below. First, note that the range in wavelengths for different types of electromagnetic radiation is staggering -- from hundreds of meters to the size of an atom's nucleus. Also note that visible light does indeed qualify as electromagnetic radiation, despite taking up only a tiny sliver of the entire spectrum. This means that our eyes are completely blind to almost all electromagnetic radiation.
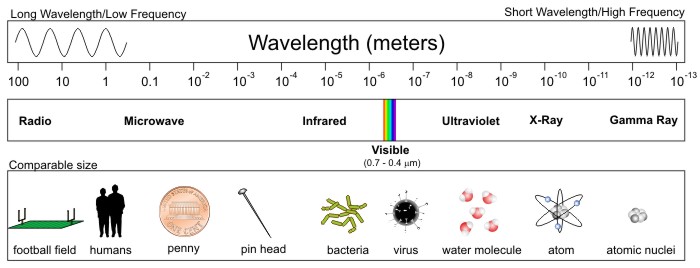
Starting from the end of the spectrum with the longest wavelengths (the "long-wave" portion of the spectrum), radio waves and microwaves have wavelengths of hundreds of meters to a few millimeters (a millimeter is 10-3 meters or one-thousandth of a meter). As wavelengths further decrease, they tend to be expressed in micrometers, more commonly called microns (10-6 meters, or one-millionth of a meter), and as wavelengths shrink to 10s of microns (the size of a bacterium or a virus) we label these emissions as infrared, visible, and ultraviolet light. Finally, in the very short-wave portion of the spectrum, with wavelengths the size of an individual molecule or atom, we have X-rays and gamma rays.
The types of radiation that we'll be working with most commonly in this course are microwave, infrared, and visible because of their applications in helping meteorologists observe the atmosphere. Furthermore, as we'll investigate more in this lesson, beyond the longest wavelengths associated with visible light lies the infrared ("beyond red") band of the electromagnetic spectrum. A majority of the infrared spectrum, spanning from approximately 3 to 100 microns, essentially constitutes "terrestrial radiation" (radiation "of the earth") because the oscillating charges that emit at these wavelengths are consistent with temperatures commonly observed on this planet as well as in Earth's atmosphere.
Now that you know the terminology behind the different regions of the electromagnetic spectrum, we need to discuss the properties by which objects emit radiation. These properties have been grouped into what I call the "four laws of radiation." Read on.
The Four Laws of Radiation
Prioritize...
After completing this section, you should be able to describe the relationships governed by the "Four Laws of Radiation." You should also be able to solve observational "problems" using the relationship between an object's temperature, total emission, and peak emission wavelength as described by the Stefan-Boltzmann Law and Wien's Law.
Read...
In order to best make use of the of information that comes to us via the electromagnetic spectrum, we need to understand some basic properties of radiation. A complete treatment on the subject of radiation theory would take an entire course at least (indeed, folks pursuing a degree in meteorology are usually required to take a Radiative Transfer course). Instead, you just need to know the fundamental principles describing the electromagnetic radiation that originates from an object, and how that radiation travels through space (which we'll get into soon).
For electromagnetic radiation, there are four "laws" that describe the type and amount of energy being emitted by an object. In science, a law is used to describe a body of observations. At the time the law is established, no exceptions have been found that contradict it. The difference between a law and a theory is that a law simply describes something, while a theory tries to explain "why" something occurs. As you read through the laws below, think about observations you've made in everyday life that might support the existence of each law.
Planck's Law
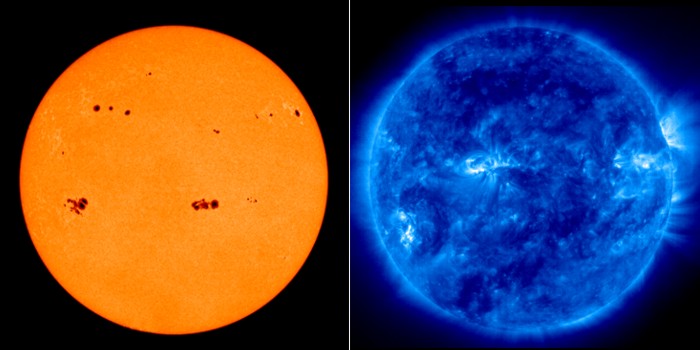
Planck's Law can be generalized this way: Every object emits radiation at all times and at all wavelengths. Does that surprise you? We know that the sun emits visible light (below left), infrared waves [7], and ultraviolet waves (below right), but did you know that the sun also emits microwaves, radio waves, and X-rays [8]? Of course, the sun is a big nuclear furnace, so it makes sense that it emits all sorts of electromagnetic radiation. However, Planck's Law states that every object emits over the entire electromagnetic spectrum. That means that you emit radiation at all wavelengths, and so does everything around you!
Now before you dismiss this statement out-of-hand, let me say that you are not emitting X-rays in any measurable amount. The mathematics behind Planck's Law hinge on the fact that there is a wide distribution of vibration speeds for the molecules in a substance. This means that it is possible for matter to emit radiation at any wavelength, and in fact it does, but the amount X-rays you're currently emitting, for example, is unimaginably small.
Another common misconception that Planck's Law dispels is that matter selectively emits radiation. Consider what happens when you turn off a light bulb. Is it still emitting radiation? You might be tempted to say "No" because the light is off. However, Planck's Law tells us that while the light bulb may no longer be emitting radiation that we can see, it is still emitting at all wavelengths (most likely, it is emitting copious amounts of infrared radiation). Another example that you hear occasionally on TV weather casts goes something like this: "When the sun sets, the ground begins to emit infrared radiation..." That's just not how it works. The ground doesn't "start" emitting when the sun sets. Planck's Law tells us that the ground is always emitting infrared radiation, a fact that we'll explore later on in this lesson.
Wien's Law
So, Planck's Law tells us that all matter emits radiation at all wavelengths all the time, but there's a catch: Matter does not emit radiation at all wavelengths equally. This is where the next radiation law comes in. Wien's Law states that the wavelength of peak emission is inversely proportional to the temperature of the emitting object. Put another way, the hotter the object, the shorter the wavelength of maximum emission. You have probably observed this law in action all the time without even realizing it. Want to know what I mean? Check out this steel bar [9]. Which end might you pick up? Certainly not the right end! It looks hot, doesn't it? Why does it "look hot?"
Well, for starters, the peak emission for the steel bar (even the part that looks really hot) is in the infrared part of the spectrum. But, the right side of the bar is hotter than the left, and therefore the right side has a shorter wavelength of peak emission compared to the left side. You see this shift in the peak emission wavelength as a color change from red to orange to yellow as the metal's temperature increases. In fact, the right side is hot enough that its peak emission is pretty close to the visible part of the spectrum (which has shorter wavelengths than infrared); therefore, a significant amount of visible light is also being emitted from the steel.
Judging by the look of this photograph, the steel has a temperature of roughly 1500 kelvins, resulting in a max emission wavelength of 2 microns (visible light has wavelengths of 0.4-0.7 microns). Here is a chart showing how I estimated the steel temperature [10]. To the left of the visibly red metal, the bar is still likely several hundred degrees Celsius. However, in this section of the bar, the peak emission wavelength is far into the infrared portion of the spectrum, and no visible light emission is discernible with the human eye.
So, how do we apply Wien's Law to the emission sources that effect the atmosphere? Consider the chart below showing the emission curves (called Planck functions) for both the sun and the earth.
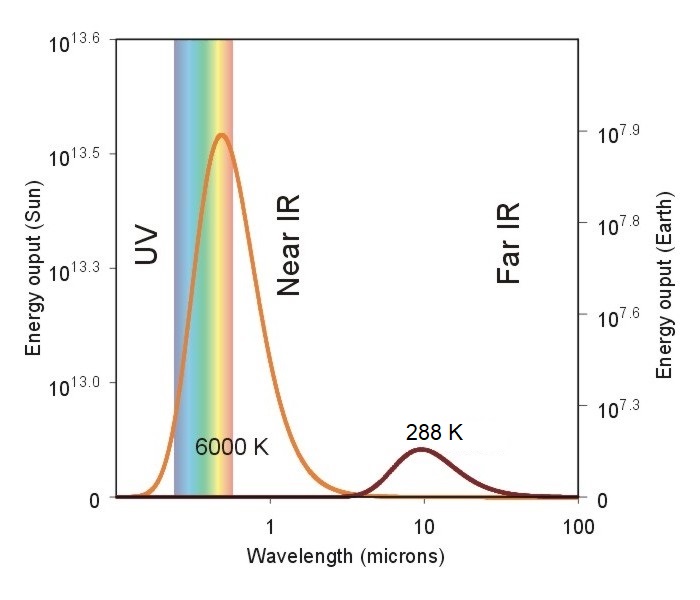
Note the idealized spectrum for the earth's emission of electromagnetic radiation (dark red line) compared to the sun's electromagnetic spectrum (orange line). The radiating temperature of the sun is 6000 degrees Celsius compared to the earth's measly 15 degrees Celsius. This means that given its high radiating temperature, the sun's peak emission occurs in the visible light portion of the spectrum, near 0.5 microns (toward the short-wave end of the EM spectrum). That wavelength is also the reason why we see the sun as having a yellow hue. Meanwhile, the earth's peak emission is located in the infrared portion of the electromagnetic spectrum (having longer wavelengths, by comparison).
Stefan–Boltzmann Law
Look again at the graph of the sun's emission curve versus the earth's emission curve (above), and take note of the energy values on the left axis (for the sun) and right axis (for the earth). The first thing to notice is that the energy values are given in powers of 10 (that is, 106 is equal to 1,000,000). This means that if we compare the peak emissions from the earth and sun we see that the sun at its peak wavelength emits nearly 3,000,000 times more energy than the earth at its peak. In fact, if we add up the total energy emitted by each body (by adding the energy contribution at each wavelength), the sun emits over 180,000 times more energy per unit area than the earth!
I calculated the number above using the third radiation law that you need to know, the Stefan-Boltzmann Law. The Stefan-Boltzmann Law states that the total amount of energy per unit area emitted by an object is proportional to the 4th power of the temperature. You won't need to do any specific calculations with the Stefan-Boltzmann Law, but you should understand that as temperature increases, so does the total amount of energy per unit area emitted by an object (hotter objects emit more total energy per unit area than colder objects). This relationship is particularly useful when we want to understand how much energy the earth's surface emits in the form of infrared radiation. It will also come in handy when we study the interpretation of satellite observations of the earth, later on.
Kirchhoff's Law
In the preceding radiation laws, we have been talking about the ideal amount of radiation that can be emitted by an object. This theoretical limit is called "black body radiation." However, the actual radiation emitted by an object can be much less than the ideal, especially at certain wavelengths. Kirchhoff's Law describes the linkage between an object's ability to emit at a particular wavelength with its ability to absorb ("take in") radiation at that same wavelength. In plain language, Kirchhoff's Law states that for an object with constant temperature, an object that absorbs radiation efficiently at a particular wavelength will also emit radiation efficiently at that wavelength. Kirchoff's Law has lots of consequences for how we observe weather from space using satellites (a topic we'll revisit later).
Now that we've covered the basic behavior of radiation and how it relates to temperature, we need to wrap-up our look at radiation by examining at the possible fates of "beam" of radiation as it passes through a medium.
The Roads Traveled Most By Radiation
Prioritize...
After completing this section, you should be able to describe transmission, absorption, and scattering as they pertain to electromagnetic radiation passing through a medium. You should also be able to define albedo and be able to discuss earth's average albedo and that of various surfaces.
Read...
Unlike the traveler in Robert Frost's poem, The Road Not Taken [11], electromagnetic radiation doesn't have much of a choice whenever it encounters objects in its direct path. Indeed, the fate of electromagnetic radiation depends on wavelength and the physical composition of the atoms and molecules in the medium that it is passing through. It is impractical (and impossible) to sort through each atom and molecule in a given object in order to judge its potential effect on the radiation that strikes it ("incident" radiation), so we will consider chunks of matter as whole objects in order to describe their overall effect on incident radiation.
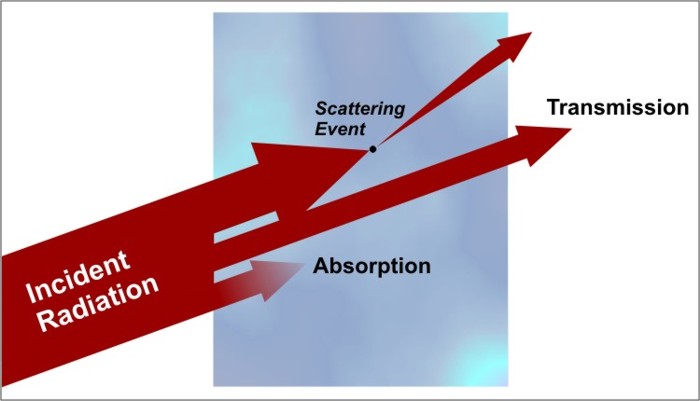
When radiation first encounters some medium (whether it be a collection of gases, a liquid, or a solid), only three things can occur to that radiation. The electromagnetic energy can either be absorbed by the medium, scattered by the medium, or it can pass through the medium unaffected (a process called transmission). In most cases, all three processes can and do occur to some degree. Examine the figure below showing the three processes that can affect radiation passing through a medium.
Let's briefly discuss each of these potential outcomes:
- Transmission is essentially the process by which radiation passes through an object unaffected. An example of a medium with a high transmission value is window glass. Visible light passing through a thin sheet of glass does so basically undisturbed, which is why we can see objects clearly on the other side. We tend to call such mediums "transparent," while mediums having low transmission values are called "opaque." The transmission properties of a medium are highly dependent on wavelength, however. For example, an object that is transparent in the visible wavelengths might be opaque in some infrared wavelengths. I should also point out that 100 percent transmission is rare, except within the vacuum of space. Almost always, at least a little energy is lost to absorption and/or scattering as radiation moves through the medium.
- Absorption is the extinguishing of a portion of the radiation "beam." When an object absorbs electromagnetic radiation, the radiation is taken up by the matter (typically the electrons of the atoms) and converted to other forms of energy (usually heat energy). As with transmission, the amount of energy that an object absorbs depends on the wavelength of the radiation and the physical make-up of the object. For example, freshly fallen snow absorbs little direct sunlight, but snow readily absorbs infrared radiation.
- Scattering occurs when radiation interacts with matter in a way that changes its direction of "travel." Scattering can occur in all directions, although some directions are preferred, depending on the size and composition of the particles involved in the scattering event. If the radiation encounters a scattering event and continues on in a forward direction, the event is called "forward-scattering." Likewise, objects can also back-scatter radiation, meaning that they redirect the radiation in all directions back toward the source. In some rare cases, the scattered radiation may retain the exact same direction that it initially had before the scattering event. When this occurs, the scattered light is counted in the "transmission" category (because it seemingly emerged unchanged from the medium).
Now let's see these processes (particularly absorption and scattering) in action in the atmosphere. First, the atmosphere, like snow, is a highly discriminating absorber (it only absorbs certain wavelengths of the electromagnetic spectrum). The plot of absorption spectra by various gases (below) indicates how efficiently certain gases and the atmosphere, taken as a whole, absorb various wavelengths of electromagnetic radiation. To interpret the graph, note the "0 to 1" scale on the left of the plot, indicating zero percent absorption and 100 percent absorption, respectively. At any specific wavelength, the upward reach of the color shading indicates the percentage of absorption by a particular gas (or the atmosphere, taken as a whole).
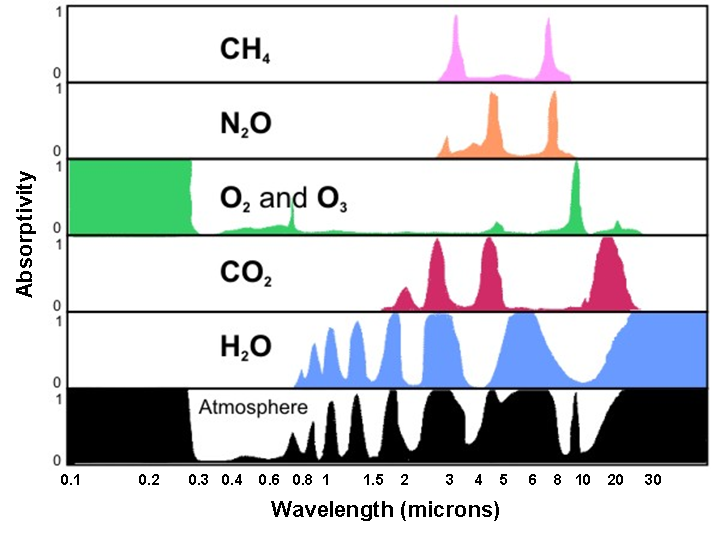
For example, focus your attention on the row for oxygen and ozone, labeled "O2 and O3." Note, to the left of this label, that nearly 100 percent of the radiation emitted at wavelengths ranging from 0.1 to about 0.3 microns is absorbed. Recall that these wavelengths correspond to potentially dangerous ultraviolet radiation emitted by the sun. Ozone, a gas composed of three oxygen atoms (O3), absorbs much of the incoming ultraviolet radiation in the stratosphere, which is a layer that spans from 10 to 30 miles above the Earth's surface. Thank goodness for ozone in the stratosphere! Otherwise, cases of skin cancer and other afflictions associated with overexposure to the sun would likely be much more rampant in our society than they actually are.
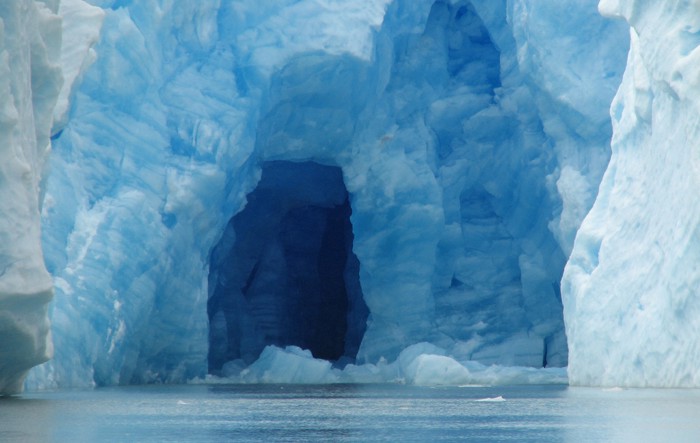
Scattering, on the other hand, makes things look the way they do. You can't see objects if visible light isn't scattered to your eyes. But, scattering doesn't have to be a one-time event. Often, radiation will enter an object and encounter many (hundreds/thousands) of scattering events before emerging. This is what happens to make clouds appear white on top and darker on the bottom (cue the obligatory storm photo [12]). It's also what makes snow, salt, sugar, and milk white. Furthermore, multiple scattering increases the time that the radiation resides in the medium (as it bounces around unable to escape). This longer residence time increases the chance that the radiation will also be absorbed by the medium. A great example is the blue hue that ice sometimes develops. Water (even in frozen form) tends to absorb wavelengths associated with red light at a faster rate than those associated with blue light, so over time with multiple scattering events, more blue light is scattered to our eyes (see below)!
Keep in mind that all three processes (transmission, absorption, and scattering) often occur to some degree when radiation passes through a medium. For example, let's focus on what happens when solar radiation encounters earth's atmosphere:
- about 30 percent is reflected back to space by air molecules, clouds, and the earth's surface. Note that I'm using the word "reflection" as a loose substitute for "back-scattering," but there's a big difference between this loose use of "reflection" and the classic, pure interpretation of "reflection." Pure reflection means that the angle at which radiation strikes an object must equal the angle at which the radiation is redirected from the object (think about how a billiard ball bounces off a bumper on a pool table).
- about 20 percent gets absorbed by clouds and atmospheric gases
- roughly the remaining half is transmitted and ultimately absorbed by the earth's surface
So, of the solar radiation reaching Earth's atmosphere, about half never even makes it to the surface. It turns out we have a special name for the portion that is reflected--albedo, which simply refers to the fraction of radiation striking a surface that is reflected (again, using "reflected" loosely). So, Earth's albedo, on average, is about 30 percent, but albedo over parts of the earth varies from location to location and time to time. For example, thick thunderstorm clouds can have an albedo greater than 70 percent. Snow cover also has a high albedo because it reflects much of the solar radiation that strikes it (fresh snow cover can have an albedo greater than 90 percent). On the other hand, surfaces like asphalt parking lots, forests, or ocean water tend to have low albedos (less than 30 percent) because they don't reflect much of the solar radiation that strikes them.
Obviously, for us here on Earth, the sun is a major source of radiation, but it's not the only important source. Indeed, clouds and atmospheric gases are sources of radiation, too, and they play a critical role in the flow of energy through the earth-atmosphere system. Read on.Creating an Energy Budget: Part I
Prioritize...
By the end of this section, you should be able to discuss the concept of an energy budget and its impacts for temperature. You should also be able to discuss downwelling radiation and its sources. Finally, you should be able to infer sky coverage (clear versus cloudy) and basic events from radiation plots (such as sunrise / sunset times, and major changes in sky coverage).
Read...

You learned early on in this course that temperature is a measure of the motion (or vibration) of molecules within a substance. The fact that the molecules are moving means that temperature must be a measure of energy -- often referred to as "thermal energy" (or "heat energy"). Therefore, understanding the temperature change at a particular location is simply a matter of identifying all of the ways that energy enters, leaves, changes form or is transferred at that location.
To begin this process, let's begin with identifying how energy enters or leaves a location via radiation. Returning to our checking-account analogy from earlier in the lesson, deposits increase the amount of money in your account, while withdrawals decrease the amount of money in your account. The difference between the two determines whether the balance in your account grows or shrinks in value. You can think of the earth's energy "account balance" as its surface temperature. If more radiation is coming in than leaving, the surface will heat up (temperature will increase); if more radiation is leaving than coming in, then the surface will cool (temperature will decrease).
But, how do we know whether we have a net gain or loss of radiation? Well, every financial planner will tell you that you need to make a budget so that you can see exactly what money is coming in and what you are spending so that you know if your bank account is growing or shrinking over time. Likewise, we can make an energy budget in order to keep track of the radiation that is being absorbed and emitted by a surface. For our budget, we treat all downwelling radiation (radiation traveling downward toward the surface) as income (that is, a positive contribution), and upwelling radiation (radiation traveling upward, away from the surface) as an expense. So, our energy budget based on radiation boils down to this simple equation:
net gain or loss of radiation = downwelling radiation - upwelling radiation
By examining the net gain or loss of radiation, we can determine if temperature will increase or decrease. To get started, let's look at the earth's radiation "income" -- downwelling radiation.
Downwelling Solar Radiation
If I asked you to name a source of downwelling radiation for the earth, my guess is many would immediately answer "the sun." That's a good answer! The sun is obviously a major source of downwelling radiation for the earth (during the daylight hours, of course). Remember that the sun's peak emission lies in the visible spectrum, which is convenient for us on Earth because the atmosphere is largely transparent to visible light. Therefore, most of the energy received at the Earth's surface is in the visible spectrum. So, how much radiation does the Earth's surface receive from the sun? Check out the plot below showing the 24-hour plot of the power (energy per unit time) per unit area from downwelling solar radiation at Penn State University on March 11, 2012. At its peak on this date (between 17Z and 18Z), downwelling solar radiation was almost 800 Watts per square meter, so it's as if eight 100-Watt light bulbs were shining on each square meter of the earth.
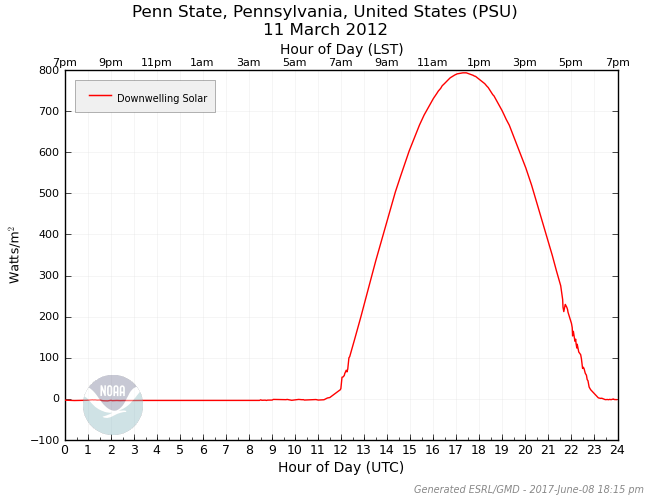
The first thing that you should notice about the shape of the graph is that the sun contributes radiation for only a portion of the 24-hour day (the daytime, obviously). Next, notice that the shape of the radiation curve looks like the top half of a wave. This results from the fact that the heating power of the sun depends on the angle of incoming sunlight. You encounter this concept anytime you shine a flashlight against a surface and change the angle; check out these side-by-side photos of a flashlight shining on a wall at different angles [15] (credit: David Babb) for a visual depiction. When the sun is low in the sky (just after sunrise and before sunset), a lower sun angle results in less heating power per unit area. The sun's heating power per unit area peaks when the sun is highest in the sky (toward the middle of the day). I should also point out that the time of year can dramatically change this curve as well. For example, compare similar plots for downwelling solar on December 11, 2011 and June 2, 2011 [16]. The sun's heating power per unit area is greater in the summer, which probably doesn't surprise you.
But, the curves for downwelling solar radiation aren't always as nice and smooth as the one above. To see what I mean, check out this downwelling solar plot for March 18, 2012 [17]. Why the jagged appearance in the plot? If you answered "clouds," then you're spot-on! Clouds can block varying degrees of downwelling solar radiation, depending on sky coverage and the thickness of the clouds. On a completely overcast day, for example, peak values of downwelling solar are much lower (note that the peak was only around 270 Watts per square meter on this very cloudy day [18]), because of clouds scattering a significant amount of incoming solar radiation back to space.
So how do we enter this "income" on our energy budget balance sheet? Just like you don't get to keep all of the income you make, technically the surface isn't allowed to keep all of the radiation that strikes it, either. Remember that Earth's albedo is about 30 percent, meaning that about 30 percent of incoming solar radiation is reflected back to space. But, that's an average value. The amount of the sun's visible light that is absorbed by the surface and converted to heat energy depends on surface albedo at any given location, and dark surfaces (asphalt, forests, etc.) will have lower albedos than brighter surfaces. To avoid that complexity, we're going to ignore albedo in our calculations, so we'll just use the raw value of downwelling solar as the amount of solar radiation being absorbed by the surface. We'll refer to the contributions from downwelling solar as + downwelling solar (the "+" here indicates a positive contribution to our energy budget).
Downwelling solar, however, isn't the only source of incoming radiation. Indeed, downwelling infrared radiation is also a major source of radiation absorbed by the surface of the earth.
Downwelling Infrared Radiation
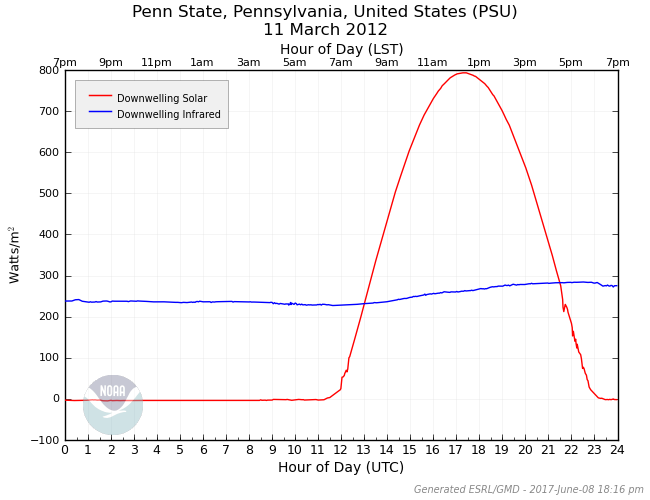
Did you know that the amount of infrared radiation the earth receives from the atmosphere over a 24-hour period is, on average, comparable to (if not greater than) the incoming solar radiation during the day? Pretty amazing! Keep in mind that, even though the sun is way, way hotter, it occupies much less of the sky than our atmosphere. Moreover, the atmosphere emits infrared radiation all day and all night (instead of just during the daytime, like the sun). And like the persistent tortoise, slow and steady often wins the race in terms of radiation.
To see what I mean, examine the radiation plot below. This is the same plot as above (March 11, 2012 at Penn State), only with downwelling infrared (IR) added. Notice that the downwelling IR radiation is, on average, around 250 Watts per square meter and doesn't change much throughout the day. To understand where this radiation comes from, remember that all matter emits radiation at all wavelengths at all times (Planck's Law). In addition, the atmosphere is a fairly efficient absorber of IR radiation due to atmospheric gases such as water vapor and carbon dioxide. In turn, these gases emit IR radiation as well as they absorb it (Kirchoff's Law), and thus, some of this emitted radiation makes it down to the surface. If I add up the total contribution to the downwelling IR radiation, I get a value of approximately 6,000 Watt-hours per square meter for a whole 24-hour period. Likewise, if I add up the total solar contribution, the value comes out to be around 6,100 Watt-hours per meter squared. Pretty surprising, eh?
This graph came from a nearly perfectly sunny day, so the downwelling IR is mainly from invisible air molecules. But, what about clouds? Do they affect downwelling IR? Indeed they do! However, instead of limiting downwelling radiation (as they do for solar radiation), they actually increase downwelling IR radiation. And, the warmer the clouds are, the more IR radiation they emit. In this light, think of clouds as "space heaters," emitting energy toward the ground. For this reason, a cloudy night will tend to be much warmer than a clear night (all else being equal).
To prove my point using actual data, check out this plot on March 12, 2012 [19]. Notice that the solar component contains the signature of increasing clouds (some abrupt drops in downwelling solar late in the day). Likewise, note that the downwelling IR component increases from a low of 250 Watts per square meter in clear sky (around sunrise) to nearly 400 Watts per square meter (later in the day, after 20Z). It turns out that these were pretty warm clouds, and we'll learn later that warmer clouds reside lower in the atmosphere. For another example, examine this plot from March 10, 2012 [20]. It is indeed mostly clear throughout the daylight hours, but what about the night before? Just look at the elevated values of downwelling IR from 02Z to 10Z. The elevated values of downwelling IR tell you that clouds were present, and the somewhat "bumpy" appearance in the downwelling IR plot overnight suggests some changes in the cloud cover during that period.
Since downwelling IR is a second source of income for the surface, we need to add it to downwelling solar. Let's designate the surface's IR income as + downwelling IR. That covers the major sources of radiation "income" for the surface. Up next, we'll turn our attention to the surface's radiation "spending habits" (emissions of radiation) and complete the picture of our energy budget.
Creating an Energy Budget: Part II
Prioritize...
By the end of this section, you should be able to discuss upwelling infrared radiation, and what controls its magnitude. You should also be able to complete an energy budget calculation as shown and assess whether temperature would increase, decrease or stay the same based on the result of the calculation.
Read...
Before we complete our radiation-based energy budget, let's quickly review some basics. It's the net gain or loss of radiation that determines whether temperature will increase or decrease, based on this calculation:
net gain or loss of radiation = downwelling radiation - upwelling radiation
So far, we've covered our important sources of downwelling radiation: downwelling solar and downwelling infrared (from atmospheric gases and clouds). So, we can rewrite our simple radiation-based energy budget like this:
net gain or loss of radiation = downwelling solar + downwelling IR - upwelling radiation
Now we just need to tackle that last piece of the puzzle--upwelling radiation. As it turns out, the main source of upwelling radiation that we need to consider is upwelling infrared radiation from the earth's surface. Let's explore.
Upwelling Infrared Radiation
You may have heard a weathercaster say something along the lines of "conditions are great for radiational cooling tonight." Often, if they try to explain that process, they'll say something like, "When the sun goes down, the Earth's surface begins to emit IR radiation to space." But, that's not quite right. Remember Planck's Law: all objects emit radiation at all wavelengths at all times. This means that the ground is always emitting infrared radiation, and the amount of upwelling IR from the ground depends on its temperature. For example, on a chilly winter morning you could expect an upwelling IR value below 300 Watts per square meter, while on a hot summer's day you might see values exceeding 500 Watts per square meter. To see an example, consider the "upwelling infrared" curve on the plot below from Penn State University March 11, 2012 (the same date as the plots on the previous page).
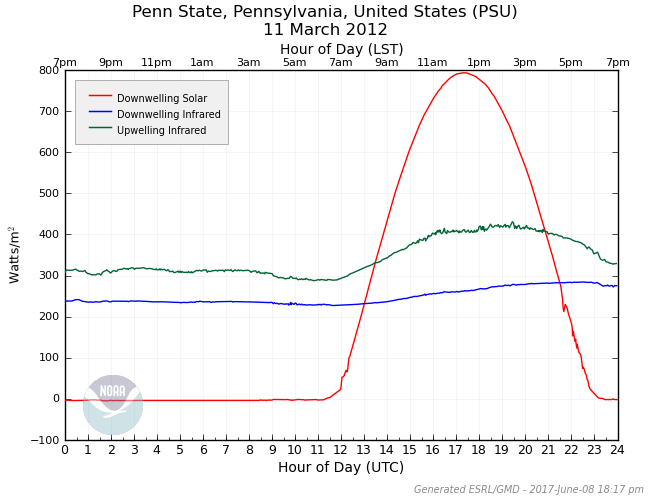
Remember that March 11, 2012 was a very sunny day at Penn State, and note that upwelling IR increases dramatically during the day as surface temperature rises, and then drops more slowly over the nighttime period as the surface temperature slowly cools. So, the ground actually tends to emit more IR radiation during the daytime, when the surface is hotter (and less at night, when the surface is cooler). In other words, any notion that the ground starts emitting IR radiation after the sun sets is nonsense.
Let's see how upwelling IR impacts our energy budget. Upwelling IR represents radiation leaving the surface of the Earth and therefore should be subtracted from our energy budget (much like expenses are subtracted from income in a household budget). Let's designate the surface's expense term: - upwelling IR.
The Complete Budget
If you combine the three terms of the surface energy budget, we get our final equation for the net gain or loss of radiation at the earth's surface:
net gain or loss of radiation = downwelling solar + downwelling IR - upwelling IR
This simple equation can be used to get a rough idea of the temperature trend of the surface. For example, using the graph above, look at the values of the three components at 1800Z. Downwelling solar is about 800 Watts per square meter, downwelling IR is about: 270 Watts per square meter, and upwelling IR is about 410 Watts per square meter. Insert those values into our calculation and we get:
net gain or loss of radiation = 800 W/m2 + 270 W/m2 - 410 W/m2
net gain of radiation = 660 Watts per square meter
Since this is a positive value, we have a net gain of radiation, and that means that temperature would be increasing at this time (the ground is warming because it's gaining energy overall). If we had a negative result, we would have a net loss of radiation, and the surface temperature would be decreasing (a final result of zero means there would be no net gain or loss, and temperature would remain the same).
Need another example? Take a look at the graph around 0600Z. That's nighttime at Penn State, so downwelling solar is 0 Watts per square meter. The downwelling IR is around 240 Watts per square meter and the upwelling IR is approximately 310 Watts per square meter. Using our budget equation, we have:
net gain or loss of radiation = 0 W/m2 + 240 W/m2 - 310 W/m2
net loss of radiation = -70 W/m2
Since the result is negative, we have a net loss of radiation, and that means temperature would be decreasing at this time (the ground is cooling because it's losing energy overall).
To see a couple more examples, watch this short video (4:47) I created, which summarizes energy budgets and walks through some energy budget calculations.
Click here for a transcript of this video video.
I've likened energy budgets to your bank account, and we'll use that idea to diagnose surface temperature trends. In banking, if you deposit more money in your account than you withdraw, your account balance will grow. But if you withdraw more than you deposit, your account balance will shrink.
Using radiation to construct an energy budget is similar. If an object absorbs more radiation than it emits, then its temperature will increase. It will warm up because more radiation is coming in than is going out. On the other hand, if an object absorbs less radiation than it emits, its temperature will decrease. It will cool because more radiation is going out than is coming in and being absorbed.
So to figure out if you have a net gain or loss of radiation, you take the difference between your incoming radiation and outgoing radiation. For the earth's surface we use this equation. We have downwelling solar and downwelling infrared as our sources of incoming absorbed radiation, and upwelling infrared radiation as outgoing emitted radiation. A positive result means a net gain in radiation and the earth's surface warms up. A negative result means a net loss of radiation, and the earth's surface cools.
Let's look at an example from Penn State University on May 8, 2017. To get our bearings on the graph, the red curve shows downwelling solar radiation, which is coming to the ground and being absorbed. The blue curve shows downwelling infrared radiation, which is radiation coming to the earth from clouds and air molecules in the atmosphere. The green curve shows upwelling infrared radiation, which is radiation that's being emitted from the earth.
To get a sense of what's going on here, let's start by looking at the solar curve. It's flat at zero watts per square meter until just after 10Z, which is 6:00 AM local time at Penn State on May 8, because Daylight Saving Time is in effect. After sunrise around that time, the amount of downwelling solar increases. And the curve is mostly smooth except for a few wiggles, which is telling us that skies were mostly clear.
Then after 17Z, the solar curve jumps around quite a bit, and there are some really big decreases because of clouds scattering some incoming solar radiation back to space. We also see some small upward bumps in the downwelling infrared curve, because the clouds were emitting some additional IR radiation to the ground, too.
So what if we want to calculate a net gain or loss of radiation at local noon? That's 16Z on May 8 at Penn State. And we just have to read our values off the graph and plug them into our equation.
It looks like incoming solar would be about 1,000 watts per square meter at 16Z, and we just have to plug that into our equation. Downwelling infrared radiation looks to be about 250 watts per square meter. So those are our two sources of incoming radiation at the surface.
Our upwelling infrared is our emitted radiation, marked by the green curve. And it would be about 400 watts per square meter. So we have to subtract 400 in our equation.
Crunch the numbers and we end up with a positive result of 850 watts per square meter. The ground was warming up at local noon because we had a net gain in radiation at that time. More radiation was coming in and being absorbed than was being emitted. In reality other factors impact temperature, too, but we're going to ignore those for now and just focus on the impacts of radiation on temperature trends.
If we wanted to do a calculation at nighttime, we could do that too. Let's do one before dawn at 9Z. That's 5:00 AM local time at Penn State on May 8. Note the little bump up in downwelling infrared at this time, suggesting some cloudiness. Again, we just have to read the values off the graph and put them into our equation.
There's obviously no contributions from the sun at 9Z because it's before the sun comes up. So downwelling solar is zero watts per square meter. Downwelling infrared is about 300 watts per square meter, and upwelling infrared is about 320 watts per square meter. So we take 300 and we subtract 320. And we get a result of negative 20 watts per square meter. That's a small negative result. And the ground would be cooling very slightly, since we have a small net loss of radiation. A little more radiation is leaving than is coming in and being absorbed.
So clouds acting as space heaters at this time were able to boost downwelling infrared radiation almost enough to erase the radiation deficit and nearly stop the nighttime decrease in temperature at this time.
Of course, radiation isn't the only way that energy flows through the earth-atmosphere system, and it's certainly not the only controller of temperature. If only forecasting temperature was as easy as making a simple radiation-based energy budget! Still, weather forecasters must consider the local energy budget when thinking about temperature trends because it's an important piece of the puzzle. We'll start expanding our knowledge of other types of energy transfer and impacts on temperature soon, but up next we're going to apply your new knowledge about energy budgets to the "greenhouse effect" and global warming. Before you move on, however, check out the Quiz Yourself section below, which will allow you to test your understanding of energy budgets and the resulting impacts on temperature.
Quiz Yourself...
The interactive calculator below will give you some more practice thinking about surface temperature trends based on a given energy budget (which you can adjust). To orient yourself, the surface temperature slider on the left controls the upwelling IR component, while the day/night toggle at the top controls the downwelling solar component. If you want to complicate the problem, add high or low clouds by clicking their respective check boxes. After you select a scenario, try to figure out the heating or cooling trend at the surface. Check your reasoning by placing your mouse over the budget panel on the right. You might also compare similar scenarios (for example, look at the nighttime temperature trend with a low cloud versus no cloud).
The "Greenhouse Effect," and Global Warming
Prioritize...
Once you've completed this page, you should be able to discuss the so-called "greenhouse effect," and the "greenhouse gases" that contribute to it, as well as its importance for life on Earth. You should also be able to describe the connection between the greenhouse effect and global warming and make a distinction between the two.
Read...
I hope that over the last few sections you've gotten the idea (which maybe surprised you initially) that the atmosphere itself is an important contributor to Earth's energy budget. That's right, even invisible atmospheric gases (and clouds) emit some radiation toward the earth's surface! The key to understanding this observation lies in our laws of radiation. Recall that Planck's Law tells us that all objects emit radiation at all wavelengths at all times.
As you've learned, the earth's peak emission occurs at infrared wavelengths (from Wien's Law), so what happens to that radiation after it's emitted upward from the surface? Some is absorbed by air molecules, in particular, so-called "greenhouse gases," such as water vapor, carbon dioxide, methane, and nitrous oxide. Of the greenhouse gases, water vapor is the most abundant in the atmosphere, followed by carbon dioxide (although recall that in the overall scheme of the atmosphere, these are trace gases). It turns out that some of the wavelengths that carbon dioxide and water vapor absorb readily (particularly those around 15 microns and a little larger) coincide with the wavelengths of earth's peak emission.
Kirchoff's Law tells us that if an object is an efficient absorber of radiation at a particular wavelength, then it's also an efficient emitter of radiation at that wavelength. A consequence of Kirchoff's Law then is that greenhouse gases like water vapor and carbon dioxide also emit IR radiation efficiently at those wavelengths, some of which is emitted toward Earth's surface. The emissions that reach the surface are a major contributor to the "downwelling infrared" traces on the graphs we were using for our energy budgets [21].
The fact that greenhouse gases absorb and emit infrared radiation so readily works out very well for humans. Without emissions of downwelling IR from greenhouse gases, the average temperature of Earth's surface would be about 0 degrees Fahrenheit (-18 degrees Celsius). That's a pretty harsh environment for life on earth, and certainly life as we know it could not exist. However, observations show that the average temperature of Earth's surface is about 59 degrees Fahrenheit (15 degrees Celsius), and it's downwelling IR from greenhouse gases that are responsible. Without greenhouse gases, the temperature of Earth's surface would be nearly 60 degrees lower -- much, much colder!
The contributions of downwelling IR from greenhouse gases to warming the planet are called the greenhouse effect. To be honest, the names "greenhouse effect" and "greenhouse gases" are pretty unfortunate, because the processes at work to create the planetary warming are not the same as those in a greenhouse, but I'll touch on that shortly. The bottom line is that the warming from the greenhouse effect is essential to sustaining life as we know it on Earth.
Global Warming
The existence of earth's greenhouse effect is perhaps as important as its distance from the sun in determining the average global surface temperature, so there's no doubt that some greenhouse effect is desirable. But, can we have too much of a good thing? Might the magnitude of the greenhouse effect change if we change the concentration of greenhouse gases in the atmosphere?
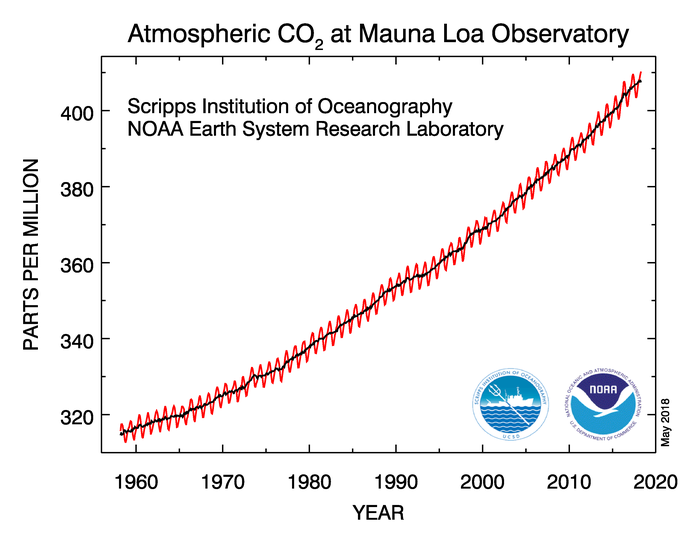
Before the Industrial Revolution in the late 1700s, the atmospheric concentration of carbon dioxide was around 280 parts per million, but through the burning of fossil fuels like coal, oil, and natural gas, humans have added carbon dioxide to the atmosphere. The concentration of carbon dioxide in the atmosphere now exceeds 400 parts per million, and you can see the upward trend in atmospheric carbon-dioxide concentration since the late 1950s in the data from the Mauna Loa Observatory [22] in Hawaii below.
Remember that carbon dioxide is the second most important greenhouse gas (behind water vapor) so increasing its concentration gradually results in a stronger greenhouse effect, which means more downwelling IR being emitted toward Earth, causing the planet to warm additionally (a "global warming"). So, if you've read an article or watched a news story about global warming, the strengthening of the greenhouse effect from an increased concentration of greenhouse gases is the basic science behind it. That's far from the whole picture, though, and we'll explore other issues related to global warming and climate change in a later lesson.
Finally, I mentioned earlier that the phrases "greenhouse effect" and "greenhouse gases" are rather unfortunate because the processes involving emission of radiation from gases is a different process than what keeps a greenhouse warm. The name "greenhouse effect" was dubbed in the early 1800s when it was thought that greenhouses stayed warmer because the panes of glass allowed solar radiation to enter, but prevented radiation emitted from plants and other objects inside the greenhouse from escaping. It turns out that a big reason why greenhouses stay warmer inside has to do with the fact that the air inside cannot mix with cooler air outside the greenhouse. The warm air in a greenhouse essentially gets trapped inside the panes of glass, but there is no "trapping" with respect to the atmospheric "greenhouse effect" (even though you may still see it described in terms of "trapping heat"). The atmospheric "greenhouse effect" is all about the absorption and emission of infrared radiation by some atmospheric gases. But, alas, the name "greenhouse effect" stuck, and the rest is history.
The idea of air not being able to mix with cooler air outside a greenhouse leads us to our next topics. Indeed, we've talked a lot about how energy is transferred via radiation, but it's time to look at how energy is transferred through the earth-atmosphere system by contact between objects and by the movement of air (the very movement of air prevented by the panes of glass on a greenhouse). Read on.
Energy Transfer: Conduction
Prioritize...
After reading this section, you should be able to describe how energy is transferred via conduction, as well as discuss the speed of the process and where in the atmosphere it's most relevant. You should also be able to discuss the term thermal conductivity, and discuss the role of conduction in creating nocturnal inversions.
Read...
We've already talked about how the earth's surface warms or cools in response to absorption and emission of radiation at the surface, but radiation processes by themselves don't determine the temperature of the air. Now we need to discuss other ways that energy from the earth's surface is transferred to the atmosphere, namely "conduction" and "convection." We'll start with conduction, which, as you're about to see, is "a touchy subject."
Conduction
Recall from our definition of temperature that the molecules and atoms in warm objects have high kinetic energy, on average. The kinetic energy of molecules and atoms in cold objects is much more low-key. When warm and cold objects come into contact, fast-moving atoms and molecules collide with slower ones, imparting kinetic energy as a result of the collision. To see what I mean, imagine a dance floor full of wildly dancing teenagers and some retired couples who are dancing cheek-to-cheek to a slow ballad. Inevitable collisions cause slow dancers to gain unwanted kinetic energy and lurch awkwardly across the dance floor. Meanwhile, frenetic teenagers lose kinetic energy during collisions.
Our odd mixture of wildly dancing teenagers and slow-dancing retired couples illustrates the idea of conduction--the transfer of energy by contact, via molecular collisions. For a visual example, check out the short video below (1:33).
Conduction is the transfer of heat energy by the kinetic motion of atoms in a substance. Remember that all atoms have motion of some sort. This is true even for atoms that make up a solid. In this animation, note that the atoms in the bar of metal are vibrating slowly due to their relatively low temperature (in real life, I might add, atoms are vibrating at tremendous speeds, so this is just a representation). Now watch what happens when I slide the bar of metal into a furnace.
Notice that as the metal heats up, the atoms at the end of the rod begin to vibrate faster. The faster vibrating atoms transfer some of their energy to the slower adjacent atoms. Thus, the slower atoms also vibrate faster, giving them a higher temperature. This is conduction.
I should also mention that conduction works to cool an object as well. When a slower vibrating atom is next to a faster vibrating one, we’ve seen that the slower atom takes some of the energy from the fast atom. This makes the slow atom vibrate faster BUT, it also slows down the faster vibrating atom, cooling it. If there are MANY, MANY more “cooler” atoms than warmer ones, then the net effect of the energy transfer is to cool the warmer atoms back to a temperature equal to its surroundings.
Keeping with our dance-floor metaphor, what happens when a relatively warm object comes into contact with a cooler object? Not surprisingly, the warmer object gets colder as its wildly dancing molecules lose kinetic energy when they collide with the slower dancing molecules of the colder object. In turn, the colder object gets warmer as it gains kinetic energy during contact.
For example, your hand feels cold when you grasp a metal object in your apartment or house. That's because metal has a high thermal conductivity (a measure of a material's ability to conduct heat energy). In other words, metal conducts kinetic energy rapidly away from the fast-vibrating molecules in your skin. As a result, your hand feels cool.
Unlike most metals, air has low thermal conductivity. That's why porous materials such as wool (porous means that there are small pockets for air to occupy) are effective thermal insulators. Given air's low thermal conductivity, it shouldn't come as a surprise that conduction between the ground and the overlying air proceeds at a relatively slow pace. To get a sense of what I mean, suppose you were to press a slab of wood a few inches thick against a hot burner on your kitchen stove that is much too hot to touch. The temperature of the wood in contact with the oven burner is very close to that of the burner (thanks to conduction), but the top of the wood slab can be touched without any pain. Why? The block of wood takes time to heat up because wood has a relatively low thermal conductivity, causing the transfer of molecular kinetic energy through the thickness of the wood to be slow.
The low thermal conductivity of the wood slab on your kitchen stove is akin to a slab of air overlying the hot ground on a sunny summer day. After sunrise, the ground typically warms rapidly as it absorbs relatively intense solar radiation, and incoming solar energy concentrates in the first few inches of the ground (even on a sunny, hot day, you don't have to dig very far to reach cool soil). In turn, a very thin layer of air in contact with the ground warms dramatically via conduction, albeit rather slowly.
On paved roads, temperatures in this thin layer of air can reach as high as 140 degrees. Air temperatures at nose-level, however, are, say 85 degrees, marking a rapid drop-off with height. Hot bare feet (ouch!) but tolerable nose-level temperatures prevail, in part, because of the air's low thermal conductivity.
Conduction also plays a role on clear, calm nights in creating relatively large vertical temperature variations near the ground. Thinking back to energy budgets, you know that the ground routinely starts to cool after the sun sets on a clear night because it emits more radiation than it gains from the atmosphere. In other words, the temperature of the ground starts to lower because it runs a radiation deficit. In turn, a thin layer of air next to the ground starts to cool by conduction as a transfer of heat energy takes place from the initially warmer air to the cooler ground. This downward transfer of heat energy serves only to slightly slow down the cooling rate of the ground, which continues to lose more radiation than it receives.
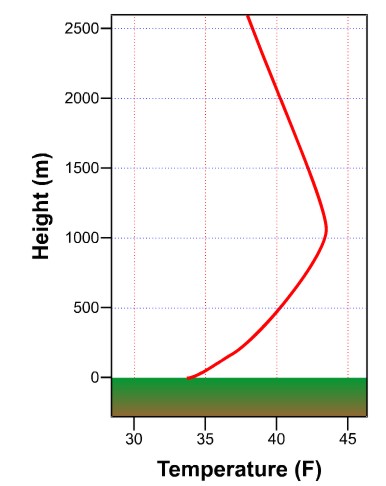
On a clear night with light winds, the delay in cooling the air not in contact with the ground often results in the air temperature increasing with increasing height above the ground. This vertical temperature profile is called a nocturnal inversion, "nocturnal" meaning occurring in the night and "inversion" referring to the fact that temperature increases with height in the atmosphere. As we'll discuss later, temperatures usually decrease with height in the lower part of the atmosphere, so inversions are contrary to that "typical" state.
To understand how a nocturnal inversion forms, remember that the net radiation loss at the surface (and resulting cooling) is indirectly driving the cooling of the air above. When downwelling IR is small due to a lack of clouds, the cooling rate at the surface is maximized, and once the ground begins to cool, a thin layer of air in contact with the ground turns colder and denser as energy is transferred down to the ground via conduction (heat energy is transferred from the initially warmer air to the colder ground). As a thin layer of "cool" air in contact with the surface develops, the result is that the layer of air just above it remains warmer, so then that layer also begins to cool via conduction as heat energy is transferred downward. The process continues, causing the "cool" layer of air in contact with the surface to thicken, but it's a relatively slow process because of the air's low thermal conductivity. Eventually, temperatures start to decrease even at the level where temperatures are officially measured (about 5 feet above the ground) and modestly higher altitudes. Meanwhile, warmer air resides above the deepening layer of nocturnal chill. Here, the downward heat transfer is painstakingly slow because of the thickness of the insulating layer of air below it.
To illustrate how dramatic the nocturnal temperature profile can be at the surface, consider this: frost (ice crystals) can sometimes form on the grass (or plants) at night when the official low temperature is 36 degrees Fahrenheit. Given the structure of a nocturnal inversion, it is quite feasible that the air temperature at grass-blade level falls below 32 degrees while the air temperature at the official measurement height (roughly 5 feet) is 36 degrees.
The bottom line is that on a clear night with calm (or very light) winds, nocturnal inversions often form via conduction and temperatures near the ground actually increase with height. The requirement of a clear sky should make sense to you because it maximizes the ground's radiation deficit and subsequent cooling to get the process started. But, what's up with the requirement that winds be calm (or very light)? Indeed, a windy night disrupts the processes that help form the nocturnal inversion, and that leads us to our final method of energy transfer--convection. Read on.
Energy Transfer: Convection
Prioritize...
When you've finished this page, you should be able to describe energy transfer via convection, as well as discuss ways to generate convection such as buoyancy and mechanical eddies.
Read...
Our final method of energy transfer is convection. First I'm going to define convection and describe two ways to generate it, and then we'll apply that knowledge to see why winds help inhibit the development of nocturnal inversions.
Convection
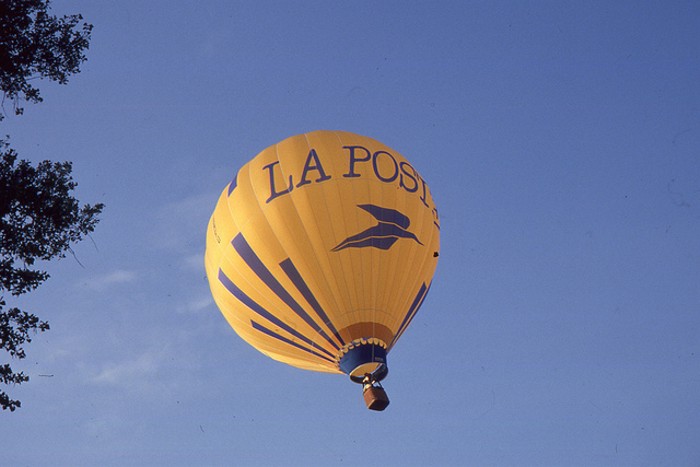
While conduction can be a painfully slow method of energy transfer, convection is more like a speedy locomotive. Convection is the transfer of heat energy via the vertical movement of the air. Remember those very thin layers of air in contact with paved surfaces on hot summer days? They can approach 140 degrees Fahrenheit thanks to conduction, but convection limits the thickening of those blazing hot layers of air. Just like a hot-air balloon lifting off the ground, blobs or "parcels" of hot air rise from the ground, carrying hot air skyward. This transfer of heat energy away from the ground by the vertical movement of air is called "free convection" or "natural convection."
To understand the nuts and bolts of free convection, let's with the concept of buoyancy. Suppose that, while taking a swim, you submerge your favorite beach ball and then let it go. In a heartbeat, the beach ball will bob to the surface of the water. In scientific terms, the beach ball is positively buoyant. Now submerge a rock and then release it. It falls to the bottom of the pool because the rock lacks sufficient positive buoyancy to keep it afloat. Formally, we say that the rock has negative buoyancy.
What makes the difference in the buoyancy between a rock and a beach ball? The answer is density. Formally, the density of an object is its mass (akin to weight) divided by its volume. The beach ball has a relatively large volume and small mass, making its density rather small and far less than the density of water. A rock, on the other hand, has a greater density than water, so it sinks. We can generalize these observations in this way: an object immersed in a fluid (water, air, etc.) is positively buoyant if the density of the object is less than the density of the fluid. Moreover, the magnitude of the buoyancy force depends on the difference in densities between the submersed object and the fluid - the greater the difference, the greater the buoyancy force.
Okay, let's take our discussion out of the water and into the air. For the time being, let's start with a "parcel" of air ("parcel" is just a fancy name for a generic blob of air that we assume does not interact with surrounding air). Several factors can cause the density of the air to change, but we're going to focus on the effects of temperature on air density.
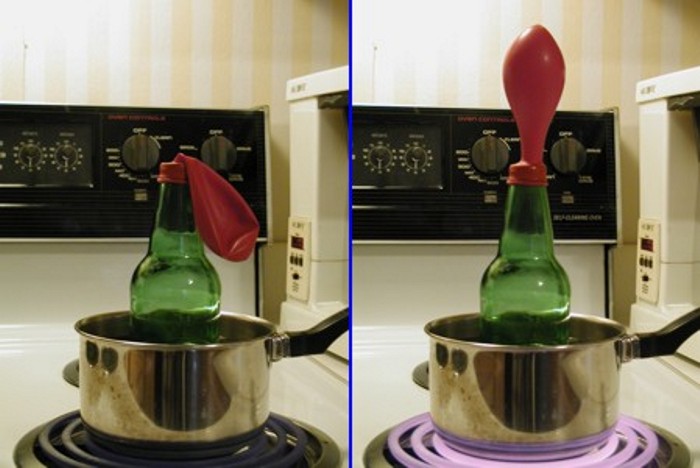
To understand the connections between changes in temperature and changes in density, let's conduct a simple experiment. First, I'll place a soda bottle in a pan of cold water for a few minutes and then cover the opening with a cheap party balloon. With the balloon sealing off the air in the bottle, we've isolated a "parcel" of air with a constant mass (provided we don't remove the balloon). Now, I'll heat the container of water in which the bottle sits. As the water warms the bottle and the inside air, air molecules increase their kinetic energy, and the air inside the bottle expands and inflates the balloon. In other words, the volume occupied by the "air parcel" is now larger, despite the mass of the air remaining the same. It follows that the air density, which is mass divided by volume, is now less.
Our experiment gives us an important result: Increasing the temperature of the air inside a parcel causes its density to decrease (and vice versa). In turn, the positive buoyancy of the parcel increases and, as a result, it shows a tendency to rise if it's "submersed" in air with higher density.
Now let's connect this discussion on density and buoyancy to free convection. On a sunny day, the sun heats the ground and, in turn, the ground heats a thin layer of air in contact with it by conduction. But the ground heats the overlying air unevenly, so there are spots that are hotter than others. For example, think about a sunny summer day and the torridly hot air in contact with the concrete surface of a parking lot. Now think about the cooler air that overlies the surrounding grassy area. The air over the parking lot is less dense than the surrounding air and therefore more positively buoyant. In turn, air parcels rise more readily from the parking lot, transferring heat energy upward. This transfer of heat energy is, of course, a consequence of free convection.
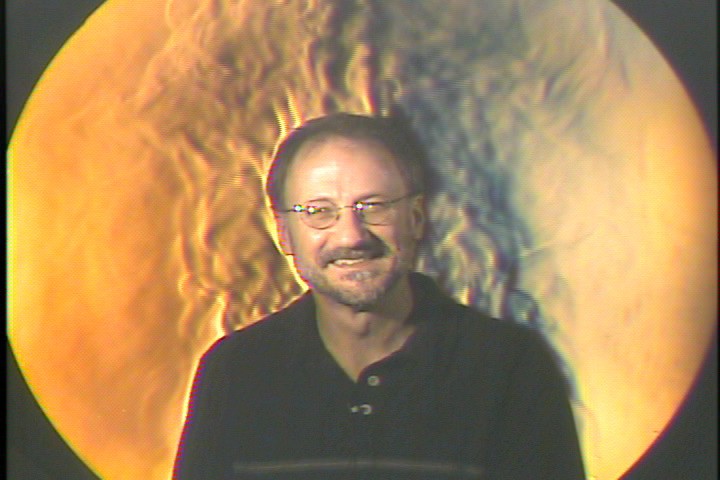
Manifestations of free convection vary from sensational cumulonimbus [31] clouds (thunderstorm clouds) that reach miles into the sky to the "thermals" routinely ridden by hawks, glider pilots, and hang gliders. To the naked eye, these thermals, which are currents of rising air associated with free convection, are often invisible. However, a striking form of imaging called Schlieren photography (explanation [32]) allows for us to visualize the rather subtle variations of density of air parcels rising from a relatively warm object like the ground. Below is a Schlieren photo showing convection from a former meteorology instructor at Penn State, Lee Grenci. Notice the thermals of warm buoyant air that can be seen rising from his skin. You can really see the thermals in this Schlieren video showing more of Lee's "heat" [33]. A Transcript for this Visualizing Convection [34] video is here.
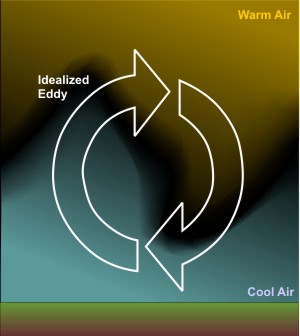
The turbulent swirls of air shown in the image above (also shown in the video) are called eddies, and whether we can see them or not, they're the essence of convection. But, free convection that results from positively buoyant air parcels isn't the only source of convective eddies. Indeed, when the wind blows over the rough surface of the earth, it creates turbulent eddies [35]. These eddies result because friction slows wind speeds near the earth's surface, but higher up, wind speeds are faster because friction is weaker. Faster winds blowing over slower winds causes eddies to develop. You can simulate this idea yourself if you place a pencil in the palm of your hand and then slide your other hand over the pencil. The pencil rolls, doesn't it? That's the basic process that allows the wind to churn up convective eddies, which meteorologists call "mechanical convection" to differentiate it from free convection.
It is ultimately mechanical convection generated by wind that can prevent the formation of nocturnal inversions, even on clear nights. At night, invisible eddies mix colder air in contact with the cooling ground upward, while also circulating slightly warmer air toward the ground from higher up. To help you visualize the mixing effects of eddies, check out this (28 second, silent) video from the Department of Mechanical Engineering at the University of Melbourne [36]. Researchers were looking at how eddies are formed in a fluid flowing over a surface, which is very similar to what happens when air blows over the ground. Notice how eddies mechanically mix the light and dark layers of the fluid. You can think of the light-colored fluid as cold air in contact with the ground, while the dark-colored fluid is warm air above the ground. With time, you can see the eddies mix the two fluids--the same process that occurs on a windy night.
As the speed of the wind increases, eddies become more turbulent and more vigorously circulate air upward to an altitude of several thousand feet. Eddies try to run a balanced budget and, in compensation, circulate air toward the ground from similar altitudes, effectively satisfying the popular adage that "what goes up must come down." In addition to the speed of the wind, the local roughness of the earth's surface also determines the upward reach of eddies.
In windy conditions, the ups-and-downs associated with turbulent eddies thoroughly stir and mix the lower atmosphere. What is the impact on temperature? Well, when you add cold milk to a cup of hot coffee and mix the two, the resulting fluid has a temperature that is warmer than the cold milk but cooler than the hot coffee, and so it is with mixing from eddies. Mixing from eddies keeps air near the surface warmer than it would be if winds were calm and conduction was allowed to dominate. So, all other meteorological factors being equal, a windy night is warmer than a calm night. This result may seem contrary to your experience because a windy night often "feels" cooler than a calm night, but that chilly feeling of the wind results from an accelerated loss of body heat.
As I mentioned before, eddies from free convection (and/or mechanical convection, if it's windy) on sunny, summer days are also responsible for limiting the thickness of those blazing hot, thin layers of air in contact with the surface. As hot air parcels become positively buoyant and rise, other parcels sink and bring cooler air toward the surface. So, thank goodness for the mixing from eddies from both mechanical and free convection!
Now that we've covered all the modes of energy transport, we're going to wrap up the lesson by debunking a commonly heard myth about clouds and blankets. Keep reading!
Clouds Do Not "Act Like Blankets"
Prioritize...
You should be able to apply your knowledge of energy transfer (particularly via radiation and convection) to explain why clouds do not act like blankets to keep nights warmer.
Read...
You now know that all else being equal, a clear, calm night will be colder than a cloudy and/or windy night. That's because clear, calm nights maximize the earth's surface radiation deficit, paving the way for nocturnal inversions to develop as conduction dominates. But, either wind or the presence of cloud cover can limit nocturnal chill near the ground. We just covered at length how wind can limit nocturnal chill (by mixing from mechanical eddies). But, with your knowledge of radiation, we can debunk what is easily the most popular explanation for why clouds keep nighttime temperatures higher:
Motivating Myth: Clouds act like blankets to keep nights warmer.
Likening clouds to blankets to explain their role in keeping nighttime temperatures higher near the surface of the earth is very common, and you've likely heard that "clouds act like blankets" if you took a weather course at some point in your previous education, or you ever heard a meteorologist try to explain the phenomenon quickly on a TV weathercast. "Clouds act like blankets" gets repeated so frequently because it's a simple analogy, but it's also very wrong. Yes, both clouds and blankets keep things warmer, but that's where the similarities end, and with our knowledge of radiation and convection, we can cast the idea of clouds acting like blankets onto the scientific scrap heap.
For starters, have you ever thought about how a blanket keeps you warm? If you haven't, the Schlieren photography that I introduced in the last section provides the answer. Check out the side by side images below. On the left is a Schlieren photograph of former meteorology instructor Lee Grenci's bare arm. On the right is a Schlieren photograph of Lee's arm covered with a (relatively porous) cotton blanket.
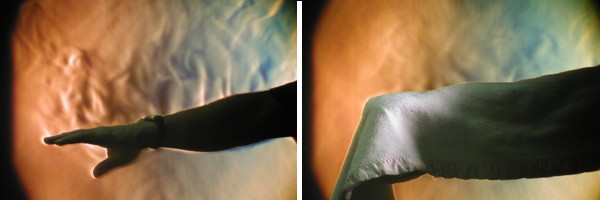
Notice how the blanket greatly reduces the escape of convective thermals away from Lee's skin. You can still see some convective thermals escaping even from Lee's blanketed arm because the cotton blanket is so porous, but there's still obviously a significant reduction compared to Lee's bare arm. So, now do you know how blankets keep you warm? Blankets suppress convection away from your skin, which reduces the transfer of heat energy away from your body.
For a blanket to be effective, it must be close to your body so that it can keep the warm air right next to your skin, and prevent it from rising away and mixing with colder air in the room. Think about it: would a blanket keep you warm if it was suspended above you like a tent with no sides? Of course not! You could verify this by nailing a blanket to your bedroom ceiling and seeing if it makes you feel warmer, but I wouldn't recommend it. The result is intuitive: A blanket fastened to your ceiling will not warm you up. Yet, we're asked to believe that clouds located hundreds or thousands of feet above the earth's surface keep nights warmer because they "act like blankets." Nonsense!
Clouds have no ability to suppress convection or trap warm air near Earth's surface. Furthermore, at night, there's typically no free convection to suppress anyway. So, clouds can't act like blankets. They are simply sources of downwelling IR radiation that is absorbed by the earth's surface, reducing (or sometimes completely eliminating) the ground's typical nighttime radiation deficit, which helps keep surface temperature higher than it would be on a clear night.
To seal the deal, check out the plot of downwelling IR from Penn State University on May 8, 2017 below. Toward the bottom of the image, I've included the corresponding sky coverage as reported on the local station model. Note the big spike up in downwelling IR after 08Z (from about 225 Watts per square meter to about 290 Watts per square meter), which corresponded to an increase in cloud cover. After 10Z, downwelling IR dipped again, and we can see from the station models that between 10Z and 11Z, the cloud coverage went from "broken" (mostly cloudy), to scattered (partly cloudy), so fewer clouds meant a reduction in downwelling IR.
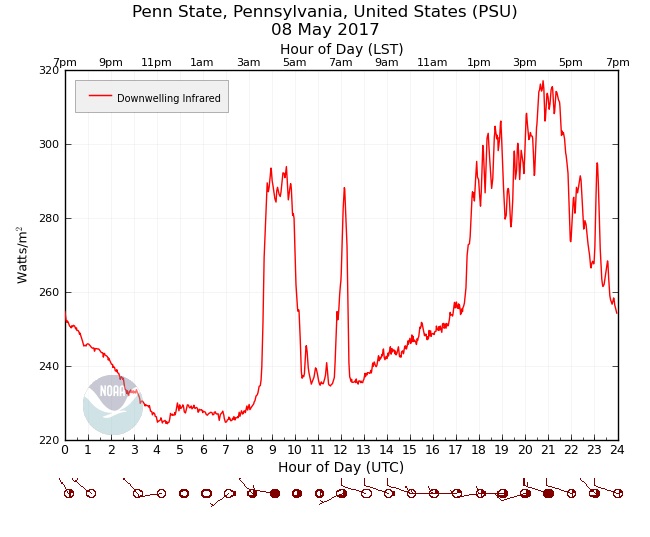
The trends from the graph are unmistakable: every time cloud coverage increased, downelling IR increased, too, and when cloud coverage was reduced, downelling IR displayed a corresponding decrease. So, the take-home message here is that clouds act like space heaters because clouds serve as additional sources of radiation (downwelling IR) for the earth's surface. Clouds don't suppress convection like blankets do, so clouds do not "act like blankets" in keeping nights warmer. Of course, blankets emit some radiation, too (all things emit radiation at all wavelengths at all times), but no more than any other household object. Radiation emitted by a regular blanket is not enough to make you feel warmer.
Now, whenever you hear someone say that "clouds act like blankets," you know better, and you can avoid believing such "junk science!"