1.4 Are you ready to get with the programming?
Meteorologists and atmospheric scientists spend much of their time thinking deep thoughts about the atmosphere, the weather, and weather forecasts. But to really figure out what is happening, they all have to dig into data, solve simple relationships they uncover, and develop new ways to look at the data. Much of this work is now done by programming a computer. Many of you haven’t done any computer programming yet, and for those of you who have, congratulations – put it to good use in this class. For those who are programming novices, we can introduce you to a few of the concepts of programming by getting you to use Excel or another similar spreadsheet program.
To help you learn and retain the concepts and skills that you will learn in this course, you will solve many word problems and simple math problems. For several activities, we give you the opportunity to practice solving particular types of problems enough times until you gain confidence that you can solve those same types of problems on a quiz. That means that you will be solving some types of problems several times and only the numbers for the variables will change. The simplest way for you to solve these problems is to program a spreadsheet to do that repetitive math for you.
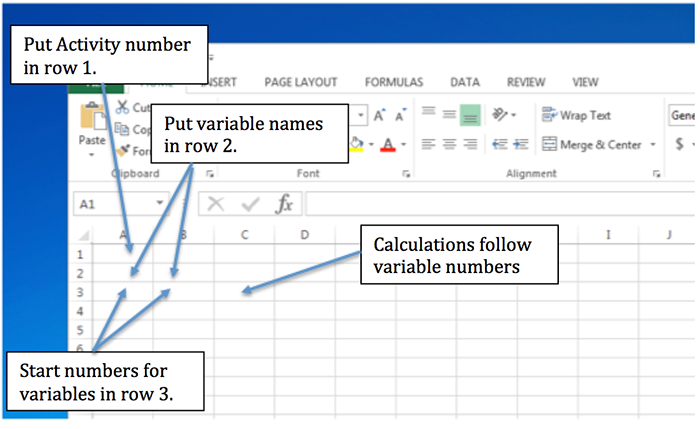
Screenshot shows an Excel Spreadsheet
A text box says "put activity number in row 1" and an arrow points to cell A1.
A second text box says "put variable names in row 2" with an arrow pointing to cells A2 and B2
A third text box says "start numbers for variables in row 3" with an arrow pointing to cells A3 and B3
A final text box says "calculations follow variable numbers" with an arrow pointing to C3.
Let’s do a simple example. Suppose we have several boxes, some with different shapes and sizes, and we want to calculate the volume of the boxes and find the total volume. I have put in the names of the variables (with units!) and then the numbers for the length, width, and height of each box type and the total number of each box. To calculate the volume of each box, click on E3 and put an “= a3*b3*c3” in the equation line. Hit enter and it will do the calculation and put the answer in E3. A small square will appear in the lower right corner of E3. Click on this square with the mouse and pull down over the next three rows. Excel will automatically do the calculations for those rows. To calculate the total volume, go to F3 and enter “=d3*e3,” and hit “enter.” Grab the small box and pull down to get the total volume of each type of box. To get the total volume, click on F7, click on “Formulas,” and then “AutoSum,” and finally “Sum.” Excel will show you which cells it intends to sum. You can change this by adjusting the edges of the box it shows. Finally, pay attention to significant digits in your calculated volumes. You can adjust the number of decimal places by highlighting a cell or group of cells and then by clicking on the appropriate icon on the Excel tool bar. Note that an incorrect number of significant figures is displayed in some of the answers--see if you can figure out where.
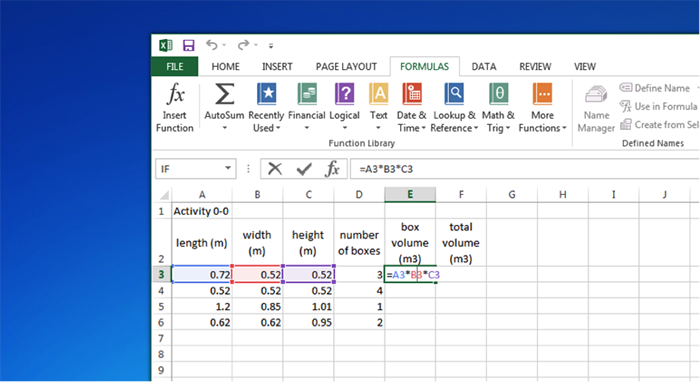
| length (m) | width (m) | height (m) | number of boxes | box volume (m3) | total volume (m3) |
|---|---|---|---|---|---|
| 0.72 | 0.52 | 0.52 | 3 | =A3*B3*C3 | |
| 0.52 | 0.52 | 0.52 | 4 | ||
| 1.2 | 0.85 | 1.01 | 1 | ||
| 0.62 | 0.62 | 0.95 | 2 |
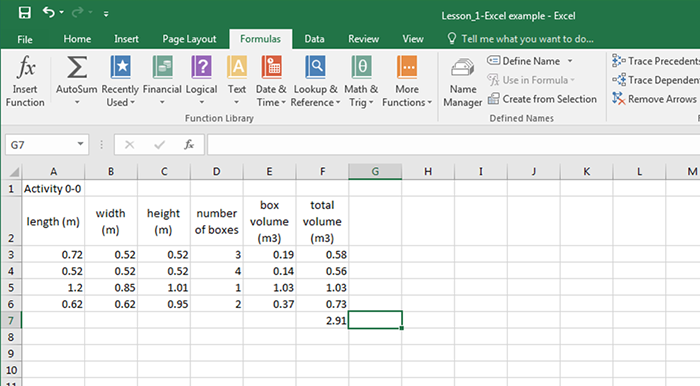
| length (m) | width (m) | height (m) | number of boxes | box volume (m3) | total volume (m3) |
|---|---|---|---|---|---|
| 0.72 | 0.52 | 0.52 | 3 | 0.19 | 0.58 |
| 0.52 | 0.52 | 0.52 | 4 | 0.14 | 0.56 |
| 1.2 | 0.85 | 1.01 | 1 | 1.03 | 1.03 |
| 0.62 | 0.62 | 0.95 | 2 | 0.37 | 0.73 |
Hopefully this example is a refresher for most of you. For those who are totally unfamiliar with Excel, please click on the question mark in the upper right of the screen and type in the box “creating your first workbook.” You can also visit Microsoft's help page for additional step-by-step instructions for how to Use Excel as Your Calculator. The best way to learn, after the introduction, is by doing. The Keynote Support website also lists helpful summaries of instructions.
Activity 1-3: Setting up your Meteo 300 Excel workbook.
Please follow the instructions above for setting up an Excel workbook. You will be using this workbook to do calculations, plot graphs, and answer questions on quizzes and problems for the rest of the course.
Use the same headings and the same numbers in the first four columns. Enter your own equations and find the box volumes and total volumes.
This assignment is worth 15 points. Your grade will mostly depend upon showing that you set up the workbook, but some additional points will be assigned contingent upon how well you follow the instructions. When your Excel workbook is complete, please do the following:
- Make sure that the file for your workbook follows this naming convention: Workbook_your last name (i.e., Smith)_your first name_(i.e., Eileen).xlsx.
- In Canvas, find Activity 1-3: Setting up your Meteo 300 Excel workbook. Upload your Excel workbook there.