Many more criteria were considered in Stage Three. [View a table that lists all the Stage Three criteria.] At the completion of the third stage, roughly 75 percent of the state's land area had been disqualified.
One of the new criteria introduced in Stage Three was slope. Analysts were concerned that precipitation runoff, which increases as slope increases, might increase the risk of surface water contamination should the LLRW facility spring a leak. CNSI's interim report (1994a) states that "[t]he disposal unit area which constitutes approximately 50 acres ... may not be located where there are slopes greater than 15 percent as mapped on U.S. Geological Survey (USGS) 7.5-minute quadrangles utilizing a scale of 1:24,000 ..." (p. 9).
Slope is change in terrain elevation over a given horizontal distance. It is often expressed as a percentage. A 15 percent slope changes at a rate of 15 feet of elevation for every 100 feet of horizontal distance. Slope can be measured directly on topographic maps. The closer the spacing of elevation contours, the greater the slope. CNSI's GIS subcontractors were able to identify areas with excessive slope on topographic maps using plastic templates called "land slope indicators" that showed the maximum allowable contour spacing.
Fortunately for the subcontractors, 7.5-minute USGS DEMs were available for 85 percent of the state (they're all available now). Several algorithms have been developed to calculate slope at each grid point of a DEM. As described in chapter 7, the simplest algorithm calculates slope at a grid point as a function of the elevations of the eight points that surround it to the north, northeast, east, southeast, and so on. CNSI's subcontractors used GIS software that incorporated such an algorithm to identify all grid points whose slopes were greater than 15 percent. The areas represented by these grid points were then made into a new digital map layer.
Try This!
You can create a slope map of the Bushkill PA quadrangle with Global Mapper (dlgv32 Pro) software.
- Launch Global Mapper.
- Open the file "bushkill_pa.dem" that you downloaded earlier (either the 10-meter or 30-meter version).
- Change from the default "HSV" shader to the "Slope" shader.
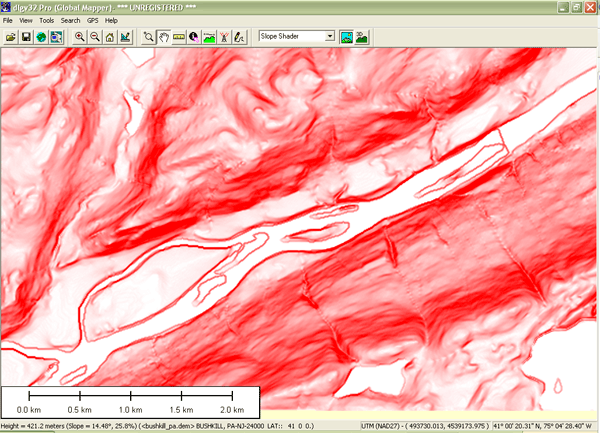
By default, pixels with 0 percent slope are lightest, and pixels with 30 percent slope or more are darkest. You can adjust this at Tools > Configure > Shader Options.
Notice that the slope symbolization does not change even as you change the vertical exaggeration of the DEM (Tools > Configure > Vertical Options).