Scale
There are two concepts of scale that are fundamental to Geography. Let’s talk first about scale as it pertains to maps. Map scale is the ratio of the distance on the map to the corresponding real distance on Earth. You’ll often see a bar drawn on a map that says 1 inch equals 10 miles, or something to that effect. This means that one inch of distance measured on the map can be considered equivalent to 10 miles of actual distance on the Earth. It’s common to see these equivalencies written in fractional form instead of plain English, e.g. 1:100 or 1/24000. These are called representative fractions.
You learned a bit in Lesson 1 about why it’s impossible to make perfect translations from the 3D Earth to 2D maps. This has an important impact on map scale. Depending on what map projection you’re using, your map scale will vary across your 2D map. This is another reason why map projections are important. Imagine if I gave you a paper map for a kayaking trip and I designed it using a projection that looked really cool but had scale varying wildly across the map (1 inch in the middle = 1 mile, 1 inch at the top = 50 miles). You might plan out your entire trip without realizing that you’re comparing completely different distances. That would be very mean of me to do, especially if there are lots of mosquitoes and you only brought one bag of beef jerky. At large scales (i.e. “zoomed in”), if you use a conformal projection, the differences in scale measurements are small enough to be insignificant for most users.
The second major concept of scale is a more general one. With Geography you have the power to explore and analyze phenomena at different levels of granularity. You could look at really large-scale (1:100) patterns in a neighborhood, or you could look at really small-scale (1:10,000,000) patterns across multiple countries. You did that last week in the lab assignment when you looked at Tapestry data at state, county, and finally neighborhood levels. At each scale the story you could tell totally changed, didn’t it? This kind of scale is often called the scale of analysis by Geographers, as opposed to the specific map scale that refers to how reality is directly translated by a map.
What About Time?
Geography requires space and spatial relationships in order to exist, but it also requires attention to time. Practically all geographic problems take place through some sort of dynamic process – meaning that things are changing from Day 1 to Day 100, for example. If you think about how most maps are made, this presents a problem, doesn’t it? How do you show changes over time? What if you don’t have data for every time step?
It’s outside the scope of this course to delve very deeply into this topic, but I want you to be aware of a couple of key examples so that you can understand the impact that time has on every map you read (and every map that you make).
I am still amazed that we can now poke around tons and tons of high-resolution satellite imagery to look at the Earth from above. Back in the old days when we had to yodel over the phone to connect to the internet, this kind of thing was a total pipe dream. Anyway, let’s do a little exploring right now to have a peek at how time is inextricably linked to Geography.
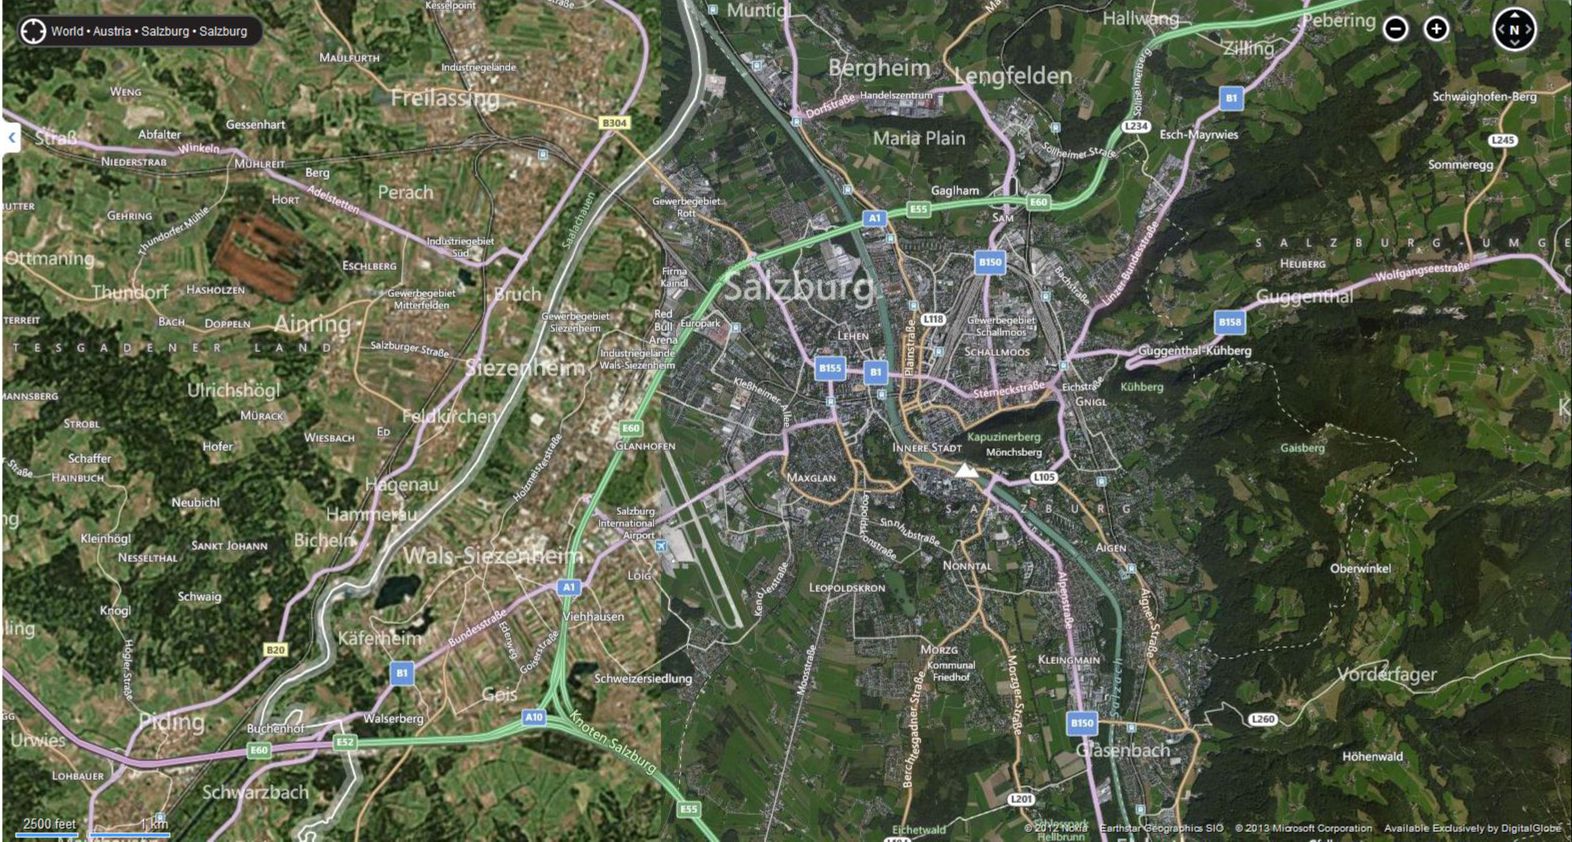
In the first example here, I’m playing around on Bing Maps to look at satellite imagery of Salzburg. My Grandmother was born in Salzburg, met my Grandfather there after the war, and a lot of my extended family lives there today. A summer afternoon on the rooftop at the Hotel Stein is an unforgettable experience if you ever have the opportunity. But I digress. Check out what’s happening on the west side of the city; see how it looks like two pictures have been abruptly slammed together?
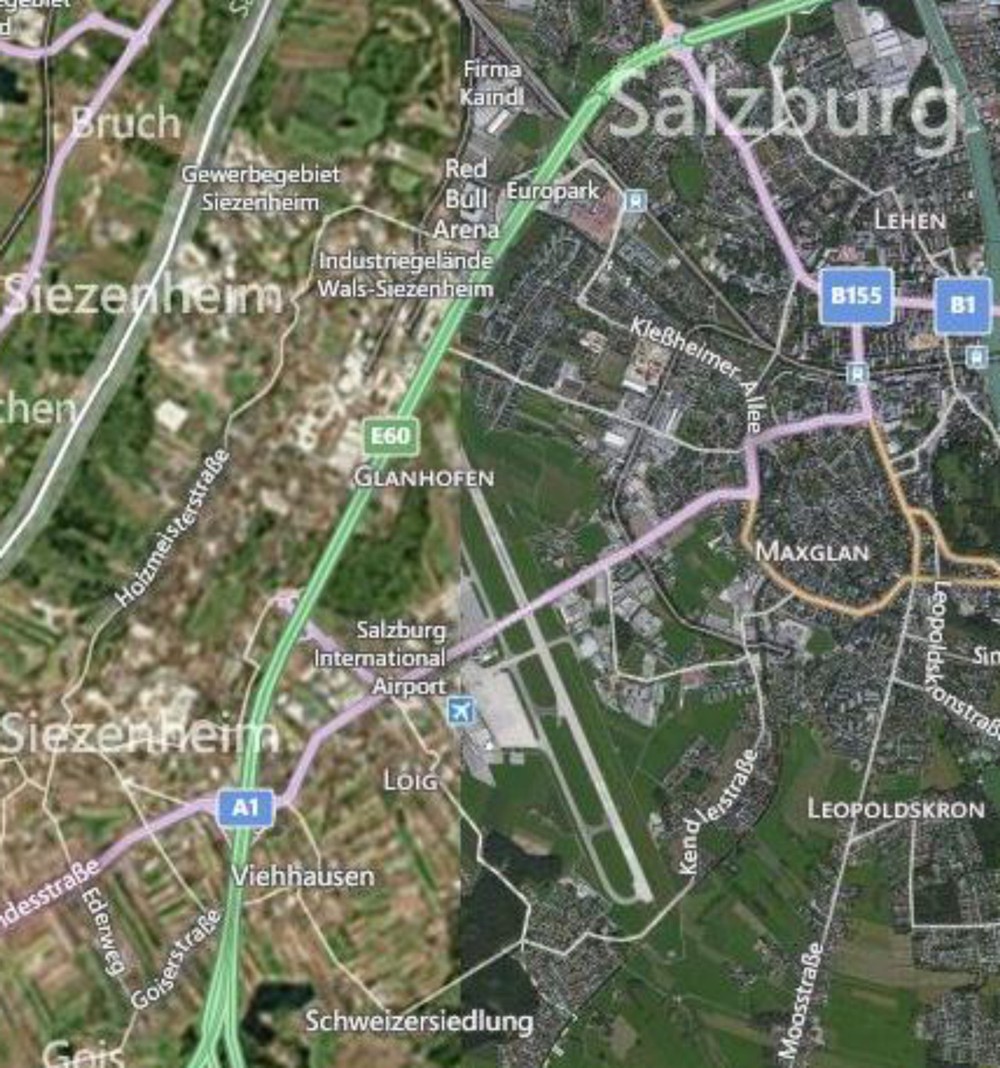
Furthermore, they’re of considerably different quality as well. The stuff on the west is blurry compared to the stuff on the east. So there’s a quality problem that’s immediately apparent, but there’s a bigger issue that you should always pay attention to – look at the lower right corner on any mapping service like this and you’ll see a copyright notice identifying who took the images and when they were copyrighted. In this case, there are two different sources cited from different times (2012 by Nokia and 2013 by Microsoft).
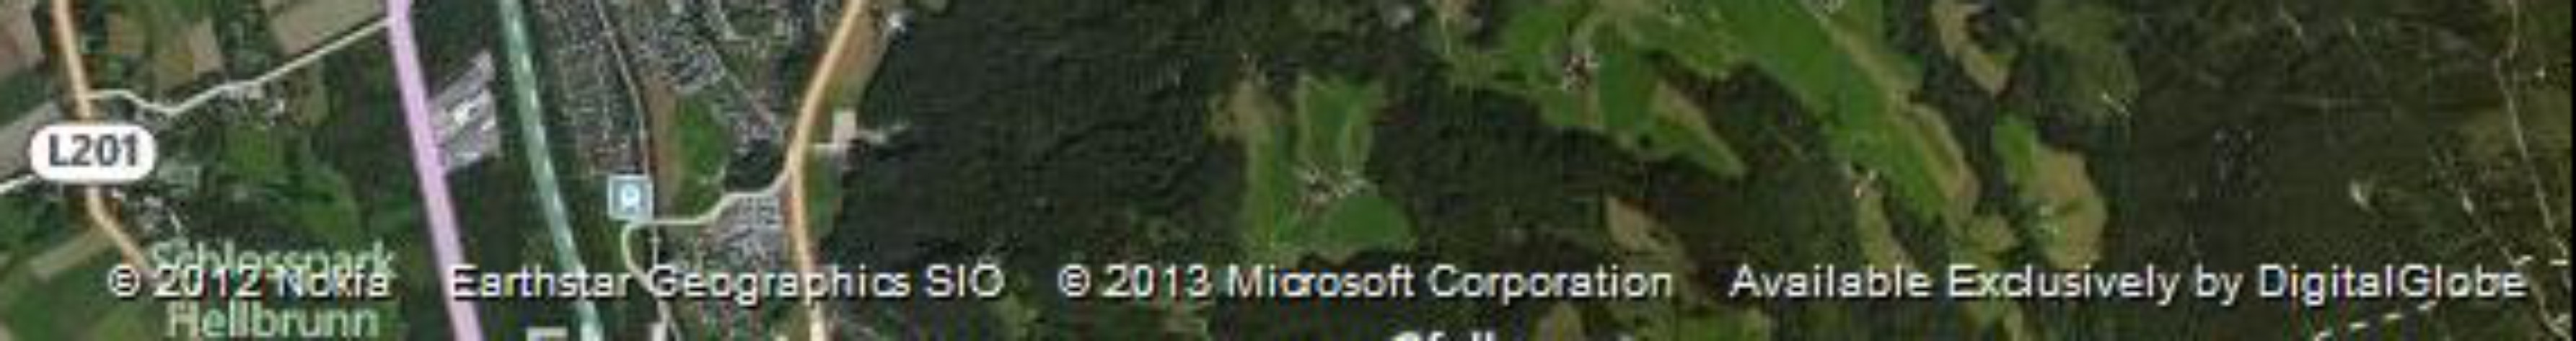
The images were taken at different times and from different sensors. This could be a good thing if you had complete coverage from both times and you wanted to look at changes happening to Salzburg, right? But it’s often the case that Geographers have exactly this sort of scenario where you have part of your data from one time and part from another, without any overlap at all. We don’t know when exactly in each year, but they could be taken during completely different seasons (which would explain some of the color differences), not to mention during different years.
The bottom line here is that time is an important factor to consider, and it’s rare to have perfect information covering every place you want to explore for every relevant time period. It doesn’t mean that you can’t make a useful map. Remember when you worked with demographic data in the Lesson 1 Mapping Assignment? All of that data was based on snapshots at particular times, and frequently you were mixing together measurements taken at one time with measurements taken at another. The Geospatial Revolution has brought us closer, but we’re still a really long way away from having real-time Geographic information about everything at every second.