Energy and Mineral Engineering
About the Author
Hi,

My name is Sarma Pisupati and I am your instructor for this course. I have been at Penn State for the past 26 years doing research and teaching courses related to Energy and Environment. Teaching is the most enjoyable part of my job at the University. I enjoy every minute and I promise that every one of you will get my full attention so that you can succeed in this course and your life.
My research interests are combustion and gasification of coal, pollution reduction from combustion processes, coal and biomass utilization and energy conservation. I have seven graduate students working with me on these topics towards their PhD and MS degrees.
You can visit my website [1] to see more about my activities.
Please do not hesitate to call me or email me if you have any questions!
Sarma Pisupati
Introduction and Checklist
Welcome to Lesson 4!
Lesson 4 deals particularly with Energy and the Environment. As I mentioned before in the unit overview, this lesson is divided into 3 parts. Part A is basically looking at the products that are formed when we burn fossil fuels and the environmental effects of these fossil fuels products.
In part B we are going to look at global effects, global warming. We will also look, in part C, at acid rain, and again, ozone layer destruction up above in the stratosphere. We'll also look at Ozone formation because of the chemicals that we emit -- the pollutants that we emit -- at the ground level and the fact that Ozone is formed at the ground level, where it is not supposed to be. Ozone is supposed to be in the stratosphere, which we are destroying by some of our actions, and where it is not supposed to be, we are forming it. So this lesson basically talks about some of those aspects.
Go through part A, part B, and part C; together there will be one quiz for this lesson. Your job is to complete all parts and do all the practice quizzes or study mate questions -- different activities. And then, actually, part of lesson 5 will also be included for your next exam. Although we call this a unit, it consists of only one lesson, so some of the next lesson will be included in the next exam.
Alright!
Lesson 4 Objectives
Upon completion of this lesson, you will be able to:
- Demonstrate a familiarity with fossil fuel composition
- Describe basic combustion chemistry
- Explain the quantitative implications of fossil fuel combustion
- State the health and environmental effects of products of combustion
- Describe the effects of primary and secondary pollutants
Checklist for Lesson 4
Here is your "to do" list for this lesson. There is a lot of reading for lesson 4 so I have given you more time to complete this lesson.
| Step | Activity | Access / Directions |
|---|---|---|
| 1 | Read |
|
| 2 | Watch | Lesson 4 - Guided Review (Flash movie). (A printable Review Sheet is also provided.) |
| 3 | Read | Lesson 4 - Questions for Review and Discussion |
| 4 | Review | Lesson 4 - Resources (supplemental materials that are optional...but informative!) |
| 5 | Complete | Lesson 4 - StudyMate Activities. (You will obtain feedback for these exercises, but they will not count toward your final course grade.) |
| 6 | Take | Lesson 4 - Quiz (graded) The quiz is available in Canvas. |
| 7 | Complete | Home Activity 2: Energy Usage and Analysis
|
See the Calendar tab in Canvas for due dates/times.
Questions?
If you have any questions, please post them to the Discussions tab located in Canvas. I will check that discussion forum daily to respond. While you are visiting the discussion board, feel free to post your own responses to questions posted by others - this way you might help a classmate!
Lesson 4a: Fossil Fuels and Products of Combustion
Introduction to Fossil Fuels and Products of Combustion
In the first lesson on the world and the U.S. energy supply, we clearly established that the dependence on fossil fuels is high (about 84 percent of the total energy), and this dependence is likely to increase in the next two decades.
In this section, we are going to look at what the fossil fuels are and the consequences when these fossil fuels are burnt.
As you may recall from an earlier lesson, these fuels, which we primarily depend on, were formed over millions of years by compression of organic material (plant and animal sources) prevented from decay and buried in the ground. They include:
- Coal
- Natural Gas
- Petroleum Oil
Fossil Fuel Elements
Fossil fuels are hydrocarbons comprised primarily of the following elements: carbon and hydrogen and some sulfur, nitrogen, oxygen, and mineral matter. Mineral matter turns into ash when burnt.
The composition and the amounts of these elements change for different fossil fuels (coal, petroleum, and natural gas), but the elements are the same. For example, there is more hydrogen in liquid fuels than in coal per unit mass.
Instructions: Click on the images of fossil fuels below to find out their compositions.
Combustion is rapid oxidation of the fossil fuel’s elements resulting in the generation of heat. When these elements oxidize (or combine with oxygen), products of combustion are formed.
Instructions: Click on each element shown in the piece of coal below to determine what products are formed from each during combustion.
Products of Combustion
Some of the fuel (hydrocarbon) may not completely burn during combustion and therefore is released into the atmosphere along with the products. The products that are formed during combustion of fossil fuels are shown in the image below:
Long Description of the Products of Combustion image. [4]
We will now look at six products of combustion:
- Carbon Dioxide
- Carbon Monoxide
- Sulfur Dioxide
- Nitrogen Oxides
- Lead
- Particulate Matter
Carbon Dioxide (CO2)
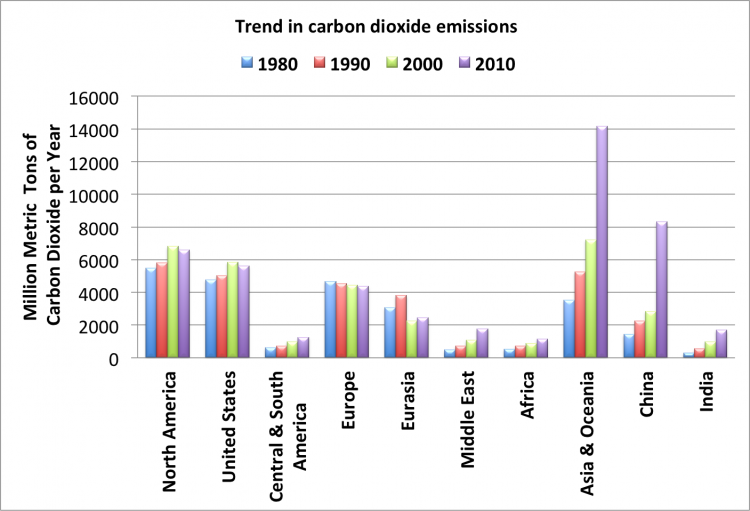
Carbon dioxide is the principal product of combustion of fossil fuels since carbon accounts for 60–90 percent of the mass of fuels that we burn.
China has emerged as the largest single emitter of energy related CO2 emissions, reaching an all-time high of 8320 million metric tons of carbon dioxide in 2010. The United States emitted about 5610 million metric tons in 2010. The chart below shows the trend in carbon dioxide emission from 1980. Asia and Oceania, particularly China and India emission can be seen to increase significantly in the past two decades.
Each of the end sectors (users) and their contribution (percent) to the overall CO2 emissions is shown in the table below.
| Sources | Residential | Commercial | Industrial | Transportation | Electric Power | Source Total |
|---|---|---|---|---|---|---|
| Coal | 1 | 5 | 151 | 0 | 1,718 | 1,874 |
| Natural Gas | 256 | 171 | 419 | 39 | 411 | 1,296 |
| Petroleum | 78 | 49 | 345 | 1,802 | 25 | 2,299 |
| Other | 11 | 11 | ||||
| Electricity | 827 | 767 | 567 | 4 | ||
| Sector Total | 1,162 | 992 | 1,482 | 1,845 | 2,166 | 5,481 |
1= preliminary data
Data was pulled from the US Energy Information Administration

In 2010, 41.9 percent of U.S. fossil-fuel emissions came from the consumption of petroleum products, and coal usage accounted for 35.4 percent of U.S. fossil-fuel CO2 emissions. About 22.5 percent of the CO2 emissions were a result of natural gas use.
Carbon Monoxide (CO)
Carbon monoxide, or CO, is a colorless, odorless gas that is formed when carbon in fuel is not burned completely. The figure below shows the contribution of various sources to the emissions of CO:
Carbon Monoxide is a component of motor vehicle exhaust, which contributes about 55 percent of all CO emissions nationwide. Other non-road engines and vehicles (such as construction equipment and boats) contribute about 22 percent of all CO emissions nationwide. Higher levels of CO generally occur in areas with heavy traffic congestion. In cities, 85 to 95 percent of all CO emissions may come from motor vehicle exhaust.
Other sources of CO emissions include industrial processes (such as metals processing and chemical manufacturing), residential wood burning, as well as natural sources such as forest fires. Woodstoves, gas stoves, cigarette smoke, and unvented gas and kerosene space heaters are sources of CO indoors.
The highest levels of CO in the outside air typically occur during the colder months of the year when inversion conditions are more frequent. An inversion is an atmospheric condition that occurs when the air pollutants are trapped near the ground beneath a layer of warm air.
Sulfur Dioxide (SO2)
Sulfur dioxide, or SO2, belongs to the family of sulfur oxide gases (SOx). These gases dissolve easily in water. Sulfur is prevalent in all raw materials, including crude oil, coal, and ores that contain common metals, such as aluminum, copper, zinc, lead, and iron.
SOx gases are formed when fuel containing sulfur, such as coal and oil, is burned, and when gasoline is extracted from oil, or metals are extracted from ore. SO2 dissolves in water vapor to form acid and interacts with other gases and particles in the air to form sulfates and other products that can be harmful to people and their environment.
Nitrogen Oxides (NOx)
Nitrogen oxides, or NOx, is the generic term for a group of highly reactive gases, all of which contain nitrogen and oxygen in varying amounts. Many of the nitrogen oxides are colorless and odorless.
Nitrogen oxides form when fuel is burned at high temperatures, as in a combustion process. The primary sources of NOx are motor vehicles, electric utilities, and other industrial, commercial, and residential sources that burn fuels as shown in the figure below.
Although many of the nitrogen oxides are colorless and odorless, one common pollutant, nitrogen dioxide (NO2) along with particles in the air can often be seen as a reddish-brown layer over many urban areas.

Lead (Pb)
The major sources of lead emissions have historically been motor vehicles (such as cars and trucks) and industrial sources.
Due to the phase-out of leaded gasoline, metals processing is the major source of lead emissions to the air today. The highest levels of lead in air are generally found near lead smelters (devices that process lead ores). Other stationary sources are waste incinerators, utilities, and lead-acid battery manufacturers.

Lead is used in the manufacturing of many items, including glass, rubber, paint, batteries, insecticides, plumbing and protective shielding for X-rays.
Particulate Matter (PM)
Particulate matter (PM) is the general term used to describe a mixture of solid particles and liquid droplets found in the air. Some particles are large enough to be seen as dust or dirt. Others are so small they can be detected only with an electron microscope.
Different sizes of Particles include:
- PM 2.5 describes the “fine” particles that are less than or equal to 2.5 µm (micro meter) in diameter.
- “Coarse fraction” particles are greater than 2.5 µm, but less than or equal to 10 µm in diameter.
- PM 10 refers to all particles less than or equal to 10 µm in diameter (about one-seventh the diameter of a human hair). PM can be emitted directly or formed in the atmosphere.
Different Sources of Particles include:
- "Primary" particles are formed from combustion sources and are emitted directly into the atmosphere. Examples of primary particles are dust from roads or black carbon (soot).
- "Secondary" particles are formed in the atmosphere from primary gaseous emissions. Examples of secondary particles are sulfates formed from SO2 emissions from power plants and industrial facilities; nitrates formed from NOx emissions from power plants, automobiles, and other combustion sources; and carbon formed from organic gas emissions from automobiles and industrial facilities.
The chemical composition of PM depends on location, time of year, and weather. Generally, primary particles make up coarse PM and secondary particles make up most of fine PM.
Health and Environmental Effects of Primary Pollutants
The pollutants that are emitted directly from a combustion process – or the products of combustion - are called “primary pollutants.” We just described these products earlier in the lesson, now we will look at their impact on the environment and human health.
Carbon Dioxide (CO2)
Carbon dioxide (CO2) is not a pollutant that would harm our health but it is a proven greenhouse gas. It has an ability to absorb infrared radiation that is escaping from the surface of the earth causing the atmosphere to warm up. Excessive emission of CO2 along with other greenhouse gases is thought to contribute to the undesirable climate change.
Carbon Monoxide (CO)
As we learned earlier, Carbon monoxide, or CO, is a colorless, odorless and tasteless gas that is formed when carbon in fuel is not burned completely.
At much higher levels of exposure not commonly found in ambient air, CO can be poisonous, and even healthy individuals can be affected. Exposure to elevated levels of CO may result in:
- visual impairment;
- reduced work capacity;
- reduced manual dexterity;
- poor learning ability;
- difficulty in performing complex tasks.
The health threat from levels of CO sometimes found in the ambient air is most serious for those who suffer from cardiovascular disease such as angina pectoris.
In the human body, Hemoglobin (an iron compound) in the blood carries the oxygen (O20) from the lungs to various tissues and transports back carbon dioxide (CO2) to the lungs. Hemoglobin has 240 times more affinity toward CO than it does for oxygen. Therefore, when the hemoglobin reacts with CO, it reduces the hemoglobin that is available for the transport of O2. This in turn reduces oxygen supply to the body's organs and tissues.
Sulfur Dioxide (SO2)
High concentrations of SO2 can result in the following health problems:
Short-term exposure
- Adults and children with asthma who are active outdoors will experience temporary breathing impairment.
- Individuals with asthma may experience breathing difficulties with moderate activity and may exhibit symptoms such as wheezing, chest tightness, or shortness of breath.
Long-term exposure (along with high levels of PM)
- Aggravation of existing cardiovascular disease
- Respiratory illness
- Alterations in the lungs’ defenses
The subgroups of the population that may be affected under these conditions include individuals with heart or lung disease, as well as the elderly and children.
The body's reaction to regular and acidic air
Instructions: Click on the types of air and observe what happens for each.
Together, SO2 and NOx (discussed on the next page) are the major precursors to acidic deposition (acid rain), which is associated with the acidification of soils, lakes, and streams and accelerated corrosion of buildings and monuments. We will talk more about this in the next section. SO2 also is a major precursor to PM 2.5, which is a significant health concern, and a main contributor to poor visibility.
Health and Environmental Effects of Primary Pollutants, page 2
Nitrogen Oxides (NOx)
Nitric oxide (NO) and nitrogen dioxide (NO2) together are represented by NOx. Most of the emissions from combustion devices (approximately 90%) are in the form of NO.
NOx react in the air to form ground-level ozone and fine particulates, which are associated with adverse health effects.
- Short-term exposures (e.g., less than 3 hours) to low levels of NO2 may lead to changes in airway responsiveness and lung function in individuals with preexisting respiratory illnesses. These exposures may also increase respiratory illnesses in children.
- Long-term exposures to NO2 may lead to increased susceptibility to respiratory infection and may cause irreversible alterations in lung structure.
NOx contributes to a wide range of environmental effects directly and when combined with other precursors in acid rain and ozone.
- Increased nitrogen inputs to terrestrial and wetland systems can lead to changes in plant species composition and diversity.
- Direct nitrogen inputs to aquatic ecosystems such as those found in estuarine and coastal waters (e.g., Chesapeake Bay) can lead to eutrophication (a condition that promotes excessive algae growth, which can lead to a severe depletion of dissolved oxygen and increased levels of toxins harmful to aquatic life).
- Nitrogen, alone or in acid rain, also can acidify soils and surface waters.
Acid rain can ruin a fishing trip!
Acidification of soils causes the loss of essential plant nutrients and increased levels of soluble aluminum that are toxic to plants. Acidification of surface waters creates conditions of low pH and levels of aluminum that are toxic to fish and other aquatic organisms. NOx also contributes to visibility impairment.
Particulate Matter (PM)
Particles smaller than or equal to 10 µm (micro meter or millionth of a meter) in diameter can get into the lungs and can cause numerous health problems. Inhalation of these tiny particles has been linked with illness and death from heart and lung disease. Various health problems have been associated with long-term (e.g., multi-year) exposures to these particles. Shorter-term daily and potentially even shorter term peak (e.g., 1-hour) exposures to these particles can also be associated with health problems.
Particles can aggravate respiratory conditions, such as asthma and bronchitis, and have been associated with cardiac arrhythmias (heartbeat irregularities) and heart attacks. People with heart or lung disease, the elderly, and children are at highest risk from exposure to particles.
Particles of concern can include both fine and coarse-fraction particles, although fine particles have been more clearly linked to the most serious health effects.
- Particles larger than 2 micro meters (µm) do not penetrate beyond the nasal cavity or trachea.
- Particles smaller than 0.1 µm tend to deposit in tracheobronchia tree and are removed when exhaling.
- Particles between 0.1 and 2.0 µm penetrate deep into the lungs and settle in respiratory bronchioles or alveolar sacs
In addition to health problems, PM is the major cause of reduced visibility in many parts of the United States by scattering and absorbing some of the light emitted or reflected by the body reducing the contrast. Airborne particles can also impact vegetation and ecosystems, and can cause damage to paints and building materials.
How particulate matter is breathed into the human body
Instructions: Click the name of each size of particulate matter and observe what happens for each.
Lead
Exposure to lead occurs mainly through inhalation of air and ingestion of lead in food, water, soil, or dust. It accumulates in the blood, bones, and soft tissues and can adversely affect the kidneys, liver, nervous system, and other organs.
- Excessive exposure to lead may cause neurological impairments such as seizures, mental retardation, and behavioral disorders.
- Even at low doses, lead exposure is associated with damage to the nervous systems of fetuses and young children, resulting in learning deficits and lowered IQ.
- Recent studies indicated that lead may be a factor in high blood pressure and subsequent heart disease.
- Lead can also be deposited on the leaves of plants, presenting a hazard to grazing animals and to humans through ingestion.
Instructions: Click the "start" button to see the impact of using unleaded rather than leaded gasoline.
Secondary Pollutants
The pollutants that are emitted directly from a combustion process are called “primary pollutants.” When emitted into the atmosphere, these primary pollutants combine with other reactants and form “secondary” pollutants.
An example of a secondary pollutant would be ozone. When hydrocarbons are emitted and they react with NOx in presence of sunlight, they form ozone. Health and environmental effects of secondary pollutants are discussed in the next section: Global and Regional Effects of Pollutants.
Lesson 4b: Global and Regional Effects of Secondary Pollutants
Introduction to Global and Regional Effects of Secondary Pollutants
The Earth is continuously receiving energy from the sun. Energy also leaves the Earth in the nighttime (of course in the form of invisible infrared energy!). Otherwise, the Earth would be continuously warming up. This delicate balance between the energy coming in and leaving due to natural greenhouse effect is what keeps the planet warm enough for us to live on.
It is very obvious that if more energy comes in than the energy that leaves, the planet will become warm. Similarly, if the energy that leaves is more than the energy that comes in, the planet will become cool. The atmospheric temperature fluctuates over centuries due to certain natural causes.
Go to the next screen to view an animation of the greenhouse effect.
Greenhouse Effect
In the first lesson, we saw that energy can be transformed from one form to another, and during this conversion, all the energy that we put into a device comes out. However, all the energy that we put in may not come out in the desired form. Please watch the following 4:17 presentation:
This diagram explains to us about the greenhouse effect. Basically what greenhouse effect is, is the sun, which emits mostly long radiation and shortwave radiation, all this radiation comes in in the morning or during daytime without any problem. The atmosphere, which has various kinds of gases like oxygen, nitrogen, little bit of carbon dioxide, et cetera, these radiations basically pass through. And the solar radiation, part of it actually gets reflected back out into the space from these clouds. Whatever reaches the Earth, here down below, part of it heats up the atmosphere or the Earth's surface, some of it is used for growing plants, some of it evaporates waters and runs the hydrological cycle. And during nighttime, all this energy that has come in during daytime generally will go back into the space as longwave radiation, which is infrared radiation. So it comes in shortwave and longwave, but all of it tries to go back or will go back in longwave radiation. Now, the gases, like CO2, in the atmosphere generally have the unique capability to trap this infrared radiation that is going out. And these gases absorb the infrared radiation, keeping a part of the radiation that would've otherwise gone out within the atmosphere. So this is called greenhouse effect, and due to this effect, because of these gases, the atmosphere right now is at an average temperature of 59 degrees Fahrenheit. Without this effect, for example if there was no CO2 in the atmosphere, no greenhouse gases, it's totally of oxygen and nitrogen, all the energy that would come in in the daytime if it had gone out in the nighttime, the Earth would be freezing at 0 degrees Fahrenheit. So at this temperature, nothing can grow on this planet, and the planet would be uninhabitable. So this greenhouse effect is what is turning this planet into a habitable planet by keeping the average temperature at about 59 degrees Fahrenheit. This temperature is the temperature that we normally see averaged over entire year at all places, including North Pole, South Pole, equator, day, night, various seasons, et cetera. So greenhouse effect is what is actually making this planet habitable by warming up little bit. Unfortunately, if we emit more and more greenhouse gases into the atmosphere like what we have been doing-- the CO2 concentration has gone up from 275 parts per million to now about 370 parts per million--if we keep on doing these kinds of things, more and more thermal energy will be trapped inside the atmosphere, and this 59 degrees temperature is likely to increase. And that's what we call global warming, or climate change, or increase in this temperature is detrimental. So the question is whether we should blame greenhouse effect for this or global warming as a bad phenomenon.
Current levels of CO2 in the atmosphere - 392 ppm in 2011. (Data shown in Excel Sheet)
Greenhouse Gases
Based on the animation of the Greenhouse Effect on the previous screen, respond to the question below:
The concentration of greenhouse gases in the atmosphere has been changing over the past 150 years. Since pre-industrial times atmospheric concentrations of the gases have increased:
- CO2 has climbed over 31 percent.
- CH4 has climbed over 151 percent.
- N2O has climbed 17 percent.
Scientists have confirmed that this is primarily due to human activities, which include burning coal, oil, and gas, and cutting down forests.

Check this out!
Instructions: Click on the greenhouse gas in the left column below to see:
- What percentage of that gas accounts for the total greenhouse emissions in the United States.
- Its source of emission
As you can see, energy related CO2 and CH4 accounts for 90 percent of the total greenhouse gas emissions in the United States. This highlights the impact of energy use on the environment.
How Has CO2 Concentration Changed?
The table below shows the change in greenhouse gas concentration between Pre-Industrial times and 2010, as well as the Atmospheric Lifetime and Global Warming Potential.
| Greenhouse Gases | Pre-Industrial Concentration (PPBV) | Concentration (2010 (PPBV) | Atmospheric Lifetime (years) | Global Warming Potential (GWP) |
|---|---|---|---|---|
| Carbon dioxide (CO2) | 278,000 | 390,000* | Variable | 1 |
| Methane (CH4 | 715 | 1810.5 | 12 | 25 |
| Nitrous oxide (N2O) | 270 | 322.5 | 114 | 298 |
| CFC-12 | 0 | 0.533 | 100 | 10900 |
| HCFC-22 | 0 | 0.208 | 12 | 1810 |
| Perfluoromethane (CF4)** | 0 | 0.07 | 50,000 | 6,500 |
| Sulfur hexa-floride (SF6) | 0 | 0.007 | 3,200 | 22,800 |
*Recent CO2 concentration (390.5 ppm) is the 2011 average taken from globally averaged marine surface data given by the National Oceanic and Atmospheric Administration Earth System Research Laboratory.
**2005 data
Source: CDIAC.org [16]
Atmospheric lifetime is the period of time during which a gas changes and is either transformed or removed from the atmosphere.
GWP is an index defined as the cumulative radiative forcing (infrared radiation absorption) between the present and some chosen time horizon caused by a unit mass of gas emitted now, expressed relative to a reference gas such as CO2, as is used here. GWP is an attempt to provide a simple measure of the relative radiative effects of different greenhouse gases.
Try This!
Instructions: In the graph below, observe how CO2 concentration in the atmosphere has changed over the past 50 years. Based on your observations, answer the questions that follow.
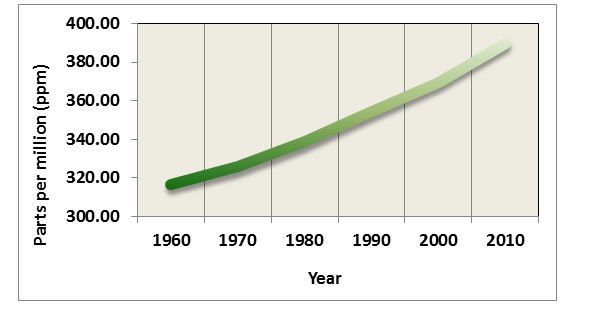
Data from the graph above was obtained from ice core samples of trapped air. More specifically, ice in the Polar Regions traps air from that particular time period, and then new ice is deposited over the previously deposited ice, trapping more air from the past. Thus, the analysis of ice core samples provides the composition of past air, which can be used to determine the past temperatures.
The increase in the greenhouse gases between 1950 and 2010 is believed to have caused an increase in the global temperature. The mean increase in the global temperature over the past one century is about 1 degree Fahrenheit.
Instructions: Review the graph below, showing the Annual mean for the Global surface temperature between years 1960 and 2010. The annual mean will show the detailed fluctuations.
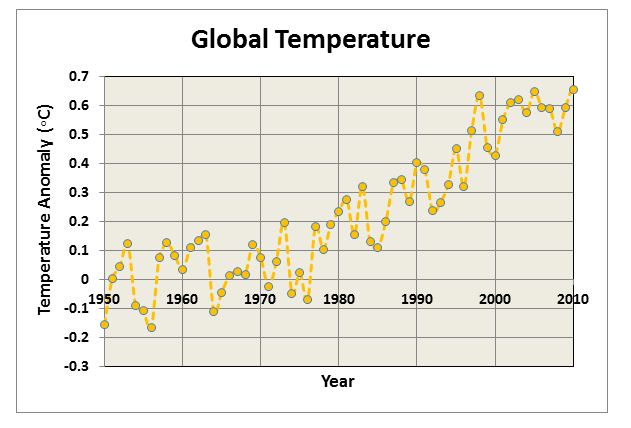

Since 1880, about when the industrial age first started, the average increase in global temperature has been 1 degree Fahrenheit.
Not only has there been an increase in temperatures with the increase of greenhouse gasses, there has also been an increase in CO2 emissions from fossil fuels – this has been apparent over the last 150 years (since about 1850).
The graph below depicts data from ice core samples showing temperature and CO2 concentrations in the atmosphere from 400,000 years ago to about the year 2000.
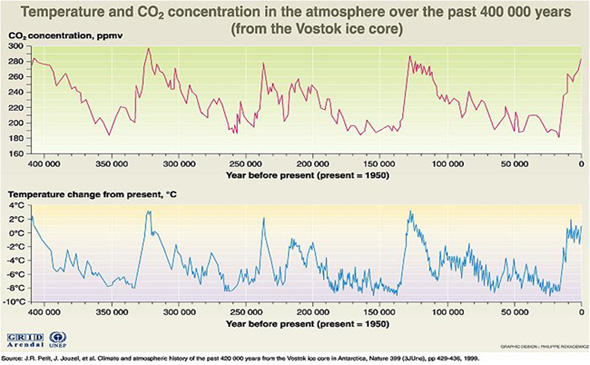
Based on the graph above, it can be determined that during periods of time where there was no human activity:
- The average global temperature increase was 2 degrees Celsius or 4 degrees Fahrenheit.
- The average temperature decrease was 8 degrees Celsius or 17 degrees Fahrenheit.
CO2 and Temperature Fluctuations
Unanswered Question
We have seen that there have been fluctuations in both temperature and CO2 emissions in the past 400,000 years. This leads to an important question:
- Did the atmospheric CO2 concentrations and temperatures change prior to the pre-industrial period or only after it?
Or more specifically:
- If we attribute the mean global temperature increase of 1ºF over the past century to human activities, how do we explain the mean global temperature fluctuations between +4ºF to -17ºF that occurred thousands of years ago, when there was no human activity?
Possible Answer
Some argue that temperature change is natural and cyclical. Thus, since it is cyclical, we, the humans, might not be influencing the current change in the climate.
The most important difference between now and then that we have to keep in mind is the human species. More than six billion people live on this planet now, who were not there during those earlier natural temperature cycles, and any chances that jeopardize the existence of this humankind must be taken seriously. The reasons for concern are discussed next.
More than 6 billion people live on this planet now who were not here during the earlier natural temperature cycles, and any chances that jeopardize the existence (land and food supply) of this humankind must be taken seriously.
The significant temperature fluctuations shown in the earlier graph of the ice core samples led to the glacial and inter-glacial ice ages. The temperature increase over the last 150 years, however, is not significant compared to the changes in the past known history. Let’s take a closer examination of the CO2 profile.
Instructions: Click on the buttons below to graph and compare CO2 and temperature on one graph, and then respond to the question that follows:
From the graph above, we know that CO2 concentration did not rise above 310 ppmv at any time from 400,000 years ago to the year 1950, even though the temperatures continued to increase. Based on this information, we can conclude that this increase is something that the atmosphere did not experience earlier, which means that the increase is the result of human activity.
Now let’s look at how CO2 concentration and temperature have changed in the last 50 years, since 1960.

Based on your observations of the above graph, reflect on the questions discussed below:
- In the past, 310 ppm of CO2 increased the temperature by about 4 degrees F, so how do you think the current CO2 concentration of 370 ppm is impacting the temperature?
- How long will it take for the temperature to come to a level that corresponds to the CO2 concentration of 370 ppm? Or are we already there?
- What will the consequences be if the concentration of CO2 increases to 550 ppm (double the pre-industrial concentration), or even to 70 ppm (both of which are proposed to be likely scenarios with the increased fossil fuel consumption?)
If the temperature already reached the maximum temperature corresponding to 370 ppm, then some other factors are cooling the planet that were absent in the previous cycles.
Now, let’s examine the reasons or causes for the natural fluctuations.
Global Warming
The sun is the main source of energy and, as we discussed earlier, it is the net balance between the incoming solar energy and the outgoing energy that causes the temperature changes.
The Earth is continuously moving around the sun. Based on its position, the incoming energy changes. The Earth’s axis of rotation is tilted at an angle of 23.5°, and this tilt goes from one side to the other and back over in 40,000-year cycles. Earth’s axis of rotation takes about 21,000 years to complete a cycle.
Instructions: Click the play button below to view the earth’s movement around the sun.
The Earth’s orbit around the sun changes from a circular path to an elliptical path and back to a circular path over 100,000 years. These are long-term changes. On a much shorter term, the radiation from the sun can be affected by the activity on the surface of the sun. Sun spots (intense flares on the surface) can increase the radiation from the sun. The increase in the solar activity occurs over an 11-year cycle.
Like many fields of scientific study, there are uncertainties associated with the science of global warming. This does not imply that all things are equally uncertain. Some aspects of the science are based on well-known physical laws and documented trends, while other aspects range from 'near certainty' to 'big unknowns.'
On the following pages, we will discuss the following:
- What is known for certain? Human activities change the Earth's Atmosphere.
- What is likely? Greenhouse gases contribute to global warming. Several factors impact temperature (clouds, fine particles, oceans). Global Warming affects health, water resources, polar regions, coastal zones and forests.
- What is uncertain? The long term effects of global warming, especially for smaller areas.
What is Known for Certain
Human activities change the earth's atmosphere.
Scientists know for certain that human activities are changing the composition of Earth's atmosphere. Increasing levels of greenhouse gases in the atmosphere, like carbon dioxide (CO2), have been well documented since pre-industrial times. There is no doubt this atmospheric buildup of carbon dioxide and other greenhouse gases is largely the result of human activities.
It's well accepted by scientists that greenhouse gases trap heat in the Earth's atmosphere and tend to warm the planet. By increasing the levels of greenhouse gases in the atmosphere, human activities are strengthening Earth's natural greenhouse effect. The key greenhouse gases emitted by human activities remain in the atmosphere for periods ranging from decades to centuries.
A warming trend of about 1oF has been recorded since the late 19th century. Warming has occurred in both the northern and southern hemispheres, and over the oceans. Confirmation of twentieth-century global warming is further substantiated by melting glaciers, decreased snow cover in the northern hemisphere, and even warming below ground.
What is Likely but Uncertain: Greenhouse Gases Contribute to Global Warming
Greenhouse gases contribute to global warming.
Determining to what extent the human-induced accumulation of greenhouse gases since pre-industrial times is responsible for the global warming trend is not easy. This is because other factors, both natural and human, affect our planet's temperature. Scientific understanding of these other factors—most notably natural climatic variations, changes in the sun's energy, and the cooling effects of pollutant aerosols—remains incomplete or uncertain; however…
- The Intergovernmental Panel on Climate Change (IPCC) stated there was a "discernible" human influence on climate; and that the observed warming trend is "unlikely to be entirely natural in origin."
- In the most recent Third Assessment Report (2001), IPCC wrote "There is new and stronger evidence that most of the warming observed over the last 50 years is attributable to human activities."
In short, scientists think rising levels of greenhouse gases in the atmosphere are contributing to global warming, as would be expected; but to what extent is difficult to determine at the present time.
As atmospheric levels of greenhouse gases continue to rise, scientists estimate average global temperatures will continue to rise as a result. By how much and how fast remain uncertain. IPCC projects further global warming of 2.2 - 10oF (1.4 - 5.8oC) by the year 2100.
What is Likely but Uncertain: Factors Affecting Temperature
Some factors that affect the Earth's temperatures include clouds, fine particles, and oceans.
Clouds
- Low, thick clouds primarily reflect solar radiation and cool the surface of the Earth.
- High, thin clouds primarily transmit incoming solar radiation; at the same time, they trap some of the outgoing infrared radiation emitted by the Earth and radiate it back downward, thereby warming the surface of the Earth.
- Whether a given cloud will heat or cool the surface depends on several factors, including the cloud's height, its size, and the make-up of the particles that form the cloud.
- The balance between the cooling and warming actions of clouds is very close - although, overall, cooling predominates.
Fine Particles (aerosols) in the atmosphere
The amount of fine particles or aerosols in the air has a direct effect on the amount of solar radiation hitting the Earth's surface. Aerosols may have significant local or regional impact on temperature.
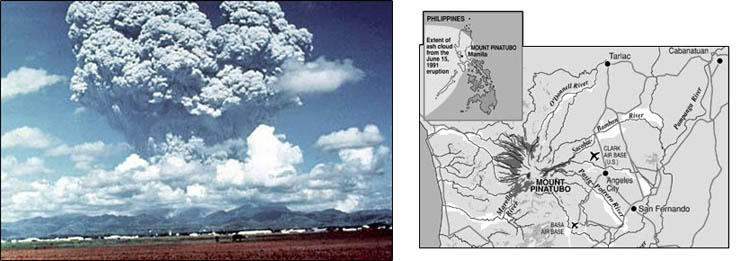
Atmospheric factors shown in the image below include natural factors such as clouds, volcanic eruptions, natural biomass (forest) burning, and dust from storms. In addition, human-induced factors such as biomass burning (forest and agricultural fires) and sulfate aerosols from burning coal add tiny particles that contribute to cooling. Please watch the following 2:41 presentation: "The Cooling Factors."
There are several factors that have an influence on the earth's climatic change. Some of these happen to be clouds, fine particles, et cetera. Low, thick clouds primarily reflect solar radiation and cool the surface of the earth. High, thin clouds primarily transmit incoming solar radiation. At the same time, they trap some of the outgoing infrared radiation emitted by the earth's surface and radiate it back downward, thereby warming the surface of the earth. Whether a given cloud will heat or cool the surface depends on several factors, including the cloud's height, size, and the make of the particles that form the cloud. there in the atmosphere also change. As we talked about, the fine particles are coming into the atmosphere from volcanic eruptions, for example, or biomass burning, including natural forest fires, and also dust from the storms, sandstorms, et cetera. And we have very fine sulfate aerosols from burning coal and oil that come into the atmosphere. And these fine particles sometimes contribute to cooling. This is well known. For example, when Mount Pinatubo erupted in Philippines in 1991, there were a lot of fine particles that were spewed into the atmosphere which covered the surface, and it caused, basically, cooling. So again, at this point we do not know exactly how these factors will affect in future. Forest fires release carbon dioxide into the atmosphere, and, as we all know, carbon dioxide traps heat. And volcanic eruptions, these particles can cool sometimes-- oceans, clouds. And prediction of these kinds of things for future is a difficult task, and that is the reason predicting what is likely to happen is not so certain at this point in time.
When Mount Pinatubo erupted in the Philippines in 1991, an estimated 20 million tons of sulfur dioxide and ash particles blasted more than 12 miles high into the atmosphere. The eruption caused widespread destruction and human causalities. Gases and solids injected into the stratosphere circled the globe for three weeks.
Volcanic eruptions of this magnitude can impact global climate, reducing the amount of solar radiation reaching the Earth's surface, lowering temperatures in the troposphere, and changing atmospheric circulation patterns. The extent to which this occurs is an uncertainty.
Below is a picture of Mount Pinatubo next to a map of its location and how far the ash from its eruption spread.
Water vapor is a greenhouse gas, but at the same time, the upper white surface of clouds reflects solar radiation back into space. Albedo—reflections of solar radiation from surfaces on the Earth—creates difficulties in exact calculations. If, for example, the polar icecap melts, the albedo will be significantly reduced. Open water absorbs heat, while white ice and snow reflect it.
Oceans
Oceans play a vital role in the energy balance of the Earth. It is known that the top 10 feet of the oceans can hold as much of the heat as the entire atmosphere above the surface. However, most of the incoming energy is incident on the equatorial region.
The water in the oceans in the equatorial regions is warmer and needs to be transported to the northern latitudes. This is done due to natural variations in the temperatures of the water and prevailing winds that cause the disturbances in the surface waters.
The Intergovernmental Panel on Climate Change (IPCC) states that even the low end of this warming projection "would probably be greater than any seen in the last 10,000 years, but the actual annual to decadal changes would include considerable natural variability."
Instructions: Click the play button to learn about the Ocean Conveyor Belt in the 2:52 presentation:
Oceans play a vital role in the energy balance of the earth. It is established that the top 10 feet of the oceans, which is roughly 3 meters, can hold as much of the heat as the entire atmosphere above the surface. However, most of the incoming energy is incident in the equatorial regions where the water gets warmer. And the water in these regions is much, much warmer compared to the water near the polar regions. And this warm water in the equatorial region needs to be transported to the northern latitudes. And this upper-layer water is not so rich in nutrients, whereas under the ocean it is rich in nutrients. Generally, this transportation is done due to natural variations in the temperature of the water, prevailing winds that cause the disturbances in the surface waters. The cold and dense water, from the polar regions basically, flows into the ocean, sinks to the bottom, and, pushing the warm waters from the surface, move towards the, again, northern latitudes. So this basically establishes a kind of oceanic conveyor belt. Warm, salty water is chilled when it is sinking in the northern Atlantic and it flows southwards towards Antarctica. And this is cooled further at the bottom of the oceans into Atlantic, Indian, and Pacific basins. The water returns to the surface, again primarily in Pacific and Indian Oceans, and again it comes back to the surface and goes to the northern Atlantic. While traveling deep in the ocean, the originally nutrient-depleted water becomes increasingly enriched by organic matter decomposition in the important nutrients, particularly phosphates, nitrates, and silicates. And that's how this is a very, very important process here in transporting the CO2 and the heat that is available to the surface water. So this oceanic conveyor belt plays a very important role in the heat distribution.
What is Likely but Uncertain: Impact of Global Warming
Impact of Global Warming on such things as health, water resources, polar regions, coastal zones, and forests is likely but it is uncertain to what extent.
Health
The most direct effect of climate change would be the impacts of the hotter temperatures, themselves. Extremely hot temperatures increase the number of people who die on a given day for many reasons:
- People with heart problems are vulnerable because one's cardiovascular system must work harder to keep the body cool during hot weather.
- Heat exhaustion and some respiratory problems increase.
- Higher air temperatures also increase the concentration of ozone at ground level.
- Diseases that are spread by mosquitoes and other insects could become more prevalent if warmer temperatures enabled those insects to become established farther north; such "vector-borne" diseases include malaria, dengue fever, yellow fever, and encephalitis.
Water Resources
Changing climate is expected to increase both evaporation and precipitation in most areas of the United States. In those areas where evaporation increases more than precipitation, soil will become drier, lake levels will drop, and rivers will carry less water. Lower river flows and lower lake levels could impair navigation, hydroelectric power generation, and water quality, and reduce the supplies of water available for agricultural, residential, and industrial uses. Some areas may experience increased flooding during winter and spring, as well as lower supplies during summer.
Polar Regions
Climate models indicate that global warming will be felt most acutely at high latitudes, especially in the Arctic where reductions in sea ice and snow cover are expected to lead to the greatest relative temperature increases. Ice and snow cool the climate by reflecting solar energy back to space, so a reduction in their extent would lead to greater warming in the region.
Coastal Zones
Sea level is rising more rapidly along the U.S. coast than worldwide. Studies by EPA and others have estimated that along the Gulf and Atlantic coasts, a one-foot (30 cm) rise in sea level is likely by 2050.
In the next century, a two-foot rise is most likely, but a four-foot rise is possible. Rising sea level inundates wetlands and other low-lying lands, erodes beaches, intensifies flooding, and increases the salinity of rivers, bays, and groundwater tables. Low-lying countries like Maldives located in the Indian Ocean and Bangladesh may be severely affected. The world may see global warming refugees from these impacts.
Forests
The projected 2°C (3.6°F) warming could shift the ideal range for many North American forest species by about 300 km (200 mi.) to the north.
- If the climate changes slowly enough, warmer temperatures may enable the trees to colonize north into areas that are currently too cold, at about the same rate as southern areas became too hot and dry for the species to survive. If the Earth warms 2°C (3.6°F) in 100 years, however, the species would have to migrate about 2 miles every year.
- Poor soils may also limit the rate at which tree species can spread north.
- Several other impacts associated with changing climate further complicate the picture:
- On the positive side, CO2 has a beneficial fertilization effect on plants, and also enables plants to use water more efficiently. These effects might enable some species to resist the adverse effects of warmer temperatures or drier soils.
- On the negative side, forest fires are likely to become more frequent and severe if soils become drier.
What is Uncertain
The long-term effects of global warming
Scientists have identified that our health, agriculture, water resources, forests, wildlife, and coastal areas are vulnerable to the changes that global warming may bring. But projecting what the exact impacts will be over the twenty-first century remains very difficult. This is especially true when one asks how a local region will be affected.
Scientists are more confident about their projections for large-scale areas (e.g., global temperature and precipitation change, average sea level rise) and less confident about the ones for small-scale areas (e.g., local temperature and precipitation changes, altered weather patterns, soil moisture changes). This is largely because the computer models used to forecast global climate change are still ill-equipped to simulate how things may change at smaller scales.
Some of the largest uncertainties are associated with events that pose the greatest risk to human societies. IPCC cautions, "Complex systems, such as the climate system, can respond in non-linear ways and produce surprises." There is the possibility that a warmer world could lead to more frequent and intense storms, including hurricanes. Preliminary evidence suggests that, once hurricanes do form, they will be stronger if the oceans are warmer due to global warming. However, the jury is still out whether or not hurricanes and other storms will become more frequent.
Solutions for Global Warming
Today, there is no single solution that is agreed upon, because scientists are still debating whether the problem is a real one or a perceived one. The main question is whether we want to wait to see the effects for sure and then act, or whether we want to start to do something now?
Like many pioneer fields of research, the current state of global warming science can't always provide definitive answers to our questions. There is certainty that human activities are rapidly adding greenhouse gases to the atmosphere, and that these gases tend to warm our planet. This is the basis for concern about global warming.
The fundamental scientific uncertainties are these: How much more warming will occur? How fast will this warming occur? And what are the potential adverse and beneficial effects? These uncertainties will be with us for some time, perhaps decades.
Global warming poses real risks. The exact nature of these risks remains uncertain. Ultimately, this is why we have to use our best judgment—guided by the current state of science—to determine what the most appropriate response to global warming should be.
What difference can I make?
When faced with this question, individuals should recognize that, collectively, they can make a difference. In some cases, it only takes a little change in lifestyle and behavior to make some big changes in greenhouse gas reductions. For other types of actions, the changes are more significant.
When that action is multiplied by the 270 million people in the U.S. or the 6 billion people worldwide, the savings are significant. The actions include being energy efficient in the house, in the yard, in the car, and in the store.
Everyone's contribution counts, so why not do your share?
Energy Efficiency Means Doing the Same (or More) with less Energy. When individual action is multiplied by the 270 million people in the U.S., or the 6 billion people worldwide, the savings can be significant.
How Can I Save the Environment?
Instructions: You can help save the environment by making changes from the top to the bottom of your home. Roll over the numbers below to see how you can make a difference:
Review
To review, these are the things you can do in your home – from top to bottom - to protect from the environment:
- Purchase "Green Power" - electricity that is generated from renewable sources such as solar, wind, geothermal, or biomass - for your home's electricity, if available from your utility company. Although the cost may be slightly higher, you'll know that you are buying power from an environmentally friendly energy source.
- Insulate your home – you’ll learn more about this in Home Activity Three.
- Use low-flow faucets in your showers and sinks.
- Replace toilets with water-saving lavatories.
- Purchase home products—appliances, new home computers, copiers, fax machines, that display the ENERGY STAR® label - You can reduce your energy consumption by up to 30 percent and lower your utility bills! Remember, the average house is responsible for more air pollution and carbon dioxide emissions than is the average car.
- When your lights burn out, replace them with energy-efficient compact fluorescent lights.
- Lower the temperature on your hot water tank to 120 degrees.
- Tune up your furnace.
- Insulate your water heater and all water pipes to reduce heat loss.
When you remodel, build, or buy a new home, incorporate all of these energy efficiency measures—and others.
Each of us, in the U.S., contributes about 22 tons of carbon dioxide emissions per year, whereas the world average per capita is about 6 tons.
The good news is that there are many ways you and your family can help reduce carbon dioxide pollution and improve the environment for you and your children.
Lesson 4c: Acid Rain and the Ozone
Introduction to Acid Rain and the Ozone
Acid rain is a serious environmental problem around the world, particularly affecting Asia, Europe, and large parts of the U.S. and Canada. The acidic pollutants such as SO2 and NOx are emitted into the environment by combustion of fossil fuels.
Most of the sulfur in any fuel combines with oxygen and forms SO2 in the combustion chamber. This SO2 when emitted into the atmosphere slowly oxidizes to SO3. SO3 is readily soluble in water in the clouds and forms H2SO4 (sulfuric acid).
Most of the NOx that is emitted is in the form of NO. This NO is oxidized in the atmosphere to NO2. NO2 is soluble in water and forms HNO3 (nitric acid).
Acid Deposition
Sunlight increases the rate of most of the SO2 and NO reactions. The result is a mild solution of sulfuric acid and nitric acid. "Acid rain" is a broad term used to describe several ways that acids fall out of the atmosphere. A more precise term is acid deposition, which has two parts: wet and dry.
- Wet deposition - refers to acidic rain, fog, and snow. As this acidic water flows over and through the ground, it affects a variety of plants and animals. The strength of the effects depend on many factors, including:
- the acidity of the water;
- the chemistry and buffering capacity of the soils involved;
- the types of fish, trees, and other living things that rely on the water.
- Dry deposition - refers to acidic gases and particles. About half of the acidity in the atmosphere falls back to earth through dry deposition.
- Acidic particles and gases are blown by the wind onto buildings, cars, homes, and trees.
- Dry deposited gases and particles can also be washed from trees and other surfaces by rainstorms. When that happens, the runoff water adds those acids to the acid rain, making the combination more acidic than the falling rain alone
Process of Acid Deposition
Prevailing winds blow the compounds that cause both wet and dry acid deposition across state and national borders, and sometimes over hundreds of miles. Please watch the 1:22 presentation below to learn more about the process of acid deposition.
In this diagram, we are seeing how the acid deposition occurs. When the sources emit pollutants such as SO2, NOx, mercury, and volatile organic compounds, primarily SO2 and NOx, which are acidic gases, are deposited in two ways. One is dry deposition, the other one is wet deposition. The SO2 and NOx when they deposit back either gaseous pollutants or as particulates, it's called dry deposition. When these pollutants dissolve in water, cloud water, and then deposit, it's called wet precipitation. Or that is what we call acid rain. The dry, gaseous pollutants or particulate matter can sometimes get dissolved in water and come down again as wet precipitation. Receptors are the species that receive this acid rain and get affected. These receptors can be materials that we care about, or aquatic life, human beings, or lakes and streams.
pH Scale
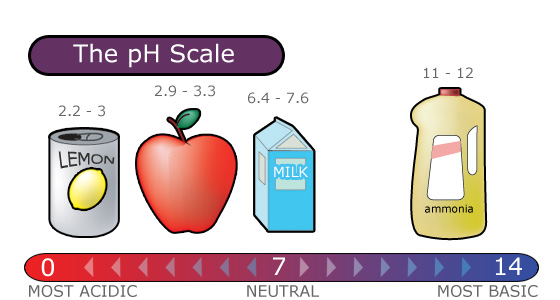
Acid rain is measured using a pH scale.
pH is a measure of hydrogen ion concentration, which is measured as a negative logarithm. In other words, acids produce hydrogen ions and alkalis produce hydroxyl ions, so pH is the power of a solution to yield hydrogen ions [H+].
The pH scale ranges from 0 to 14 and indicates how acidic or basic a substance is.
- A pH of 7 is neutral.
- A pH less than 7 is acidic.
- A pH greater than 7 is basic.
The lower a substance's pH, the more acidic it is. Each whole pH value below 7 (the neutral point) is ten times more acidic than the next higher value.
- For example, a pH of 4 is ten times more acidic than a pH of 5 and 100 times (10 times 10) more acidic than a pH of 6.
The higher a substance’s pH, the more basic or alkaline it is.
- Each whole pH value above 7 is ten times more alkaline (another way to say basic) than the next lower whole value.
- For example, a pH of 10 is ten times more alkaline than a pH of 9.
Effects of Acid Rain
Overview
Pure water has a pH of 7.0. Normal rain is slightly acidic because carbon dioxide dissolves into it, so it has a pH of about 5.5. As of the year 2000, the most acidic rain falling in the US has a pH of about 4.3.
Below is a video demonstration that replicates the effect of acid rain on plant life. In this video, beans are placed in: a) water, b) slightly acidic water and c) acidic water, and their growth is observed over a period of three days. Please watch the following 5:35 video:
We are learning about the environmental effects of acid rain. Acid rain is basically the compounds that form acid are mixing with the water in the clouds and coming down acidic rain. As it can be created at home using various day-to-day ingredients, one of them is vinegar, or you could use, also, lemon juice, that has a lot of acid. So what we are going to do in this demonstration today is to see the effect of acid rain on spouting off moon beans. These are a special kind of beans. And you can use, actually, most of the types of beans which have hard shell on the outside. So we are using here three different bowls here. Each of these bowls is filled with 20 beans, 20 seeds of these moon beans. And we are going to pour plain water in this one, and slightly acidic water in this bowl, and highly acidic water in this bowl, and see every day-- tomorrow, day after, and a day after that-- how this acid changes the spouting off these beans. So let's actually prepare this and add plain water to the first one. This is plain water, just water from the faucet. I'm going to add enough water so that these beans are all immersed in the water. Now the slightly acidic water I'm preparing by adding vinegar that I have here. And now this is a bottle of vinegar. And I'm going to add two spoons of vinegar to this. So this water in this cup is slightly acidic. I'm going to mix this and use this water. This is slightly acidic water. And I'm going to pour slightly acidic water in here. There are 20 beans in this cup, in this bowl, also. And I'm going to prepare highly acidic water here with the same vinegar. I'm going to add five spoons-- one, two, three, four, five. This is a little bit stronger than the other acid that we prepared. Now I'm going to add this highly acidic water to this bowl to the same level. And as the water evaporates, whatever type of water-- as the water evaporates, we need to refill with the same kind of water-- plain water in this bowl, slightly acidic water in this bowl. And highly acidic water in this bowl-- and observe the results. And what I want you to now hypothesize is which one would have the significant effects. Which one would have the significant effect? Or which one of these bowls will have more sprouting then the other? And when you look at day one, day two, day three, I need you to count the number of seeds that are sprouting. And you can prepare a plot. Let's say on day one, the plain water ones sprouted six out of 20, which means 30% have sprouted. Slightly acidic ones four out of 20. So that's 25%. Highly acidic one, six out of 20. That's, again, 30%. So you can plot that as a function of time and see at the end of four or five days how many of these seeds sprout. Let's watch for three days. OK. We are on day three today. And you can see on day one itself we had all 20 out of 20 sprouted in this plain water. And slightly acidic water, we didn't have any sprouts. Even today we don't have any sign of sprouting in highly acidic water. That is the impact that you can see of the acidity on sprouting of seeds. Now you can imagine what it would be like for the entire planet if it is covered with acidic rain. And what would be the impact on agriculture? What would be the impact on food supply chain to the humanity? So that is what we learned from this exercise.
Negative Consequences
Acid rain results in many negative consequences. Place your mouse over the image below to see the effects of acid deposition.
Effects of Acid Rain on Forests and Aquatic Life
Effects of Acid Rain on Forests
Acid rain does not usually kill trees directly. Instead, it is more likely to weaken trees by:
- damaging their leaves;
- limiting the nutrients available to them;
- exposing them to toxic substances slowly released from the soil.
Quite often, injury or death of trees is a result of these effects of acid rain in combination with one or more additional threats. Move your cursor over the numbers in the image below to see the effects of acid rain on the forest:
Effects of Acid Rain on Aquatic Life
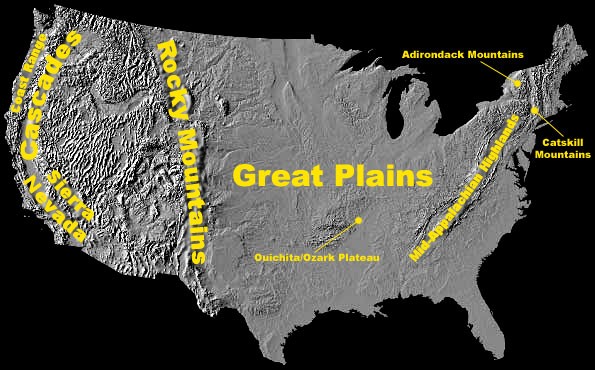
Acid rain causes acidification of lakes and streams and contributes to damage of trees at high elevations (for example, red spruce trees above 2,000 feet) and many sensitive forest soils. Several regions in the U.S. were identified as containing many of the surface waters sensitive to acidification. They include the:
- Adirondacks and Catskill Mountains in New York State;
- Mid-Appalachian Highlands along the east coast;
- Upper Midwest;
- Mountainous areas of the Western United States.
Some types of plants and animals can handle acidic waters. Others, however, are acid-sensitive and will be lost as the pH declines. Click on the name of the fish, shellfish, and insects below to see what pH levels they can tolerate:
Effects of Acid Rain on Materials, Visibility, and Human Health
Effects of Acid Rain on Materials
Acid rain and the dry deposition of acidic particles contribute to the corrosion of metals (such as bronze) and the deterioration of paint and stone (such as marble and limestone). These effects seriously reduce the value to society of buildings, bridges, cultural objects (such as statues, monuments, and tombstones), and cars.

Effects of Acid Rain on Visibility
Sulfates and nitrates that form in the atmosphere from sulfur dioxide (SO2) and nitrogen oxides (NOx) emissions contribute to visibility impairment, meaning we can't see as far or as clearly through the air.
Eastern United States
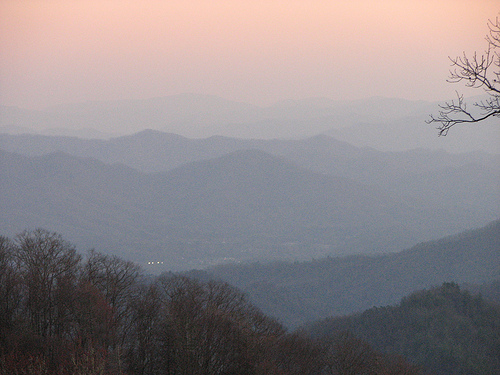
Sulfate particles account for 50 to 70 percent of the visibility reduction in the eastern part of the United States, affecting our enjoyment of national parks, such as the Shenandoah and the Great Smoky Mountains.
Through the Acid Rain Program, SO2 reductions will be completed to improve visual range at national parks located in the eastern United States. Based on a study of the value national park visitors place on visibility, these reductions are expected to be worth over a billion dollars annually by the year 2010.
Western United States
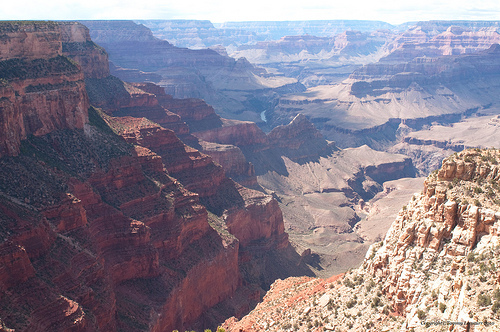
In the western part of the United States, nitrates and carbon also play roles, but sulfates have been implicated as an important source of visibility impairment in many of the Colorado River Plateau national parks, including the Grand Canyon, Canyonlands, and Bryce Canyon.
Effects of Acid Rain on Human Health
Acid rain looks, feels, and tastes just like clean rain. The harm to people from acid rain is not direct. Walking in acid rain, or even swimming in an acid lake, is no more dangerous than walking or swimming in clean water. However, the pollutants that cause acid rain also damage human health.
- Effects of Sulfur Dioxide (SO2): These gases interact in the atmosphere to form fine sulfate and nitrate particles that can be transported long distances by winds and inhaled deep into people's lungs. Fine particles can also penetrate indoors. Many scientific studies have identified a relationship between elevated levels of fine particles and increased illness and premature death from heart and lung disorders, such as asthma and bronchitis.
- Effects of Nitrogen Oxide (NOx): Decrease in nitrogen oxide emissions are also expected to have a beneficial impact on human health by reducing the nitrogen oxides available to react with volatile organic compounds and form ozone. Ozone impacts on human health include a number of morbidity and mortality risks associated with lung inflammation, including asthma and emphysema.
Protecting the Environment from Acid Rain
You can do the following to protect the environment from acid rain:
- Turn off lights, computers, and other appliances when you're not using them.
- Use energy efficient appliances: lighting, air conditioners, heaters, refrigerators, washing machines, etc.
- Only use electric appliances when you need them.
- Keep your thermostat at 68°F in the winter and 72°F in the summer. You can turn it even lower in the winter and higher in the summer when you are away from home.
- Insulate your home as best you can.
- Carpool, use public transportation, or better yet, walk or bicycle whenever possible.
- Buy vehicles with low NOx emissions, and maintain all vehicles well.
Introduction to Ozone
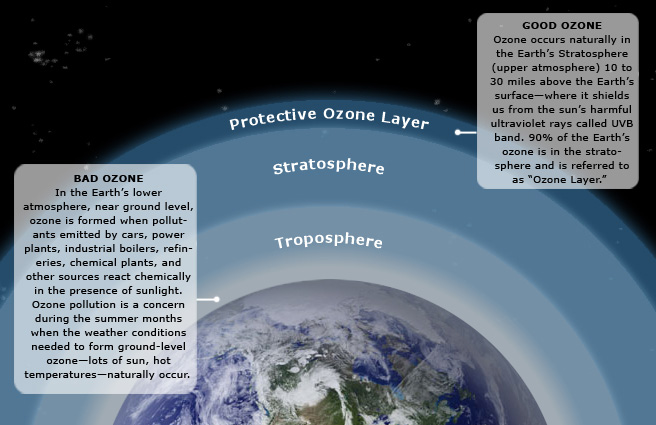
Ozone (O3) is a triatomic oxygen molecule gas that occurs both in the Earth’s upper atmosphere and at ground level. Ozone can be good or bad, depending on where it is found: It is a bluish gas that is harmful to breathe. Therefore, it is bad at the ground level.
The Ozone Cycle
The presentation below shows the process of ozone depletion. Ozone depletion is caused by chlorofluorocarbons (CFCs) and other ozone-depleting substances. Please watch the following 1:16 video.
In this picture we are seeing how the ozone layer is destroyed and the effects of that destruction. Certain compounds such as chlorofluorocarbons, CFC’s, are released into the atmosphere by human activities, and these CFC’s particularly, they are very, very unreactive at the atmospherical ground level and they go all the way up to the stratosphere and then the CFC’s dissociate or give up the chlorine. Each chlorine atom is capable of destroying or basically turning ozone into oxygen and which again doesn’t have the same capability as ozone does in shielding us from the UV radiation. And once that ozone layer or the number of ozone molecules in that layer goes down, more and more UV rays can pass through the atmosphere and reach the surface and can cause more skin cancer and cataracts in older people.
Production and Destruction of Ozone
Ozone is constantly produced and destroyed in a natural cycle, as shown in the figure below. However, the overall amount of ozone is essentially stable. This balance can be thought of as a stream's depth at a particular location. Although individual water molecules are moving past the observer, the total depth remains constant. Similarly, while ozone production and destruction are balanced, ozone levels remain stable. This was the situation until the past several decades. Please watch the following 1:32 video about ozone destruction.
Here we are looking at the ozone science. How the ozone is produced and how the ozone is destroyed. In the first step, the oxygen molecules are photolyzed or converted by the UV rays that are coming from the sun into two oxygen atoms; nascent oxygen atoms. Oxygen atoms are very, very reactive and they react with another oxygen molecule and form ozone, O3. Ozone and oxygen atoms are continually being interconverted as rays break the ozone and turns into nascent oxygen and oxygen molecules. And the oxygen atom again reacts with the oxygen molecules forms ozone. Our activities, which are producing the CFC’s and liberating into the atmosphere, they are going and these chlorine atoms are destroying the ozone molecules in addition to the natural process of formation and destruction. That is what is causing the reduction in the concentration of ozone in the stratosphere and when the concentration goes down below certain levels, like 220 Dobson units we call that ozone hole. Ozone hole does not mean that there is a big hole up there but what it means is that the concentration is below a certain level.
Large increases in stratospheric chlorine and bromine, however, have upset the balance of the Ozone. In effect, they have added a siphon downstream, removing ozone faster than natural ozone creation reactions can keep up. Therefore, ozone levels fall.
Since ozone filters out harmful UVB radiation, less ozone means higher UVB levels at the surface. The more the ozone is depleted, the larger will be the increase in incoming UVB radiation. UVB has been linked to:
- skin cancer;
- cataracts;
- damage to materials like plastics;
- harm to certain crops and marine organisms.
Although some UVB reaches the surface even without ozone depletion, its harmful effects will increase as a result of this problem.
Ozone-Depleting Substance(s) (ODS) are:
- CFCs;
- HCFCs (used in the energy related to refrigeration and air conditioning in homes, commercial buildings, and cars, and manufacture of foam products);
- Halons (used in fire extinguishers);
- Methyl bromide, carbon tetrachloride;
- Methyl chloroform (used as solvents in chemical industries).
The Ozone Hole
Recent studies by NASA and others have indicated that about 40 percent of the ozone in the Antarctica has been destroyed and that about 7 percent of ozone is destroyed from the Arctic Circle. The destruction of ozone is also called “Ozone Hole."
Ozone hole does not mean that there is no ozone in the region. The ozone hole is defined as the area having less than 220 dobson units (DU) of ozone (concentration) in the overhead column (i.e., between the ground and space).
The image below shows the reduction in ozone concentration over Antarctica. This hole in the Antarctica is unfortunately allowing more Australians to be exposed to UV radiation. However, if this kind of ozone destruction ever takes place in the Arctic zone, more humans (in the Northern hemisphere) would be exposed to higher levels of UVB radiation.
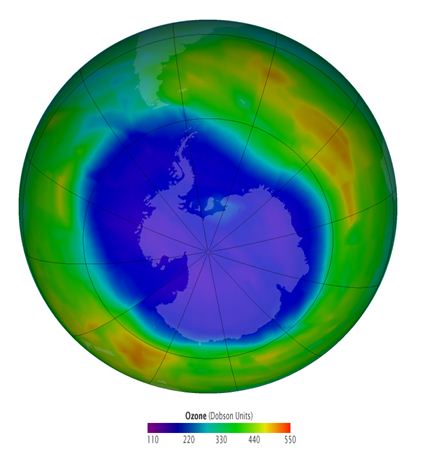

A Dobson Unit is the measure of the amount or thickness of ozone in the atmosphere. It is based on a measurement taken directly above a specific point on the Earth's surface. One Dobson unit refers to a layer of ozone that would be 0.001 cm thick under conditions of standard temperature (0 degree C) and pressure (the average pressure at the surface of the Earth). The Dobson unit was named after G.M.B. Dobson, who was a researcher at Oxford University in the 1920s. He built the first instrument (now called the Dobson meter) to measure total ozone from the ground.
The size of the Southern Hemisphere ozone hole as a function of the year is shown in the figure below. The graph compares the size of the hole over a twenty year period, from 1980 to 2010. It can be seen that the size increased each year. Each year in the spring, the ozone hole is at its largest.

Effects of Ozone Depletion on Skin
Effects of ozone depletion can result in 1) increased cases of skin cancer, 2) skin damage, 3) cataracts and other eye damage, and 4) immune suppression.
Skin Cancer
The incidence of skin cancer in the United States has reached epidemic proportions. One in five Americans will develop skin cancer in their lifetime, and one American dies every hour from this devastating disease.
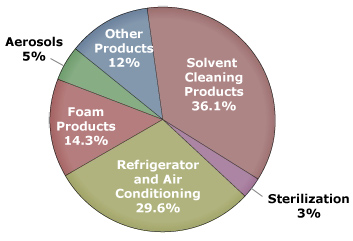
Medical research is helping us understand the causes and effects of skin cancer. Many health and education groups are working to reduce the incidence of this disease, of which 1.3 million cases have been predicted for 2000 alone, according to The American Cancer Society. The figure below shows the sources of ozone depleting substances.
Melanoma
Melanoma, the most serious form of skin cancer, is also one of the fastest growing types of cancer in the United States. Many dermatologists believe there may be a link between childhood sunburns and melanoma later in life. Melanoma cases in this country have more than doubled in the past 2 decades, and the rise is expected to continue.
Nonmelanoma Skin Cancers
Nonmelanoma skin cancers are less deadly than melanomas. Nevertheless, left untreated, they can spread, causing disfigurement and more serious health problems. More than 1.2 million Americans will develop nonmelanoma skin cancer in 2000 while more than 1,900 will die from the disease. There are two primary types of nonmelanoma skin cancers.
- Basal Cell Carcinomas are the most common type of skin cancer tumors. They usually appear as small, fleshy bumps or nodules on the head and neck, but can occur on other skin areas. Basal cell carcinoma grows slowly, and rarely spreads to other parts of the body. It can, however, penetrate to the bone and cause considerable damage.
- Squamous Cell Carcinomas are tumors that may appear as nodules or as red, scaly patches. This cancer can develop into large masses, and unlike basal cell carcinoma, it can spread to other parts of the body.
These two cancers have a cure rate as high as 95 percent if detected and treated early. The key is to watch for signs and seek medical treatment.
Other Skin Damage
Other UV-related skin disorders include actinic keratoses and premature aging of the skin.
- Actinic keratoses are skin growths that occur on body areas exposed to the sun. The face, hands, forearms, and the "V" of the neck are especially susceptible to this type of lesion. Although premalignant, actinic keratoses are a risk factor for squamous cell carcinoma. Look for raised, reddish, rough-textured growths and seek prompt medical attention if you discover them.
- Chronic exposure to the sun also causes premature aging, which over time can make the skin become thick, wrinkled, and leathery. Since it occurs gradually, often manifesting itself many years after the majority of a person's sun exposure, premature aging is often regarded as an unavoidable, normal part of growing older. With proper protection from UV radiation, however, most premature aging of the skin can be avoided.
Protect yourself against sunburn. Minimize sun exposure during midday hours (10 am to 4 pm). Wear sunglasses, a hat with a wide brim, and protective clothing with a tight weave. Use a broad spectrum sunscreen with a sun protection factor (SPF) of at least 15. To be safer, 30 is better.
Effects of Ozone Depletion on Eyes and Immune System
Cataracts and Other Eye Damage
Cataracts are a form of eye damage in which a loss of transparency in the lens of the eye clouds vision. If left untreated, cataracts can lead to blindness. Research has shown that UV radiation increases the likelihood of certain cataracts. Although curable with modern eye surgery, cataracts diminish the eyesight of millions of Americans and cost billions of dollars in medical care each year.
Instructions: Place your mouse over the image below to see the effect cataracts can have on vision.
Other kinds of eye damage include pterygium (i.e., tissue growth that can block vision), skin cancer around the eyes, and degeneration of the macula (i.e., the part of the retina where visual perception is most acute). All of these problems can be lessened with proper eye protection from UV radiation.
Immune Suppression
Scientists have found that overexposure to UV radiation may suppress proper functioning of the body's immune system and the skin's natural defenses. All people, regardless of skin color, might be vulnerable to effects including impaired response to immunizations, increased sensitivity to sunlight, and reactions to certain medications.
Protecting the Environment - Ozone Depletion
Your “Power” in Protecting the Environment from Ozone Depletion
- Make sure that technicians working on your car air conditioner, home air conditioner, or refrigerator are certified by an EPA-approved program to recover the refrigerant (this is required by law).
- Have your car and home air conditioner units and refrigerator checked for leaks. When possible, repair leaky air conditioning units before refilling them.
- Contact local authorities to properly dispose of refrigeration or air conditioning equipment.
International Action in Protecting the Environment from Ozone Depletion
In 1987, the Montreal Protocol, an international environmental agreement, established requirements that began the worldwide phase out of ozone-depleting CFCs (chlorofluorocarbons). These requirements were later modified, leading to the phase out in 1996 of CFC production in all developed nations.
Ground Level Ozone and Photochemical Smog
Ozone is a secondary pollutant that forms from the primary pollutants such as Volatile Organic Compounds (Hydrocarbons) and nitrogen oxides (NOx) in the presence of sunlight. Its formation is mainly from the automobile emissions.

Below is a demonstration on how ozone forms at the ground level (note ground level ozone is also known as “bad” ozone). Please watch the following 5:29 video:
This demonstration is basically looking at how ozone forms or how photochemical smog forms at the ground level because of the pollutants that we emit.Ozone emission or ozone formation depends on two ingredients, nitrogen oxides that are emitted by pollutants that are going out to the tail pipe of a car and in a power plant with a stack. Nitrogen oxides react with volatile organic compounds. Volatile organic compounds are also emitted by the tailpipe of the cars and some of them are coming from petroleum refineries and petroleum industries. VOCs + NOx = Ozone. These volatile organic compounds react to form ozone only in the presence of sunlight. That is the critical thing, only in presence of sunlight. So, to see this demonstration, we need sunlight. Obviously, we don’t have the sunlight here but I can create sunlight or the wave lengths that are important to create the same effects. That is the reason I am using a UV lamp. You see this lamp here? This blue light is producing the UV light that is required to create ozone. And this ozone again reacts with volatile organic compounds to produce photochemical smog. So first of all I am trying to create here ozone. The way I am creating ozone is not with Nitrogen oxides and volatile organic compounds but turning the oxygen that is there in the beaker into ozone by using this UV light. So let me close this and in about three or four minutes, the oxygen that is there inside will turn into ozone.So we have one ingredient. The second ingredient that is required is Nitrogen oxides or volatile organic compounds to produce smog. Once ozone is formed, I can introduce one of those ingredients and we can see the smog. Ok, I guess we have probably enough ozone in there.Now we need to add Nitrogen oxides and volatile organic compounds to form the photochemical smog that we are seeing or that we should be seeing. Ozone + VOCs + NOx = Photochemical Smog. Since I don’t have my car with me or the tail pipe, I need to somehow produce hydro-carbons in this room.So what I am doing is hydro carbons and Nitrogen oxide, cause even is nitrogen oxides are not there, we can form photochemical smog if we have hydro carbons. The composition will be slightly different. So now I am taking my orange, this is the orange, and you know the beautiful smell that you normally smell with an orange is because of linolenic acid. Linolenic acid is the orange smell that you get.And I’m just taking a small peel of this orange, this is the source of hydrocarbons, and I am trying to put it in here - nothing big deal.And this ozone that is there inside will slowly react with this hydrocarbon that are produced, that are emitted from this orange peel and produce the photochemical smog. Do you see anything going on here? Are you able to still see through the beaker? Is the atmosphere clear in the beaker or is it becoming hazy? Let me turn this little bit around and you may be able to see now, I don’t know. Can you see anything coming out of this? That is the photochemical smog actually. Let me open this and show you. That is the smog that you see and when the smog or when this smoke kind of smog is in the beaker or in the atmosphere, you can not see through and since this has ozone in it, it is not good for our health. When you live in cities filled with this kind of smog, you generally experience breathing problems and other health problems. Your eyes start to water when you drive home from work late in the afternoon or your nose starts to run because your body tries to get rid of, get rid of these pollutants. So that is photochemical smog and if we keep this orange peel like this we probably can generate enough smog for about 24 hours to 36 hours like this, with this little orange peel.Now you can see what we are doing to the atmosphere by emitting roughly 10, 12, 13 million tons of nitrogen oxides into the atmosphere and several million tons of volatile organic compounds into the atmosphere.
As previously mentioned, the formation of ozone is mainly from automobile emission. A typical profile of pollutants in the air of major cities is well repeatable and is shown in the figure below. Note how the formation changes over the course of a day:
- Early in the morning - During peak traffic hours, NO and Hydrocarbons are emitted along with CO.
- Mid-morning - NO is slowly oxidized to NO2.
- Mid-afternoon - In the presence of sunlight, NOx react with VOCs to form ozone.
Ozone, by itself, is damaging to health and also to the environment. Ozone triggers a variety of health problems even at very low levels and may cause permanent lung damage after long-term exposure. Ozone also leads to the formation of smog or haze, causing additional problems such as a decrease in visibility as well as damage to plants and ecosystems.
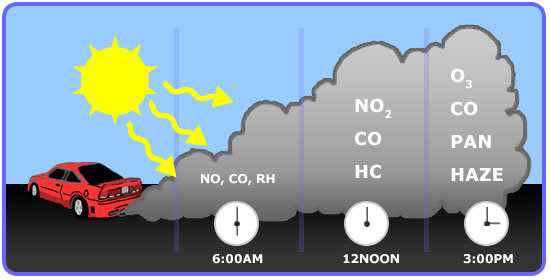
Basic Chemistry and Sources
As we have learned, volatile Organic Compounds (Hydrocarbons) combine with nitrogen oxides (NOx) in the presence of sunlight to form ozone.
In turn, sunlight and hot weather cause ground-level ozone to form in harmful concentrations in the air. As a result, it is known as a summertime air pollutant.
Many urban areas tend to have high levels of "bad" ozone, but even rural areas are also subject to increased ozone levels because wind carries ozone and pollutants that form it hundreds of miles away from their original sources.
View the graph below to compare the major sources of NOx and VOC that help to form ozone.
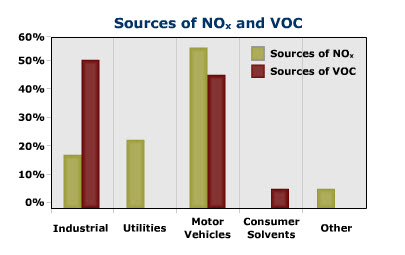
Health and Environmental Impact
Several groups of people are particularly sensitive to ozone—especially when they are active outdoors—because physical activity causes people to breathe faster and more deeply. In general, as concentrations of ground-level ozone increase, more and more people experience health effects, the effects become more serious, and more people are admitted to the hospital for respiratory problems. When ozone levels are very high, everyone should be concerned about ozone exposure.
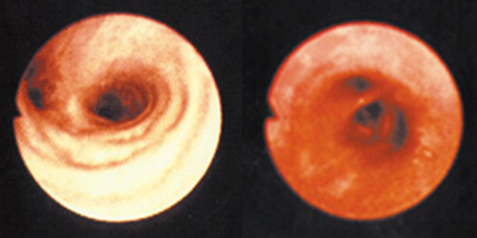
Below is a listing of Health Effects of Ground Level Ozone
- Ozone can irritate your respiratory system, causing you to start coughing, feel an irritation in your throat and/or experience an uncomfortable sensation in your chest.
- Ozone can reduce lung function and make it more difficult for you to breathe as deeply and vigorously as you normally would. When this happens, you may notice that breathing starts to feel uncomfortable. If you are exercising or working outdoors, you may notice that you are taking more rapid and shallow breaths than normal.
- Ozone can aggravate asthma. When ozone levels are high, more people with asthma have attacks that require a doctor's attention or the use of additional medication. One reason this happens is that ozone makes people more sensitive to allergens, which are the most common triggers for asthma attacks. Also, asthmatics are more severely affected by the reduced lung function and irritation that ozone causes in the respiratory system.
- Ozone can inflame and damage cells that line your lungs. Within a few days, the damaged cells are replaced and the old cells are shed—much in the way your skin peels after a sunburn.
- Ozone may aggravate chronic lung diseases such as emphysema and bronchitis and reduce the immune system's ability to fight off bacterial infections in the respiratory system.
- Ozone may cause permanent lung damage. Repeated short-term ozone damage to children's developing lungs may lead to reduced lung function in adulthood. In adults, ozone exposure may accelerate the natural decline in lung function that occurs as part of the normal aging process.
Protecting the Environment
Move your cursor over the objects in the image below to find out what you can do to protect the environment.
Review and Extra Resources
Review
Watch the 8:41 Lesson 4 Review presentation below.
--coal and we also talked about what they are made up of-- primarily carbon, hydrogen, nitrogen, sulfur, and other minerals. And we need to know what forms when these carbon, hydrogen, nitrogen, sulfur, and other minerals burn. And their primary combustion products. Primary combustion products are basically what forms when an element reacts with oxygen. So primary products of carbon dioxide, carbon moNOxide, hydrogen and water, sulfur dioxide, nitrogen oxides, and lead, when we used to use unleaded gasoline. And you also need to know how each of these are forming. Like carbon dioxide, how does it form? Carbon moNOxide, when does it form? How does it form? And which are the sources that emit most of these carbon moNOxide, sulfur dioxide, et cetera, et cetera. Secondary pollutants and difference between primary and secondary pollutants. OK, you must be careful about that. Secondary pollutant is a pollutant that forms after primary pollutants are released and they react amongst themselves or something in the atmosphere, and forms secondary pollutants. And similarly, particulate matter-- what sizes they form, how they form, when they form, et cetera. And you also need to know the health and environmental effects of each of these pollutants like CO2, CO, SO2, et cetera. All these pollutants, health and environmental, what concentrations-- and you don't have to remember the numbers or anything, but how does it affect us? And which are the sources that emit these things, as I said. And particulate matter is PM, and it is classified based on size. And which size particles-- how they're classified-- which size are most dangerous. As you can see, intermediate-sized particles are the most dangerous one between 0.1 micron and 2.0 microns in size. And also, the regional effects of these particles we need to concentrate on-- global and regional effects. For example, CO2 causes global warming or sort of global climate change, and SO2 and NOx cause acid rain, et cetera, et cetera. All right, and greenhouse effect, what is it, basically? What is greenhouse effect-- definition or precisely what happens? And which of the gases that contribute to greenhouse effect? These are the gases that contribute to greenhouse effect, you need to know these. And some of these gases are more powerful than the others, so you need to understand what is global warming potential, or GWP. And you need to go through the textbook or your notes about CO2 and temperature profiles-- how they changed in the past 150 years and even before that. And what are the reasons for those changes? And as we talked about in the textbook, basically what is responsible for these kinds of changes? And preindustrial concentration and concentration right now, what it is and reasons for concern. And you also have to think about natural causes. Some people argue that it is happening naturally, so you need to know what are the arguments that are made for natural as well as human-made changes. Global warming, what is it? And difference between greenhouse effect and global warming, and factors affecting global climate change. What happens? What happens when global climate changes? Global temperature changes? And sea level changes? And polar ice caps melt? And precipitation levels change? Precipitation generally increases because there's more cloud cover. And also, what is for certain? What is not certain? And feedbacks--, feedbacks are like when low-level clouds form, it can reflect the sunlight, actually, increase the fraction of sunlight that can penetrate through thick clouds. And so the planet might be cooling down. And if the higher-level clouds form, it may be warming up. So those are the things that we don't know yet completely, know what kind of clouds form. So uncertainties and certainties-- for example, the great ocean belt conveyor phenomenon and so on, and so forth. And you also need to know what you can do to reduce potential global warming-- individual steps. When I say individual steps, you need to really know which gas, by which step which gas is reduced-- not just list those five steps or six steps that you know of. Drive less, that's not an answer. By driving less, I'm going to produce less CO2, because gasoline when burned produces CO2, kind of thing. You know you have to go to the reasoning part. And acid rain and ozone. Acid rain and ozone, how they form, basic chemistry you need to understand. Basic You don't have to write balanced equations, but what goes into it, and under what conditions these things form. And the gases that are responsible and conditions under which these things form. The difference between wet deposition, dry deposition, and how we measure acid rain on a pH scale. What is acid? What is base-- alkaline or basic? How we measure pH? And also the effects of these acid rain on various things. Effects on human health-- when we breathe SO2, NOx, what happens? What happens, when acid rain falls on soils, to vegetation and aquatic life? For example, fish cannot survive at lower pHs. And so different species. And effects of visibility, because acid rain components can form fine particulates which can reduce visibility. And different materials that we care about, like monuments, et cetera, statues, et cetera. You need to understand those differences. And ozone. Ozone-- basically two types, good ozone and bad ozone. So you need to understand why this is called good ozone, why this is called bad ozone. This good ozone shields us from UV light, and because it's far away in the stratosphere-- and this should be stratosphere, not troposphere here. And ground-level ozone. Ground-level ozone is formed by NOx and VOCs reacting in presence of sunlight. And why we call this bad ozone, why, we call this good ozone, and ozone hole, what is it? Is this really a hole? Or what is that ozone hole? Why we call that ozone hole. When the concentration goes down below a certain level it cannot shield us from the UV rays that are coming from the sun, so we call that an ozone hole. And how we are destroying that ozone and causing depletion of ozone, and causing the problem of more UV rays coming in. And also you need to understand, at the ground level, how the ground-level ozone is forming and turns into photochemical smog. Basic chemistry, what are the reactants that are going in. You don't have to actually balance the reactions or anything, but you need to understand the conditions and what are the reactants that are involved in it. And health and environmental effects. For example, ground-level ozone can cause human health problems, and also it can cause--
Review Sheet Lesson 4 – Energy and the Environment
- Fossil fuels
- Natural gas, Petroleum, Coal
- Fossil fuel composition (Carbon, Hydrogen, Nitrogen, Sulfur, Minerals)
- Products of Combustion
- Primary pollutants
- Carbon Dioxide (majority), Carbon Monoxide, Sulfur Dioxide, Nitrogen Oxides, Lead
- Secondary Pollutants
- Difference between primary and secondary
- Particulate matter
- Primary particles
- Secondary particles
- Primary pollutants
- Health and environmental effects of
- CO2, CO, SO2, NOx, Lead
- PM
- Very Small (smaller than 0.1 μm)
- Intermediate (between 0.1 μm and 2 μm) Most dangerous
- Coarse size (larger than 2 μm)
- Global and Regional effects of Secondary Pollutants
- Greenhouse effect - What is it?
- Greenhouse gases and GWP
- CO2, H2O, CH4, N2O, Other gases [CFC-12, HCFC-22,Perfluoromethane (CF4), Sulfur hexafluoride (SF6)]
- CO2 and temperature fluctuations (pre-industrial and current concentrations and temperature changes)
- Global warming:
- What is it?
- Difference between greenhouse effect and Global warming
- Factors affecting Global climate change
- Potential consequences on global temperature, change in sea levels, polar icecaps, precipitation levels, etc.
- What is known for certain?
- What is likely but uncertain?
- What is uncertain?
- Solutions for global warming
- Acid Rain and Ozone
- Acid Deposition, Basic chemistry of formation, gases responsible for acid deposition
- Wet deposition
- Dry Deposition
- pH scale (ranges from 0 to 14)
- pH of 7 is neutral
- pH less than 7 is acidic
- pH greater than 7 is basic
- Effects of acid rain on human health, vegetation, aquatic life,visibility, and materials
- Ozone
- Good Ozone (stratospheric ozone) vs. Bad Ozone (ground level ozone)
- Ozone Hole (Dobson units)
- Effects of Ozone depletion – basic chemistry
- Ground level Ozone and Photochemical smog formation- Basic chemistry
- Health and Environmental effects
- Your power in protecting the environment
- Acid Deposition, Basic chemistry of formation, gases responsible for acid deposition
Test Yourself
The questions below are your chance to test and practice your understanding of the content covered in this lesson. In other words, you should be able to answer the following questions if you know the material that was just covered! If you have problems with any of the items, feel free to post your question on the unit message board so your classmates, and/or your instructor, can help you out!
- What is the difference between primary and secondary pollutants?
- How can scientists extrapolate historical climate changes by analyzing ice cores?
- What is the greenhouse effect? Explain the difference between greenhouse effect and global warming? Which gases contribute to the greenhouse effect?
- Explain how ozone is formed at the ground level with the help of the basic reactions. Which end users of energy are responsible for the emissions of the compounds involved?
- Explain how the stratospheric ozone layer is being destroyed. Which sector is responsible for the emission of the gases that are responsible for this?
- What is acid rain? How is it formed? What are the effects of acid rain?
- List five steps that you, as an individual, can take to reduce potential global warming, and explain how each of these steps will reduce the emissions.
- List 5 ways in which you, as an individual, can reduce gaseous emissions that contribute to acid rain.
- State the arguments that scientists who say that global warming is not due to burning of fossil fuels are making.
- What are the effects of ground level ozone?
- Briefly describe the methods by which information is gathered and used to show that the planet is warming up.
Extra Resources
For more information on topics discussed in Lesson 4, see these selected references:
- CDIAC [39]
- EPA page on emissions [40]
- Vital Climate Graphics [41]
- The Science of Ozone Layer Depletion [42]
- EPA page on climate [43]
- Yosemite EPA [44]
- GW debate [45]
- EPA page on acid rain [46]
- Acid Rain [47]
- Visibility [48]
- Six Common Air Pollutants [49]
- Carbon Monoxide [50]
Home Activity: Energy Use and Analysis
Complete the following Home Activity. After working through the activity you will be asked to submit your work. Your grade for the activity will be posted to the gradebook approximately 1 week after the due date. Please refer to the Canvas calendar for time frames and due dates.
Note: If you don't see the Home Activity on your screen, try reloading the page. Also, be sure to check out the helpful links below the activity.
Use the following link to check your Home Activity Submission [51].
If you have already submitted your Home Activity and want to change an answer, watch this video, "How to modify an answer on your answer Home Activity. [52]"