The Structured Geospatial Analytical Method (SGAM) is offered to solve the wicked problem of teaching the cognitive skills needed to approach geospatial analysis. The SGAM’s model is a first step utilizing a sequential process where progress is seen as flowing steadily through the steps. There are known disadvantages of such sequential process models. Foremost, the flow most probably does not represent the natural cognitive problem solving process. Further, the problems in one step are never solved completely and many problems regarding a particular step arise after the step is completed. Acknowledging these limitations, it is our argument that the SGAM’s simple approach is necessarily more understandable for the novice and, therefore, more effective in teaching inexperienced analysts. Rather than what the master analysts sees as a creative problem solving chaos (which by definition is unrepeatable and therefore unteachable), the SGAM model provides a teachable structured approach for the inexperienced analyst; a model that progresses linearly through discrete, easily understandable and explainable steps.
The method is based upon three stages and organized into two major loops. The three stages and associated outputs are:
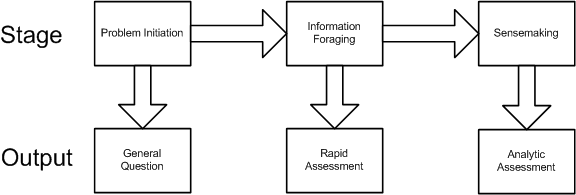
Analytic Stage 1: Problem Initiation. This stage broadly outlines the general analytic question.
Analytic Stage 2: Information foraging. This stage refines the general question to understand the geospatial aspects and results in the development of a rapid assessment based on informal methods or experience, and employing a form of trial and error iteration.
Analytic Stage 3: Sensemaking. This stage results in the development of a detailed analytic assessment utilizing an established methodology.
The two major loops are a:
- Foraging loop aimed at seeking information, searching and filtering it, and reading and extracting information.
- Sensemaking loop that involves iterative development of a mental model from the schema that best fits the evidence.
The foraging loop recognizes that analysts tended to forage for data by beginning with a broad set of data and then proceeded to narrow that set down into successively smaller, higher-precision sets of data, before analyzing the information (Pirolli,1999). The three foraging actions of exploring for new information, narrowing the set of items that have been collected, and exploiting items in the narrowed set trade off against one another under deadline or data overload constraints. It is important to note that much geospatial intelligence work never departs the foraging loop and simply consists of extracting information and repackaging it without much actual analysis and is in practice a rapid assessment of the question.
Sensemaking is the ability to make sense of an ambiguous situation; it is creating situational awareness and understanding in situations of high complexity or uncertainty in order to make decisions. It is "a motivated, continuous effort to understand connections (which can be among people, places, and events) in order to anticipate their trajectories and act effectively" (Klein, G., Moon, B. and Hoffman, R.F. 2006. Making sense of sensemaking. IEEE Intelligent Systems, 21(4), 70-73. ). When geospatial intelligence analysis departs the foraging loop and completes the sensemaking process, this yields an analytic assessment.
The below figure represents the Structured Geospatial Analytic Process derived from and incorporating aspects of both Heuer’s ACH and Pirolli and Card's sensemaking process. This is a generalized view of the geospatial analysis process that fits within the larger intelligence process. The rectangular boxes represent analytic activities. The arrows represent the flow from one activity to the next. The activities are arranged by degree of effort and degree of information structure. The overall analytic method has back loops. One set of activities focuses around finding information and another set of activities focuses on making sense of the information.
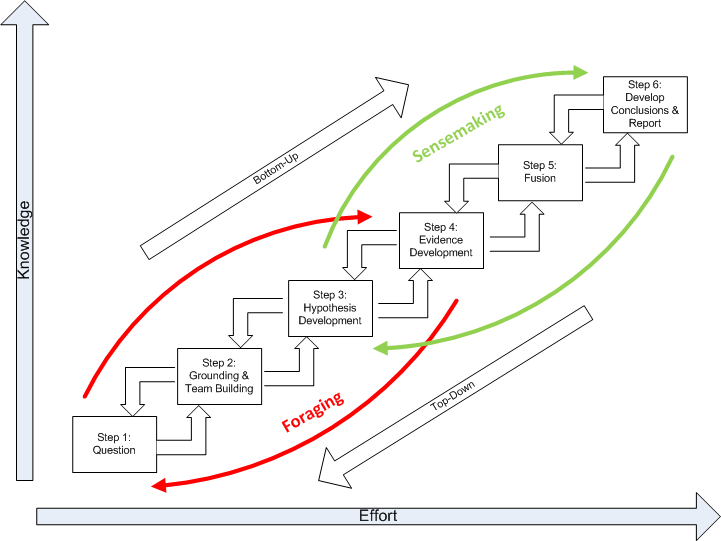
The diagram summarizes how an analyst comes up with new information. The data flow shows the transformation of information as it flows from raw information to reportable results through the following steps:
Question. Developing the question is a two-way interface between the client requiring information and the geospatial analyst supplying it.Critically, the question defines the broad nature of the spatial and temporal patterns the analyst is seeking to ultimately identify.
Grounding and Team Building. Grounding is the raw evidence that reaches the analyst. Grounding is building a potential repertoire of prototypical geospatial and temporal patterns from which a number of hypothetical (possible alternative) patterns will be selected. Step 2 is where the analytic team is formed.
Hypothesis Development. Hypotheses are the tentative representation of conclusions with supporting arguments. This step involves selecting all the reasonably possible geospatial and temporal patterns that might match the pattern envisioned during the development of your question.
Evidence Development. Evidence refers to snippets extracted from items discovered in the grounding. Development of the evidence includes developing and applying Schemas, which are the representation or organized marshaling of the information so that it can be used more easily to draw conclusions. This includes developing a smaller subset, which Pirolli and Card call the “shoebox”, of the data that are relevant for processing. Much of geospatial intelligence work never departs the foraging loop (Steps 1-4) and simply consists of extracting information and repackaging it without much actual analysis. In short, evidence is the development and accumulation of all facts to reject the hypothetical geospatial and temporal patterns determined in Step 3. GIS assists in the development and accumulation of the facts.
Fusion. The multi modal (graphical and text) nature of geospatial intelligence data analysis, which is used to reduce the influence of unreliable sources, is essentially a fusion process. Fusion in this step uses the ACH process to combine graphical and textual data, to achieve inferences, which will be more efficient and potentially more accurate than if they were achieved by means of a single source. Simply put, the fusion process is the comparing of the evidence to each hypothetical geospatial and temporal pattern to determine consistency.
Conclusions. The conclusion is a proposition about which hypothetical pattern(s) is (are) most consistent with the evidence and answers the question. Ultimately there is a presentation or other work product.
Basically, the data flow represents the converting of raw information into a form where expertise can apply, and then out to another form suited for communication. Information processing can be driven by bottom-up processes (from data to theory) or top-down (from theory to data). The bottom-up process is as described in steps 1 through 6. The top down process is slightly different in that it follows the sequence of:
- Evaluate conclusion. Inquiries from clients or indicators from signposts may generate re-evaluations of the current conclusions developed by an analyst. This may also require the marshaling of additional evidence to support or disconfirm the analysis or the generation and testing of alternative outcome.
- Deconstruct the synthesis. Reexamine the table of hypothesis and evidence beginning with the rankings.
- Examine the evidence. Reexamine collected evidence or search for new evidence. Search for nuggets of information that may suggest new geospatial or temporal patterns that generate hypotheses about plausible relations among entities and events.
- Re-evaluate the hypotheses. Looking for new hypotheses may generate new searches, further data extraction or a search for additional raw data.
- Question your grounding in the problem. New hypotheses may cause analysts to broaden their grounding in prototypical geospatial and temporal patterns.
- Question the question. Revalidate with the client the nature of the geospatial and temporal patterns the analyst is ultimately seeking to identify. Re-examine the process, use of tools, and quality.