The following actions are involved in the fusion of information:
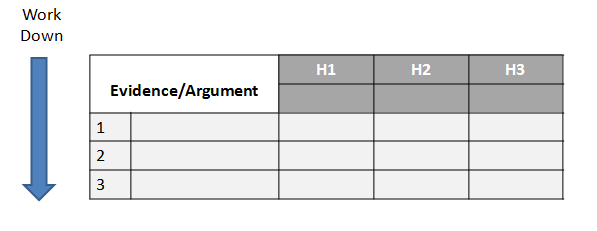
Action 1: Prepare a matrix with hypotheses across the top and evidence and arguments down the side. Please note that your evidence and arguments may or may not be geospatial in nature. The matrix gives an overview of all the significant components of your analytical problem.

Action 2: Working down the column to each piece of evidence and then across the rows of the matrix, examine one item of evidence at a time to see how consistent that item of evidence is with each of the hypotheses. Later you will work across the columns of the matrix, examining one hypothesis at a time, to see how consistent that hypothesis is with all the evidence.

To fill in the matrix, take the first item of evidence and ask whether it is consistent with, inconsistent with, or irrelevant to each hypothesis. Then make a notation accordingly in the appropriate cell under each hypothesis in the matrix. The form of these notations in the matrix is a matter of personal preference. It may be pluses, minuses, and question marks. It may be C, I, and N/A standing for consistent, inconsistent, or not applicable. Or it may be some textual notation. Simply put, what you use is a shorthand representation of the complex reasoning that went on as you thought about how the evidence relates to each hypothesis. In some cases, it may be useful to refine this procedure by using a numerical probability, rather than a general notation such as plus or minus, to describe how the evidence relates to each hypothesis.
Analyze the "diagnosticity" of each piece of evidence and each argument as you complete the matrix. This step is the most important; it is the step that deviates most from the intuitive approach to geospatial analysis. Diagnosticity is how helpful the evidence or argument is in judging the relative likelihood of alternative hypotheses. Diagnosticity of evidence is an important concept that is unfamiliar to many geospatial analysts. Diagnosticity may be illustrated by a medical analogy. A high-temperature reading may have great value in telling a doctor that a patient is sick, but relatively little value in determining which illness a person is suffering from. Because a high temperature is consistent with so many possible hypotheses about a patient's illness, this evidence has limited diagnostic value in determining which illness (hypothesis) is the most likely one.
The matrix format helps you weigh the diagnosticity of each item of evidence. If an item of evidence seems consistent with all the hypotheses, it may have no diagnostic value. A common experience is to discover that most of the evidence supporting what you believe is the most likely hypothesis really is not very helpful, because that same evidence is also consistent with other hypotheses. When you do identify items that are highly diagnostic, these should drive your judgment.
Action 3: Refine the matrix by reconsidering the hypotheses, and delete evidence and arguments that have no diagnostic value. The wording of the hypotheses is critical to the conclusions one can draw from the analysis. By this point, you will have seen how the evidence breaks out under each hypothesis, and it is necessary to reconsider and reword the hypotheses. New hypotheses may need to be added, or finer distinctions may need to be made in order to consider all the significant alternatives. If there is little or no evidence that helps distinguish between two hypotheses, consider combining the two.
Also, reconsider the geospatial evidence. Question if your thinking about which hypotheses are most likely and least likely is influenced by factors that are not included in the evidence. If so, use the data and tools in hand to create this evidence and include it in your analysis. Delete from the matrix items of evidence or arguments that now seem unimportant or have no diagnostic value. Save these items in a separate list as a record of information that was considered.