Exploration Phase
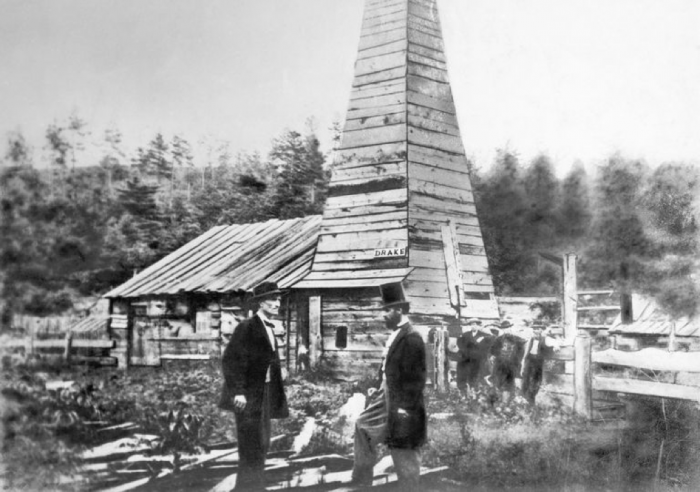
Energy companies, often referred to as exploration and production (E & P) companies, routinely invest millions of dollars in understanding the geology of a potential hydrocarbon-bearing formation before they acquire drilling rights much less conduct any drilling. As we learned in the previous lesson, existing geologic studies, well logs, and seismic survey data are carefully studied to understand where the most prospective areas for energy development may occur. In the continental U.S., most conventional basins have been explored, drilled, and produced for decades and therefore have long-term records of production from wells along with seismic and borehole geophysical logs. The Appalachian Basin is no exception for having historic records as shallow Appalachian Basin strata in Pennsylvania were the first commercially drilled and produced oil-bearing formations in the United States when Colonel Edwin Drake (who by the way wasn't actually a colonel but it sounded good!) struck oil near Titusville, PA in 1859 at 69.5 feet below the ground! The picture below shows Mr. Drake on the right standing at the site of the original well, though it is the second derrick as the first one caught on fire about a month after the well was drilled. The Drake well reportedly produced about 20-40 barrels per day.
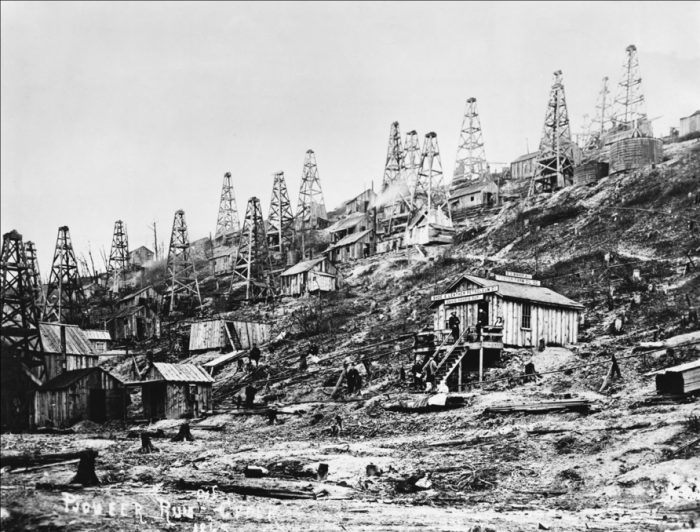
The Drake Well set off a flurry of prospecting and drilling, mostly using oil seeps along streams as a good sign of where to drill. These early exploration methods were simple but relatively effective in the development of these conventional basins. In these early days of oil field development wells were drilled very closely to one another, effectively competing for the same oil and draining the reservoirs relatively rapidly, leading to the classic boom-bust cycles that still occur today with oil and gas development. The picture below of Pioneer Run near Titusville shows a number of wells drilled very closely to one another, which led to the settlement of towns around the wells sometimes populated by several thousand people during the boom, but several years later became ghost towns after the bust.
These conventional basins have hydrocarbons often due to deeper black shale formations that act as the source rock, therefore often times significant geologic data exist in these basins that act as a good starting point to assess the hydrocarbon potential of the shale. The U.S. Geological Survey now routinely assesses petroleum potential for various basins or "plays" in the U.S. and publishes their assessments with estimates for total reserves of different types of hydrocarbons in each basin, including the Marcellus Shale (see reading assignment on Assessment of Undiscovered Oil and Gas Resources of the Devonian Marcellus Shale of the Appalachian Basin, 2011).
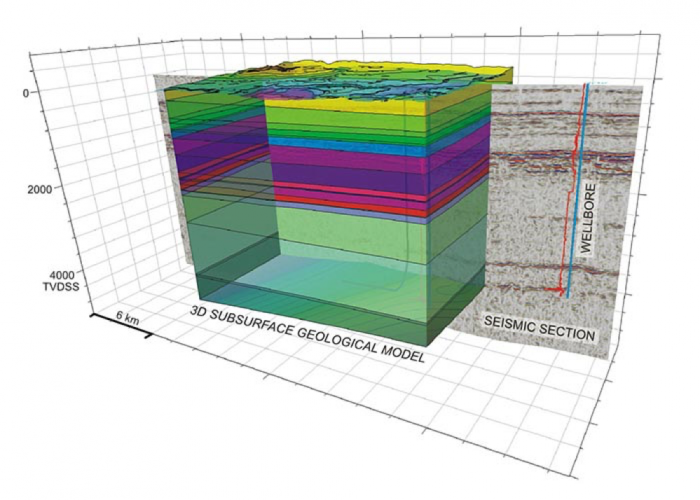
Once all existing data for the geologic basin of interest has been assessed, energy companies will determine what data gaps exist and what additional activities may need to occur to collect the necessary data to complete the geologic assessment for prospects for economically recoverable hydrocarbons (oil, natural gas liquids, and/or natural gas). The industry will likely acquire additional seismic data from seismic surveying companies to get a better understanding of the complexities of subsurface structure and stratigraphy. As we learned, these seismic surveys not only help locate the shale horizon's depth and thickness but also help identify faults and structural complexity of the shale, which can be impediments to drilling. Historically, 2-D seismic surveys were collected as part of understanding conventional formation geology, however recent advances in technology now make 3-D seismic surveys the common methodology for geologists to characterize tens to hundreds of square miles of land that may be viable for shale energy development. Shale basins typically consist of extensive "blanket" deposits covering tens of thousands of square miles with varying geologic characteristics. 3-D seismic surveys allow geologists and reservoir engineers to characterize relatively large areas of the reservoir to determine if they want to acquire drilling rights through the leasing process. The figures below show the seismic modeling results and integration of seismic and borehole data to determine if a shale is prospective for development.
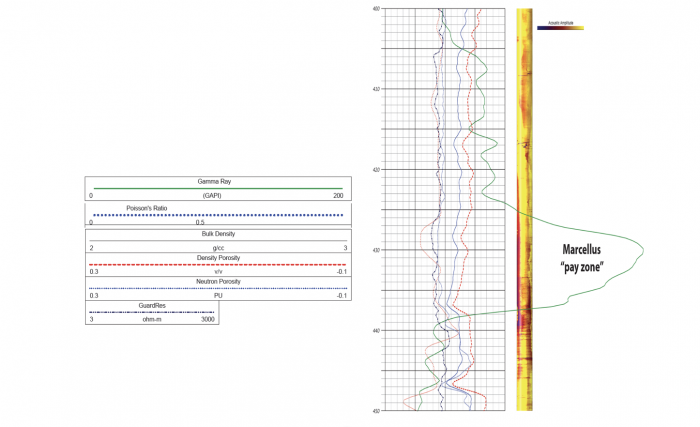
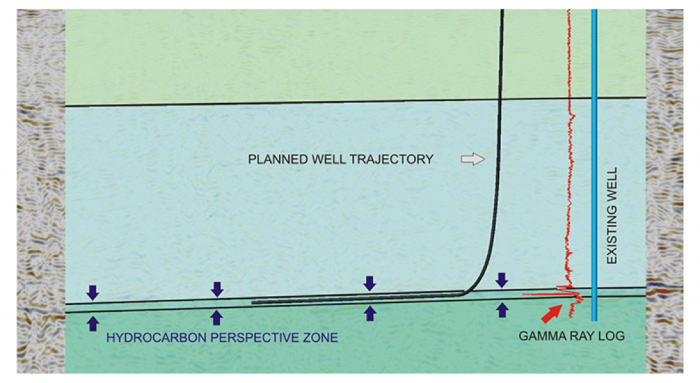
Borehole geophysical surveys may be conducted on an existing well or a new assessment well may be drilled to run gamma ray, density, and porosity logs. The gamma log measures the natural radioactivity of the formations penetrated by the well at depth. Organic-rich shale formations are naturally radioactive due to uranium and thorium that is present in seawater during deposition of the shale. The higher the total organic carbon content the higher the natural radioactivity, which is then detected during the gamma-ray logging. The density and porosity logs allow the geologists to gauge the relative permeability of the shale, and when taken into consideration along with the gamma logs allows the geologists to determine where the zones with the highest potential for oil and gas development are and what zone to drill into, commonly known as the pay zone. An example geophysical survey of the Marcellus shale is shown below. Note that the highest gamma-ray readings are designated as the pay zone.
Once a shale formation has been deemed sufficiently prospective, then an energy company can begin to determine what zone they would like to drill into to explore for the production of oil, gas, and other hydrocarbons. The figure below illustrates how a combination of seismic and borehole logging data assists with narrowing down what interval to drill a well into.
Before drilling can occur, an energy company must work with landowners to lease their land for drilling rights and get wells permitted from the regulators as presented in the next modules.