
Current Water Use and Sources
Currently, about 90 percent of Southern Nevada’s water comes from Lake Mead (the Colorado River) (Figure 9); the rest comes from groundwater. Because of the very limited natural recharge to the aquifer system, and the fact that no other surface water is available, Las Vegas depends almost exclusively on the Colorado River to sustain its population and economy. The city is essentially at the mercy of the Colorado River. When the Colorado River Compact was signed in 1922, the allotment of 300,000 acre-feet per year was viewed as generous for the sparsely populated state. However, as may sound like a familiar story, with a rapidly growing economy, combined with good weather and apparently plentiful water, population growth rapidly exceeded most projections (see Figure 5).
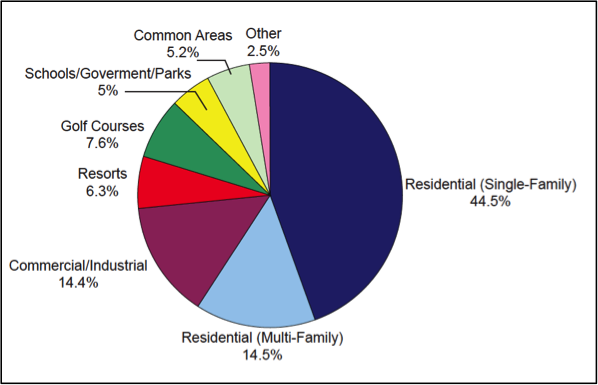
Of the water delivered by the Southern Nevada Water Authority, it may be surprising to note that most (almost 60%) goes to residential use (Figure 10). Of this, a large fraction is used consumptively for watering lawns. As discussed in detail in The Big Thirst, incentive programs for removal of turf from parks, common areas, and residences is one strategy to reduce water use. Golf courses and resorts, which are often the stereotypical poster children for water “waste” in Las Vegas, use about 14% combined.
The pie chart shown in Figure 10 provides the first blueprint for conservation efforts and potential re-use, by identifying the key water uses in the district. Moreover, there is also a recognition that not all water uses are “equal”: some require clean water (i.e. residential uses, many industrial uses, medical), whereas others do not (golf courses, parks). As a result, reclaimed and partly treated water may be used for many needs. In Las Vegas, water re-use – essentially getting two uses of the same water - is one part of a diverse strategy to maximize the limited allocation of Colorado River water (additional detail on treatment facilities and pricing for reclaimed water are described on the water district’s website.
Click for a text description