
What Are the Implications of Global Warming for Precipitation and Water Availability?
So what does all this human-induced warming mean for the water cycle and water availability? Thinking back to module 2, you learned that warmer air can hold more water (i.e., warmer air has a higher saturation vapor pressure). Therefore it is reasonable to expect higher amounts of water vapor in the air. This is supported by observations that show a 3.5% increase in water vapor in the past 40 years as the climate has warmed about 0.5°C, with relative humidity remaining approximately constant.
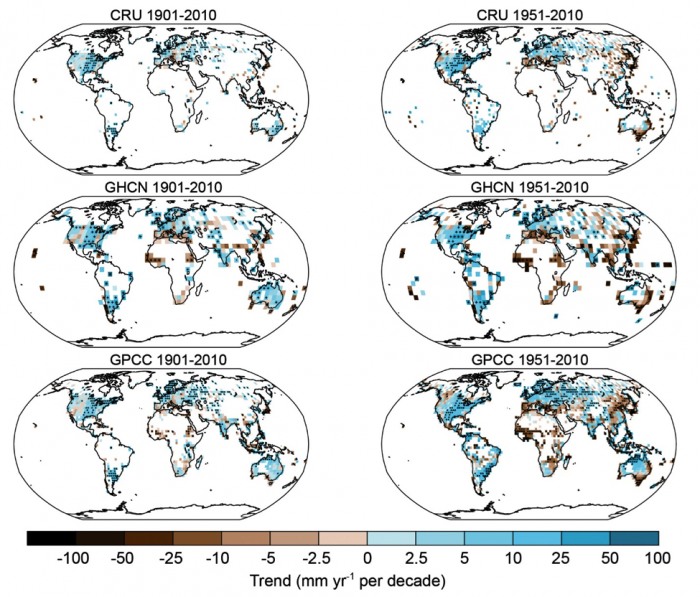
Changes in precipitation are harder to measure (or predict) compared with changes in atmospheric water vapor content because of the immense temporal and spatial variability of precipitation. Nevertheless, patterns of precipitation change can readily be observed from historical records (Figure 2), with many areas seeing increases greater than 25 mm/year per decade (i.e., going from 300 mm/yr to 325 mm/yr over the course of a decade) and other places (particularly Africa and Southeast Asia) seeing decreases in precipitation at rates greater than 10 to 25 mm/year per decade. With increasing temperatures, it naturally follows that a greater proportion of precipitation would fall as rain, rather than snow, which has also been documented by the IPCC.
Learning Checkpoint
According to Figure 2, all three models indicate that, on average, precipitation throughout the conterminous US has ___________ from 1901 to 2010 (see left column of maps).
(a) increased
(b) decreased
(c) remained about the same
ANSWER: (a) increased
According to Figure 2, all three models indicate that, on average, precipitation throughout the conterminous US has ___________ from 1951 to 2010 (see right column of maps).
(a) increased
(b) decreased
(c) remained about the same
ANSWER: (a) increased. Note that the rate of increasing precipitation has gone up compared to the time period from 1901-2010.