
Historical Precipitation Records and Climate Models
What can the historical precipitation records and climate models tell us about the future?
But what can the historical precipitation records and climate models tell us about the future? Simulating future changes in precipitation patterns is one of the most difficult elements of climate modeling because precipitation and evaporation (there are feedbacks between the two so you have to model both) are driven by complex, non-linear processes. So climate models do not attempt to predict detailed representations of precipitation for any given location and climate models are generally not capable of predicting changes in precipitation intensity or frequency of extreme events, other than the likely sign (+ or -) of expected change. Nevertheless, all global climate models attempt to capture general trends in precipitation and considerable agreement exists among all the many competing models. In the broadest perspective, the IPCC makes the following important projections:
“Changes in the global water cycle in response to the warming over the 21st century will not be uniform. The contrast in precipitation between wet and dry regions and between wet and dry seasons will increase, although there may be regional exceptions.”
“Extreme precipitation events over most of the mid-latitude land masses and over wet tropical regions will very likely become more intense and more frequent by the end of this century, as global mean surface temperature increases (see Table SPM.1).”
“Globally, it is likely that the area encompassed by monsoon systems will increase over the 21st century. While monsoon winds are likely to weaken, monsoon precipitation is likely to intensify due to the increase in atmospheric moisture. Monsoon onset dates are likely to become earlier or not to change much. Monsoon retreat dates will likely be delayed, resulting in lengthening of the monsoon season in many regions.”
“There is high confidence that the El Niño-Southern Oscillation (ENSO) will remain the dominant mode of inter-annual variability in the tropical Pacific, with global effects in the 21st century. Due to the increase in moisture availability, ENSO related precipitation variability on regional scales will likely intensify. Natural variations of the amplitude and spatial pattern of ENSO are large and thus confidence in any specific projected change in ENSO and related regional phenomena for the 21st century remains low.”
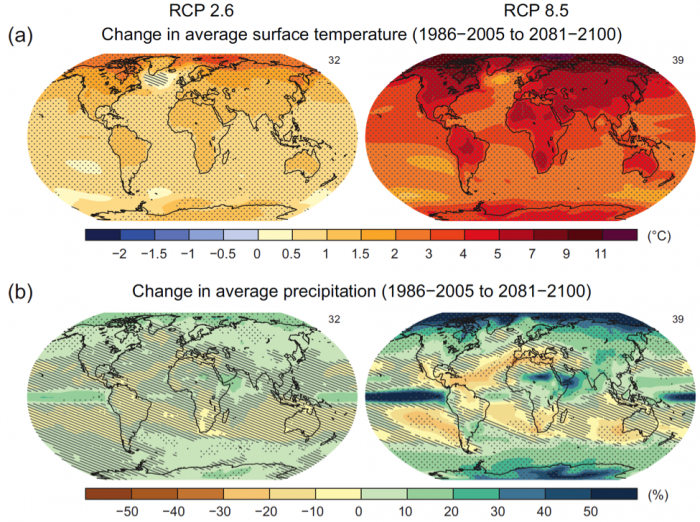
Figure 3 shows the average temperature and precipitation results of many different competing models for two different scenarios, comparing observations in 1986-2005 to the projected time period 2081-2100. The number of competing models used is shown in the top right of each panel (32 or 39). The two scenarios, called ‘Representative Concentration Pathways’ (RCPs) 2.6 and 8.5 are the two end-members of greenhouse gas emissions, with RCP 2.6 assuming that greenhouse gas emissions peak in 2010-2020 time period and decrease aggressively thereafter and RCP 8.5 assuming that greenhouse gas emissions increase throughout the 21st century. Notice that the warming (top plots) is not uniform throughout the world. The higher latitudes, especially in the northern hemisphere are expected to heat up considerably more than the temperate or tropical latitudes. We often hear numbers of the global average increase in temperature (estimated 1-2°C or 2-3.5°F by 2050), but this average value does not represent what is expected to happen at high latitudes. A 3-4°C (5-7°F) increase in the arctic, as indicated by RCP 2.6, represents a dramatic transformation of this ecosystem. A 10-12°C (18-21°F) increase in the arctic, as indicated by RCP 8.5, would represent a complete transformation of this ecosystem. What do you think would be the potential benefits and damages caused by such a transformation?
Changes in precipitation are also not expected to be uniform. In general, increases or decreases in precipitation are expected to be more drastic in the high greenhouse gas emission scenario (RCP 8.5) with some areas receiving 30-40% changes relative to 1986-2005. What ecosystem, economic or social changes might you expect to see as a result of a 30-40% increase or decrease in precipitation in the arctic? In Spain? In South Africa? In Chile?
Click for a text description