The United States is the world’s largest consumer of energy in general and of oil and refined products in particular. However, our current and forecasted energy production and consumption balance is improving towards a position of declining imports and more efficient use of all energy sources. The vast new supplies of oil and natural gas coming from domestic shale are radically altering our outlook for eventual self-sustainability. And the continuing development of “renewable” and “alternate” energy sources will decrease our reliance on traditional “fossil” fuels. We will now take a look at the current state of energy production and consumption in the US, followed by a brief examination of the renewable and alternative energy sources.
The following pie chart (Figure 4) shows the United States' energy consumption by source in 2021. As shown in the chart, petroleum that is mainly used for the purpose of transportation has the biggest share of 36%. Natural gas is in second place with 32% share of energy consumption.
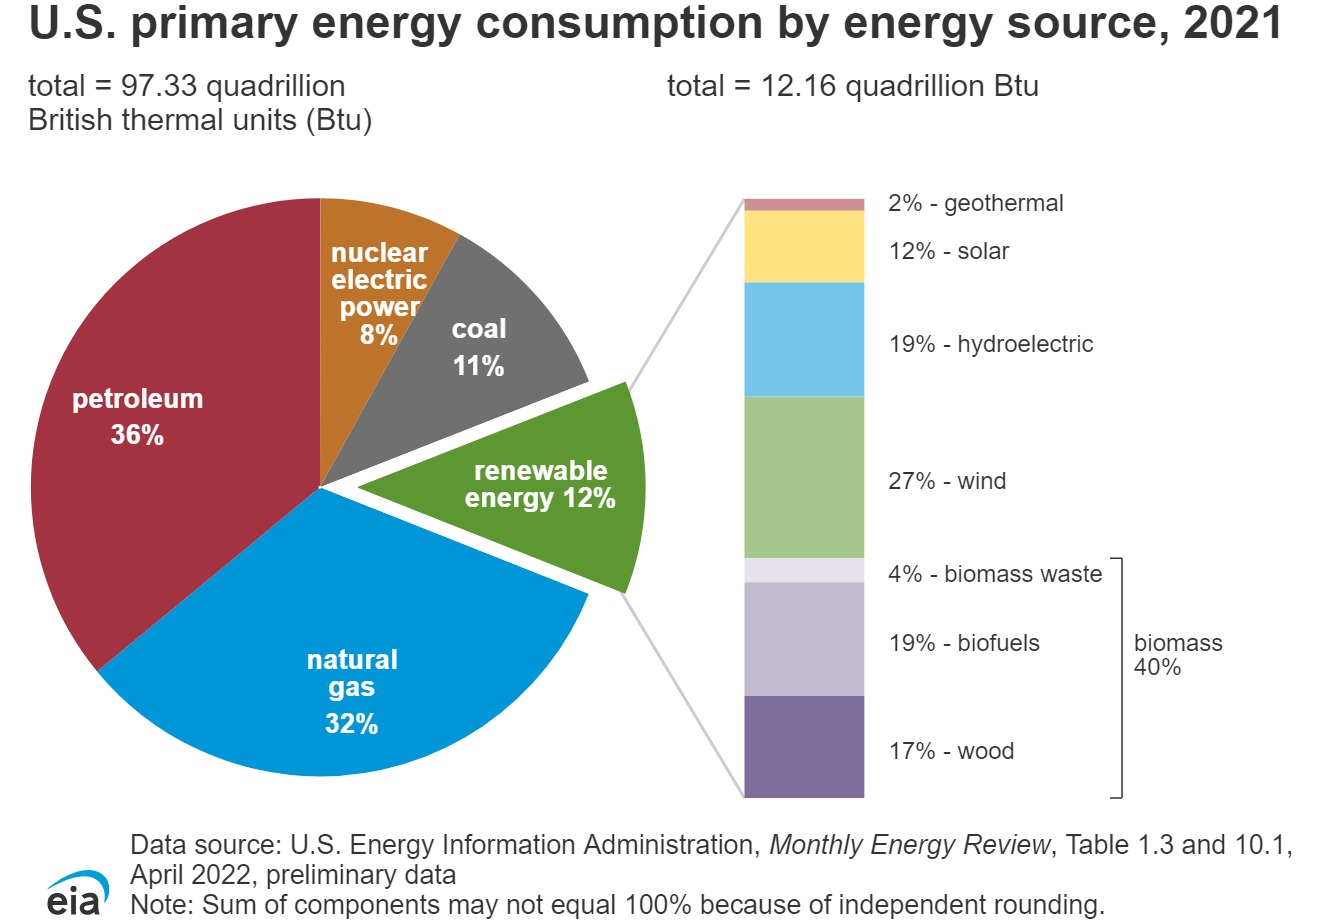
U.S. Energy Consumption by Energy Source
Total = 97.33 quadrillion British thermal units (Btu)
- Petroleum: 36%
- Natural Gas: 32%
- Coal: 11%
- Nuclear electric power: 8%
- Renewable Energy: 12% (12.16 quadrillion Btu)
Renewable energy is broken down as follows:
- Hydroelectric: 19%
- Biomass: 40%
- Wood: 17%
- Biofuels: 19%
- Biomass Waste: 4%
- Wind: 27%
- Solar: 12%
- Geothermal: 2%
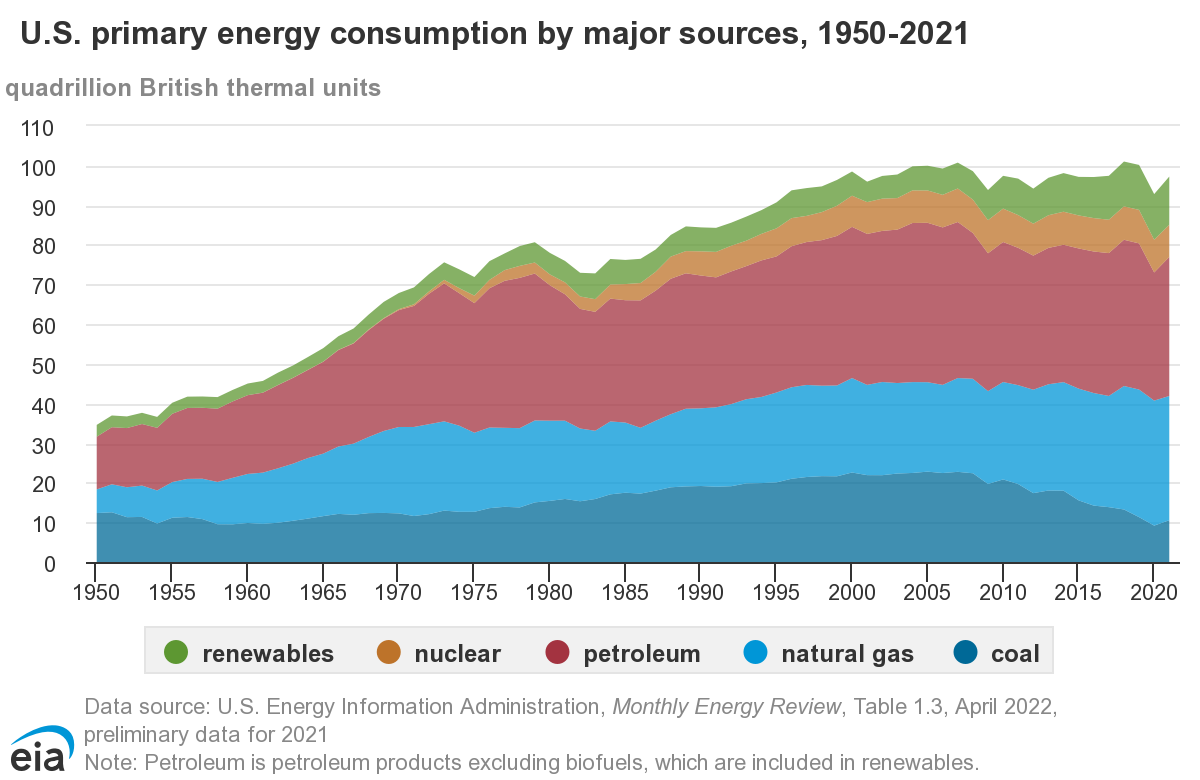
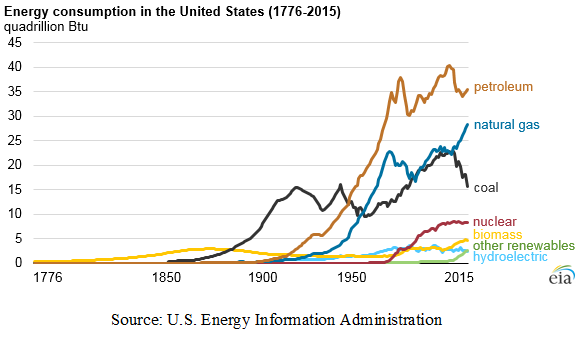
Figure 5, below, illustrates the historical energy consumption in the United States by source. Notice the decline in the use of coal, while natural gas and renewables consumption are increasing. The increase in natural gas consumption has much to do with the following: the current historically low prices resulting from the huge amount of new shale gas being produced, and new tighter emissions standards being imposed on coal-fired power plants. If you are interested to see the historical trend by the source, individually, click on the following link, it is a graph showing the history of energy consumption in the United States from 1750 to 2015.
Alternative energy sources will continue to grow as long as economically feasible, and especially if government subsidies are available to support their production (e.g., – ethanol). Note that EIA publishes annual reports for the US Energy Outlook, which include future projections. If you are interested in the projected energy outlook in the United States, click here. You may notice EIA (Energy Information Administration) is projecting a significant increase in production and consumption from renewables by 2050. While, nuclear production is shown as being stable, and with the negligible emissions they produce.
In addition, as far as natural gas goes, an increase is indicated. The residential use of heating oil and propane is steadily declining as conversions to natural gas steadily continue. (50% of US homes use natural gas for space heating and hot water.) Add to that the retirement of coal plants, or the outright switching from coal to natural gas, and growth in the consumption of natural gas will naturally occur.
The future consumption of oil and “other liquids” will be interesting to observe as well. With automobile efficiency improving and electric cars gaining in popularity, this segment should decline. Also, there are decades-old power plants, mostly in the Northeastern US, that use fuel oil. These, too, will become obsolete or convert to natural gas. (The Northeast US is also the world’s largest consumer of heating oil.)
There should also be a more dramatic decline in the use of coal than what is shown above, as emissions restrictions and lower natural gas prices make coal less economic to use.
The fuels we will study in-depth, natural gas and “oil and other liquids,” comprise more than half of the projected total US energy consumption profile, thus making it crucial to understand the logistics and “value chain” of these fuel sources.
The following chart illustrates the various types of energy in the US and the corresponding consumption types.
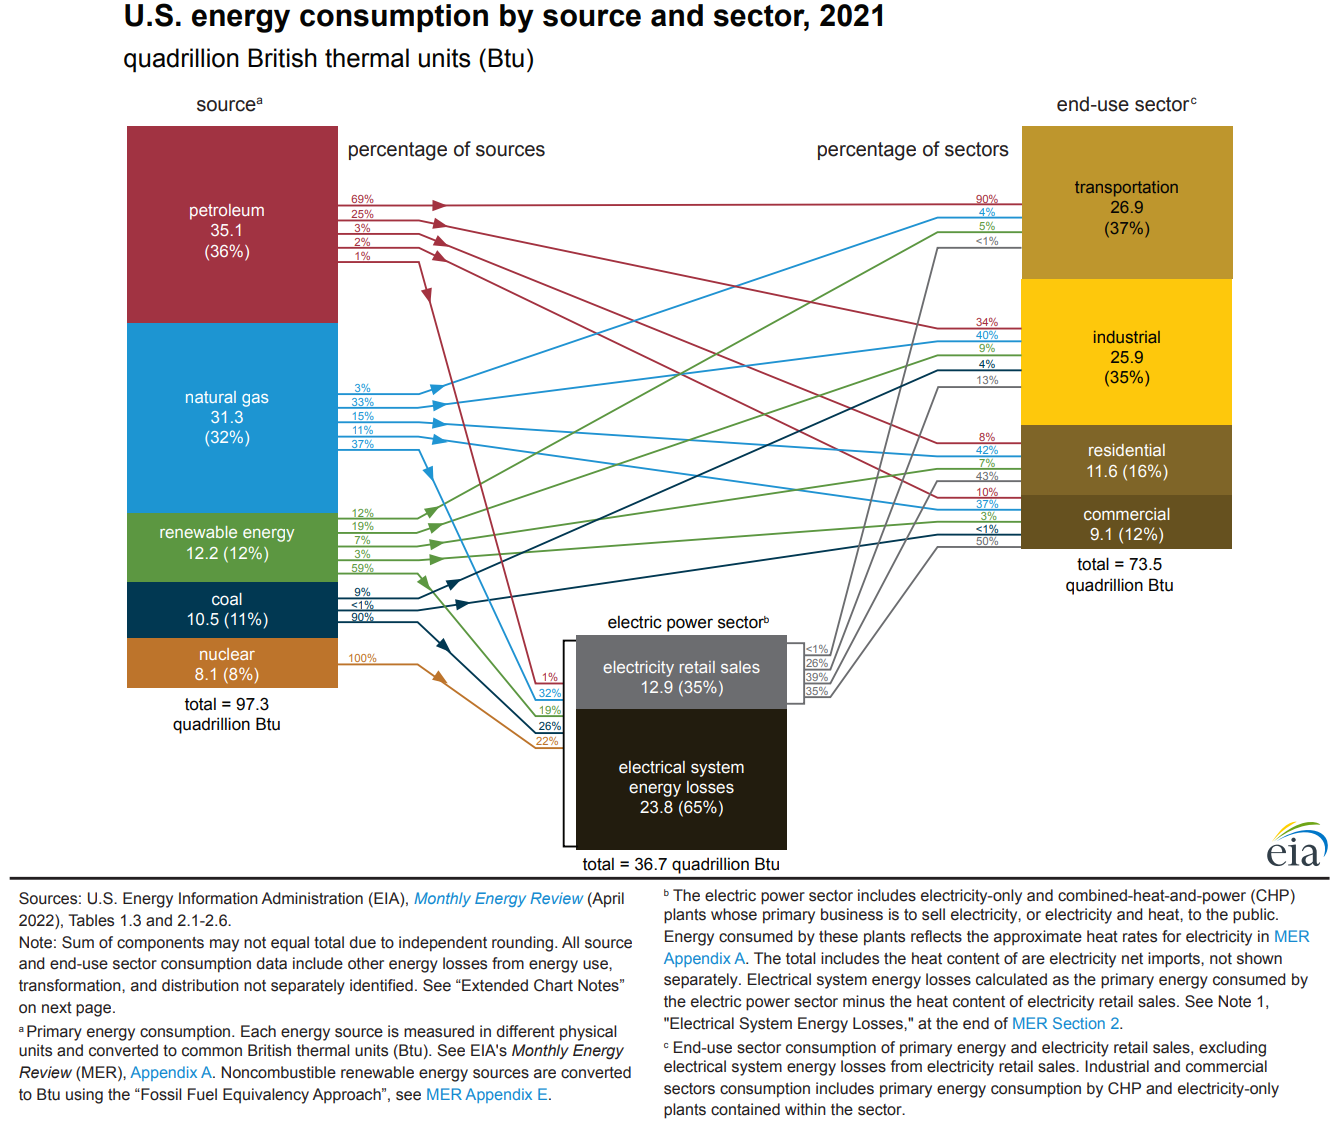
Energy Sources
Petroleum (36%)
69% of the petroleum goes to the Transportation Sector
25% of the petroleum goes to the Industrial Sector
5% of the petroleum goes to the Residential and Commercial Sector
1% of the petroleum goes to the Electric Power Sector
Natural Gas (32%)
3% of the Natural Gas goes to the Transportation Sector
33% of the Natural Gas goes to the Industrial Sector
26% of the Natural Gas goes to the Residential and Commercial Sector
37% of the Natural Gas goes to the Electric Power Sector
Coal (11%)
9% of the coal goes to the industrial sector
<1% of the coal goes to the residential and commercial sector
90% of the coal goes to the Electric Power Sector
Renewable Energy (11%)
12% of the renewable energy goes to the Transportation Sector
19% of the renewable energy goes to the Industrial Sector
10% of the renewable energy goes to the Residential and Commercial Sector
59% of the renewable energy goes to the Electric Power Sector
Nuclear Electric Power (8%)
100% of the nuclear electric power goes to the Electric Power Sector
Energy Consumption by Source
Transportation (27%)
90% of the energy used in this sector comes from petroleum
4% of the energy used in this sector comes from natural gas
5% of the energy used in this sector comes from renewable energy
Industrial (26%)
34% of the energy used in this sector comes from petroleum
40% of the energy used in this sector comes from natural gas
4% of the energy used in this sector comes from coal
9% of the energy used in this sector comes from renewable energy
Residential (16%)
8% of the energy used in this sector comes from petroleum
42% of the energy used in this sector comes from natural gas
7% of the energy used in this sector comes from renewable energy
Commercial (about 28%)
10% of the energy used in this sector comes from petroleum
37% of the energy used in this sector comes from natural gas
<1% of the energy used in this sector comes from coal
3% of the energy used in this sector comes from renewable energy
Electric Power (35%)
1% of the energy used in this sector comes from petroleum
32% of the energy used in this sector comes from natural gas
26% of the energy used in this sector comes from coal
19% of the energy used in this sector comes from renewable energy 2
22% of the energy used in this sector comes from nuclear electric power
In Figure 6, above, we see the energy sources matched-up with their respective categories of consumption. Both petroleum and natural gas are used in each sector of consumption, while coal is utilized in only industrial, residential (this would have to be a very small amount), and power generation. Nuclear energy is strictly used for electric power generation, and renewables can be consumed in all categories but contribute very little to each on a percentage basis.
The sources and uses of energy are important for the overall understanding of the impact of supply, demand, and pricing on the macroeconomic environment. Everything depends on energy, and understanding these interrelationships can help us manage our supply needs and price exposure.