Our relationships with the greenhouse effect and greenhouse gases are complicated. A little bit is a good thing, and it plays a big role in what keeps us comfortable. However, too many greenhouse gases will heat up our planet and dramatically change climates throughout the world. It's also worth mentioning that CO2 is not the only greenhouse gas being produced by human activity.
The concentration of greenhouse gases in the atmosphere has been changing over the past 150 years. Since pre-industrial times, atmospheric concentrations of the gases have increased:
- CO2 has climbed over 31 percent.
- CH4 has climbed over 151 percent.
- N2O has climbed 17 percent.
Scientists have confirmed that this is primarily due to human activities, which include burning coal, oil, and gas, and cutting down forests.
Check this out!
Hold your mouse over the pie chart to see what percentage each gas accounts for in the total greenhouse emissions in the United States, and look at the table below for information about the sources of the gasses.
| Greenhouse Gas | Percent of Total Greenhouse Gases |
|---|---|
| Carbon Dioxide (C02) - Energy Related | 82% |
| Carbon Dioxide (C02) - Other | 2% |
| Methane (CH4) | 9% |
| Nitrous Oxide (N2O) | 5% |
| Other Gases (CFC-12, HCFC-22, CF4, SF6) | 2% |
The following list shows the greenhouse gasses and the source of emission:
- Carbon dioxide (CO2): Energy related CO2: 82% and Other CO2: 2%.
Produced by combustion of solid waste, fossil fuels, and wood and wood products. - Methane (CH4): 9%.
Source is the production and transport of coal, natural gas, and oil. Methane emissions also result from the decomposition of organic wastes in municipal solid waste landfills, and the raising of livestock. - Nitrous Oxide (N2O): 5%.
Produced by agricultural and industrial activities, as well as during combustion of solid waste and fossil fuels. - Other gases (SO2, CFC-12, HCFC-22, Perfluoromethane [CF4], and Sulfur Hexaflouride [SF6]): 2%.
Produced by industrial processes.
As you can see, energy related CO2 and CH4 accounts for 90 percent of the total greenhouse gas emissions in the United States. This highlights the impact of energy use on the environment.

Atmospheric lifetime is the period of time during which a gas changes and is either transformed or removed from the atmosphere.
GWP is an index defined as the cumulative radiative forcing (infrared radiation absorption) between the present and some chosen time horizon caused by a unit mass of gas emitted now, expressed relative to a reference gas such as CO2, as is used here. GWP is an attempt to provide a simple measure of the relative radiative effects of different greenhouse gases. In terms of GWP, methane is a much stronger greenhouse gas (~30x more potent) compared to CO2.
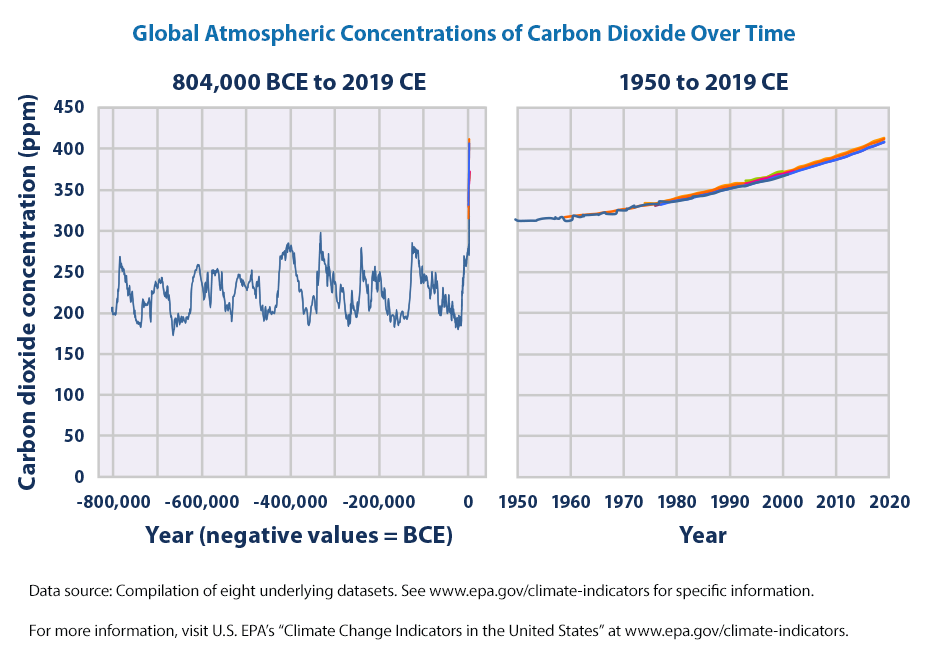
How Has CO2 Concentration Changed?
As you can see from the graph below, CO2 values have risen dramatically in a very short amount of time. These changes correspond to our increased reliance on fossil fuels which took off in the 1900s.
Try This!
Instructions: In the graph below, observe how CO2 concentration in the atmosphere has changed over the past 50 years. Based on your observations, answer the questions that follow.
| Year | Parts per million (ppm) |
|---|---|
| 1960 | 310 |
| 1970 | 320 |
| 1980 | 340 |
| 1990 | 360 |
| 2000 | 380 |
| 2010 | 390 |
| 2020 | 420 |
Data from the graph above was obtained from ice core samples of trapped air. More specifically, ice in the Polar Regions traps air from that particular time period, and then new ice is deposited over the previously deposited ice, trapping more air from the past. Thus, the analysis of ice core samples provides the composition of past air, which can be used to determine the past temperatures.
The increase in the greenhouse gases between 1950 and 2020 is believed to have caused an increase in the global temperature. The mean increase in the global temperature over the past one century is about 1 degree Celsius. However, this is the global average, which does not distinguish between ocean surface and land surface temperatures. The ocean surface increased by about 0.77 degree C whereas land temperatures increased by a staggering 1.43 degree C compared to pre-1900 temperatures. In other words, land areas are heating up about twice as fast!
Instructions: Review the graph below, showing the Annual mean for the Global surface temperature between years 1960 and 2020. The annual mean will show the detailed fluctuations.
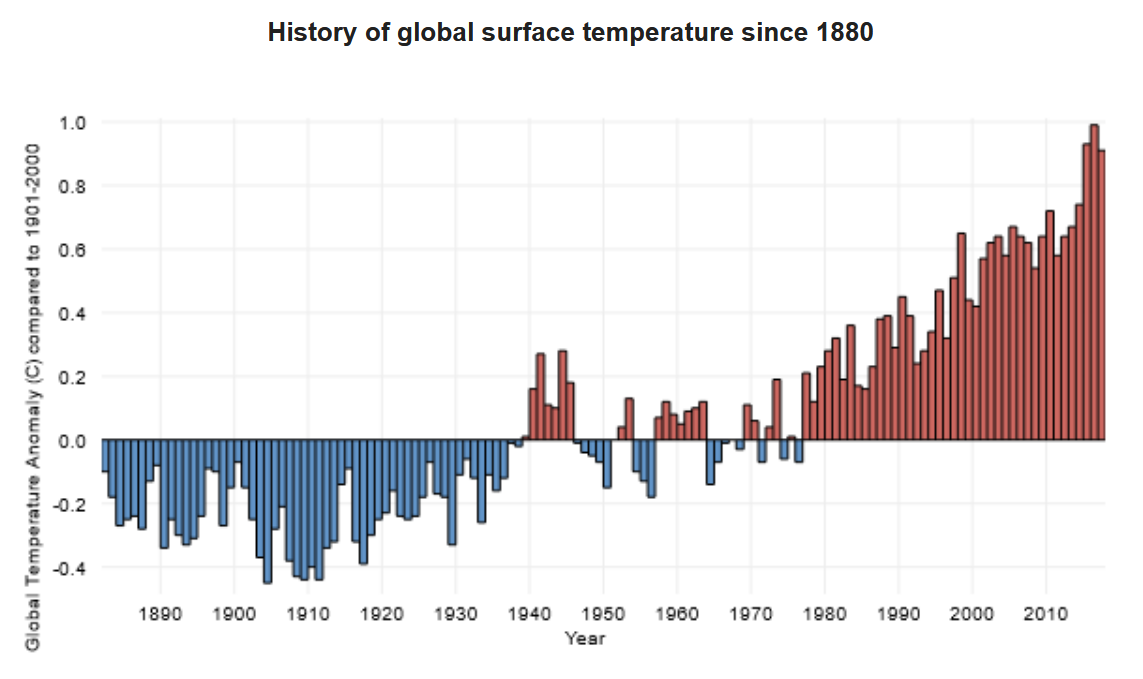

Since 1880, about when the industrial age first started, the average increase in global temperature has been 1 degree Celsius.Not only has there been an increase in temperatures with the increase of greenhouse gasses, there has also been an increase in CO2 emissions from fossil fuels – this has been apparent over the last 150 years (since about 1850).
If we overlay the temperature plot with CO2 emissions, you can see a strong correlation between the rise in temperature and increased CO2 production.
So what will happen in the next few decades? Well, it is hard to say because it depends on what we do in the future. Do we continue to replace fossil fuels with renewables, or do we hold onto our existing practices a bit longer? Experts have tried to predict what will happen to global temperatures based on what we currently know about our climate. A key variable is how much additional CO2 we emit over the next few decades.

These assumptions are used within climate models to predict possible temperature changes into the year 2100.

Though a few degrees doesn't seem like much, this is only the average temperature across the whole planet. In practice, many regions on land will have temperature increases far beyond a few degrees. As such, many predict an increase in the frequency and magnitude of heat waves, forest fires and other nature disasters. These factors are pushing societies to weigh the consequences of cheap fuels with their environmental impacts.