
Example 1
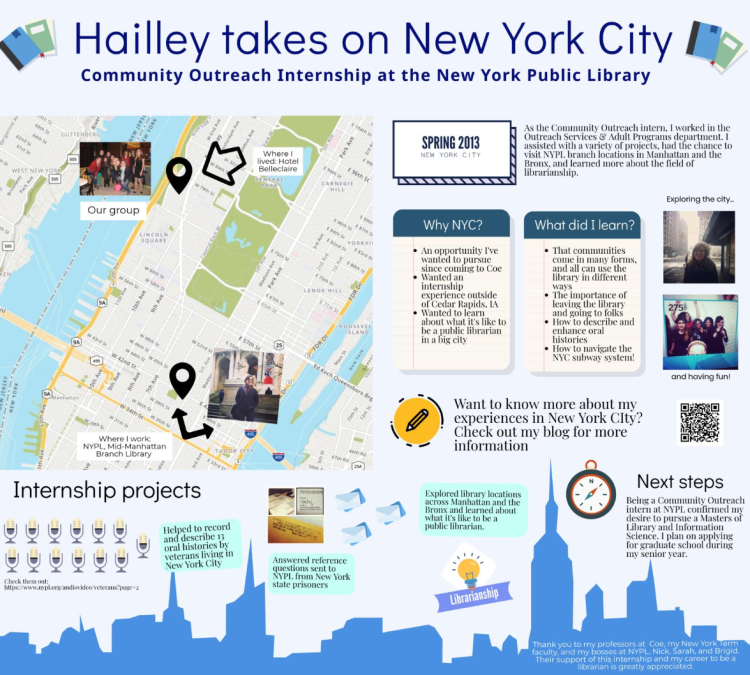
Notice how this infographic tells a story in an interesting and appealing way. It would be an even better example if there were background colors to chunk sections of information.
Example 2
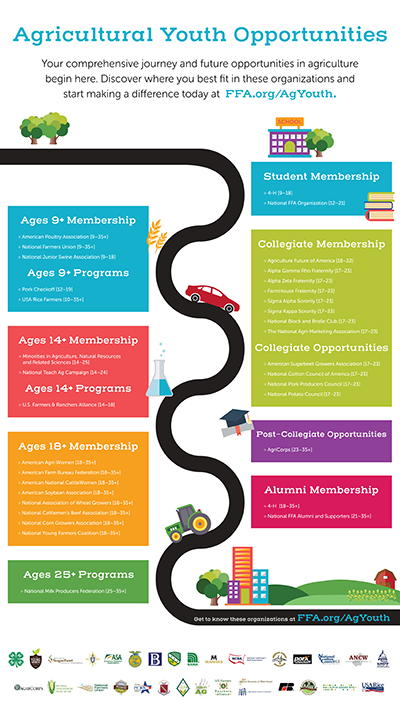
This is a great example: It is attractive. The information is in manageable bits and the road illustrates progression and connection while maintaining it’s not a hard and fast rule.
Agricultural Youth Opportunities
Your comprehensive journey and future opportunities in agriculture begin here. Discover where you best fit in these organizations and start making a difference today at FFA.org/AgYouth
| Age Group | Available Opportunities |
|---|---|
| Age 9+ Membership |
|
| Age 9+ Programs |
|
| Age 14+ Membership |
|
| Age 14+ Programs |
|
| Student Membership |
|
| Ages 18+ Membership |
|
| Collegiate Membership |
|
| Collegiate Opportunities |
|
| Ages 25+ Programs |
|
| Post-Collegiate Opportunities |
|
| Alumni Membership |
|
Get to know these organizations at FFA.org/AgYouth
This infographic leads with a title in blue, larger than the rest of the text, "Agricultural Youth Opportunities". It is then followed by black text explaining what the infographic is about along with a link to the site. Their goal is to explain the different opportunities offered by their organization for different age groups. To show this, they have a black line, resembling a road, winding back and forth between the different groups: Student Membership ⇒ Ages 9+ Membership/Ages 9+ Program ⇒ Collegiate Membership/Collegiate Opportunities ⇒ Ages 14+ Membership/Ages 14+ Programs ⇒ Post-Collegiate Opportunities ⇒ Ages 18+ Membership ⇒ Alumni Membership ⇒ Ages 25+ Programs.
All of the "Ages ___" are on the left side whereas the more specific group labels are on the right (ex: Student, Collegiate, etc.).
In addition to the basic, colorful boxes connected by the winding, black road, there are small graphics of trees, cars, tractors, grain, farm, city-scape, etc. placed strategically on the page.
Example 3
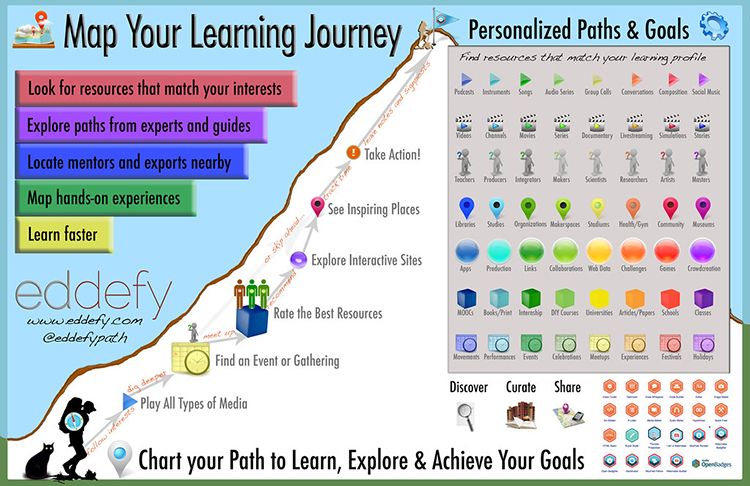
This example shows what you can do when you have a lot of information. It also demonstrates how visuals are essential in telling a story.
Map Your Learning Journey
- Look for resources that match your interests
- Explore paths from experts and guides
- Locate mentors and exports nearby
- Maps hands-on experiences
- Learn faster
Eddefy
@eddefypath
Follow interests à "Play All Type of Media” à dig deeper à “Find an Event or Gathering” à meet up à “Rate the Best Resources” à recommend à “Explore Interactive Sites” à “See Inspiring Places” à trick time à “Take Action!” à leave notes and signposts
OR “Find an Event or Gathering” à or skip ahead… à “See Inspiring Places” à etc.
Personalized Paths & Goals
Find resources that match your learning profile
- Row 1 - Play button
- Blue: Podcasts
- Teal: Instruments
- Dark Green: Songs
- Light Green: Audio Series
- Yellow-Green: Group Calls
- Orange: Conversations
- Red: Composition
- Purple: Social Music
- Row 2 - Clap Board
- Blue: Videos
- Teal: Channels
- Dark Green: Movies
- Light Green: Series
- Yellow-Green: Documentary
- Orange: Livestreaming
- Red: Simulations
- Purple: Stories
- Row 3 - Person Holding "?"
- Blue: Teachers
- Teal: Producers
- Dark Green: Integrators
- Light Green: Makers
- Yellow-Green: Scientists
- Orange: Researchers
- Red: Artists
- Purple: Masters
- Row 4 - Map Pin
- Blue: Libraries
- Teal: Studies
- Dark Green: Organizations
- Light Green: Makerspaces
- Yellow-Green: Stadiums
- Orange: Health/Gym
- Red: Community
- Purple: Museum
- Row 5 - Circle
- Blue: Apps
- Teal: Production
- Dark Green: Links
- Light Green: Collaborations
- Yellow-Green: Web Data
- Orange: Challenges
- Red: Games
- Purple: Crowd Creation
- Row 6 - Cube
- Blue: MOOCs
- Teal: Books/Print
- Dark Green: Internship
- Light Green: DIY Courses
- Yellow-Green: Universities
- Orange: Articles/Papers
- Red: Schools
- Purple: Classes
- Row 7 - Calendar
- Blue: Movements
- Teal: Performances
- Dark Green: Events
- Light Green: Celebrations
- Yellow-Green: Meetups
- Orange: Experiences
- Red: Festivals
- Purple: Holidays
Chart your Path to Learn, Explore & Achieve Your Goals
- Discover
- Curate
- Share
This infographic is very colorful and uses a lot of visual graphics. There is a small graphic of a map with pins on it next to the title in the left corner: “Map Your Learning Journey”. Below that are five blocks of color with text: Red – “Look for resources that match your interests”, purple – “Explore paths from experts and guides”, blue – “Locate mentors and exports nearby”, green – “Maps hands-on experiences”, yellow – “learn faster”. Below that there is the name of the group that made the infographic, the website, and the social-media name. To the right of all of that, in the background, there is a simple mountain. At the bottom left of the mountain, there is a graphic of a hiker and a cat with the safari logo in the black graphic. Then it follows gray, labeled arrows to the top of the mountain. On the top right of the infographic is the title “Personalized Paths & Goals” with the graphic of a cog next to it. Below that is a gray box with the text, “Find resources that match your learning profile” at the top. In the box there are 7 rows each with a different graphic: play button, clapboard, figure holding a “?”, map pin, circle, cube, calendar. Each column is a different color (left to right): blue, teal, dark green, light green, yellow-green, orange, red, purple.
Below the gray box, there are 3 graphics: Magnified-glass, Books, and a Map with a pin. Each with a Label: Discover, Curate, Share. Next to that, there is a collection of 22 hexagons representing “OpenBadges”.
At the very bottom of the infographic is the sentence “Chart you Path to Learn, Explore & Achieve Your Goals”