
What is Economics?
Economics is the study of the allocation of scarce resources.
Resources yield benefits through their use in consumption or production. And resources are scarce when making use of them in one way removes the opportunity to make use of them in another.
For example, we use our time for play or work. And the organizations where we work ask us to perform different tasks in order to fulfill their objectives. A corporation’s primary objective is to earn profits for its owners by creating a product valued by its customers. These organizations receive payments--revenues (or donations if the organization is not a business) --that they use to invest in equipment and to pay workers. And workers use the income derived from work to buy a house, heat a house, or buy a car, or put gasoline in the tank. And then we decide where to go, to play or to work.
All of these decisions require tradeoffs. How much equipment will an organization forgo in order to hire another worker? How much income will we forgo in order to play? How much heat will we forgo in order to travel? Economics provides a framework for thinking about these choices.
Economics and Energy
Worldwide demand for energy is growing rapidly. The U.S. Energy Information Administration (EIA) projects in the 2021 IEO that world-marketed energy consumption will continue to increase. See Figure 1.1. Most of this increase will occur in non-OECD countries. Remember from previous courses who they are? See the Organization for Economic Co-operation and Development (OECD). This energy is going to come from a wide and changing mix of fuel types and end-use sectors (see Figure 1.2.)
In general economic terms, Figure 1.1 is the demand forecast and Figure 1.2 is the supply forecast.
Finally, to provide some important perspective, keep in mind that there is an important difference between total energy use and per capita (per person) energy use. The chart at the bottom of the page demonstrates this, especially when compared to Figure 1.1. Data from International Energy Outlook 2021.
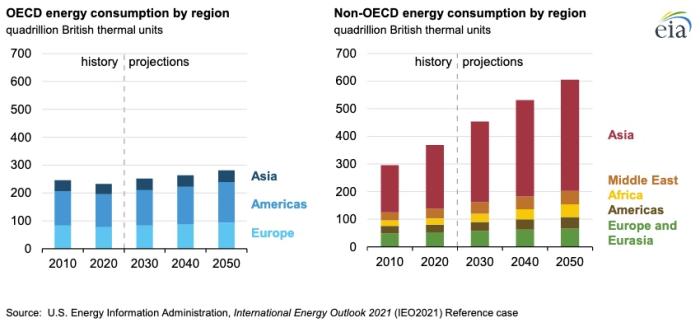
| Year | OECD energy consumption | Non-OECD energy consumption |
|---|---|---|
| 2010 | 243 | 297 |
| 2020 | 230 | 371 |
| 2030 | 248 | 459 |
| 2040 | 261 | 537 |
| 2050 | 279 | 611 |
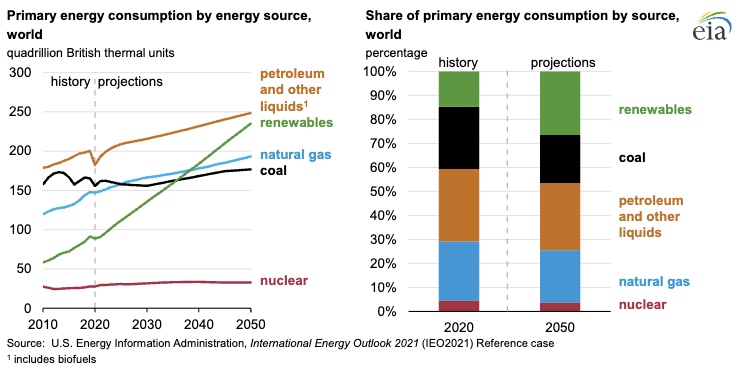
- Reference case data shows decline in coal use through 2030 but that use of all major fuels (petroleum and other liquids, renewables, natural gas, and nuclear) will grow from 2030 to 2050.
- Reference case data also shows that expected changes in government policies and falling technology costs will allow a rise in the use of renewable energies, which will limit the share of global energy use fueled by natural gas.
- In absolute terms, use of coal is expected to decline steadily through 2050 but will remain in the mix due to heavy industrial use in India, local supplies in certain areas, and an increase in coal-fired generating plants in certain parts of Asia.
- A constant pace of growth is projected for liquid fuels consumption through 2050 due to world-wide travel, use of internal combustion engines, and industrial use of petroleum and other liquids.
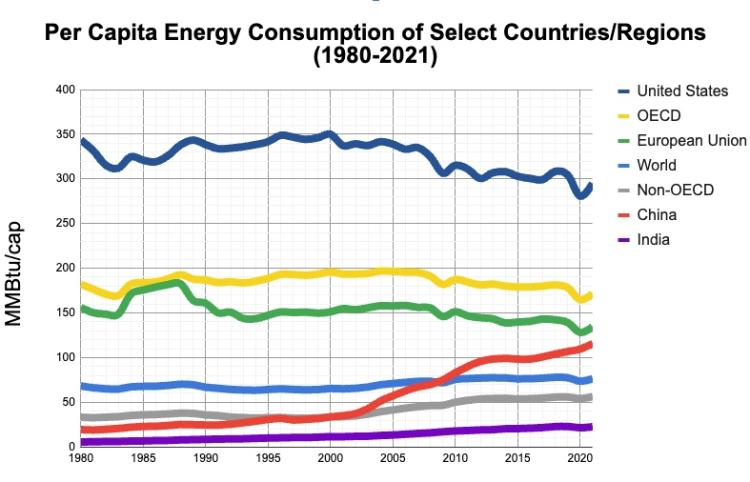
This is a line chart that has seven lines with the date in years across on the X-axis (1980 through 2021) and million Btu’s per person on the Y-axis. The lines on the chart represent the per capita energy consumption of the following geographic areas: the world, OECD nations, non-OECD nations, the EU-27, the United States, China, and India. Numbers below are approximate.
- Until about 2010, the U.S. maintained an emission rate of between 300 and 350 million BTUs per person since 1980, with a drop from around 340 in 2008 to around 290 in 2015. This went back up before 2015 and hovered around the 300 mark, but since in 2020 dived to around 280 before rebounding in 2021.
- OECD nations maintained an emission rate of approximately 200 million BTUs per person since 1980, with a slight downward trend since 2008 and a 2021 number of around 275 million.
- The European Union has maintained an emission rate of approximately 150 million BTUs per person since 1980, with a slight downward trend since 2008.
- World averages have maintained a relatively steady 60 million BTUs per person from 1980 through the early 1990's, but have been slowly moving upward to nearly 80 MMBtu/cap in 2015 and beyond.
- Non-OECD nations averaged approximately 25 million BTUs per person from 1980 through 2002, then slowly increased to a little over 50 million BTUs per person in 2016 and have continued to hover just above the 50 million mark.
- China slowly increased from around 20 million BTUs per person in 1980 to about 40 million BTUs per person in 2002, then had a sharp increase to nearly 100 million BTUs per person in 2016. That trajectory has continued so that in 2021, the mark is approaching 125 million. This is by far the most dramatic increase over a short period of time in this chart.
- India has increased at a very gradual rate from approximately 5 million BTUs per person in 1980 to around 22 million BTUs per person in 2021.
In the wild scramble to meet soaring demand with limited resources (ah ha, “scarce resources”!), the situation is made far more complicated by volatile external issues such as those involving the environment (from emissions and climate change to land use and biodiversity), security (energy independence) and local health and economies. Issues such as these, which are addressed outside of normal market transactions ("external to the market"), are called externalities or nonmarket factors and are the subject of this course.
A Note on Decoupling and Emissions Goals
The IEO 2020 notes that despite energy use growing at around 1% per year through 2050, global GDP is expected to grow between 2.4% and 3.7% per year. While GDP is increasingly regarded as an inadequate way to measure the health of an economy and the people in it (see e.g. Lesson 2 from Energy and Sustainability in Contemporary Culture for some insight), it does provide a reasonably good snapshot of total economic activity. Energy use increasing at a lower rate than economic growth represents a partial decoupling of energy and economic growth. There is some debate on whether total economic growth is needed or not (redistribution would likely do the trick), but the global economy is likely to keep growing regardless. Assuming that, it would be ideal if energy use becomes entirely decoupled from economic growth. Greenhouse gas emissions must not only be decoupled from economic growth but there is wide agreement that net emissions must be zero in the next 30 - 40 years. There is some indication that we may have decoupled emissions from growth, but that is not enough.
To Read Now
At this point, please complete Reading Assignment 1-- Market and Non-Market Environments. This is located under the Lesson 01 subheading in the Modules tab in Canvas. (Read everything through "Change in the Nonmarket Environment.")